


Score Stocks Objectively
The rating system converts price behavior, momentum and trend data into a single numerical score. Remove emotional bias with quantitative comparison.
Filter Candidates Efficiently
With thousands of stocks available, the rating acts as a first-pass filter. Only stocks scoring above your threshold make the watchlist.
Narrow Your Stock Universe
Use the rating as a screening layer, not a standalone signal. Once a stock scores highly, apply your own entry timing and risk management.
How does the rating system calculate scores?
The indicator applies a mathematical formula converting price behavior, momentum and trend data into a single numerical score. This removes emotional bias by producing an objective ranking based on measurable technical criteria.
What methodology does the rating system follow?
The system follows Markos Katsanos' methodology from his June 2018 Stocks and Commodities article. This published, peer-reviewed approach means the logic is transparent and reproducible. You can verify exactly how scores are calculated.
Should I trade solely based on the rating score?
The rating score works best as a screening layer, not a standalone signal. Once a stock scores highly, apply your own entry timing, risk management and fundamental checks. Think of it as a shortlist generator for finding candidates.
⭐️
⭐️
⭐️
⭐️
⭐️


✍️
By Author
More by NinjaTrader_Jim

🤖
by NinjaTrader_Jim

Free
NinjaTrader Indicator
MeanReversal Strategy NT8
🔑
🌐
🏅
MeanReversal Strategy NT8 is a NinjaTrader Indicator based on Anthony Garner’s 2019 backtested mean-reversion strategy, identifying assets that have moved to extremes from their mean for potential reversion.

🤖
by NinjaTrader_Jim

Free
NinjaTrader Indicator
Probability Distribution NT8
🔑
🏅
Probability Distribution NT8 is a NinjaTrader Indicator that calculates probability distributions for price data, based on statistical methods introduced by John F. Ehlers.
🔥
New Listings
Featured this week


🤖
Similar Listings
Traders also viewed
All

🤖
by NinjaTrader_AlanP
Free
NinjaTrader Indicator
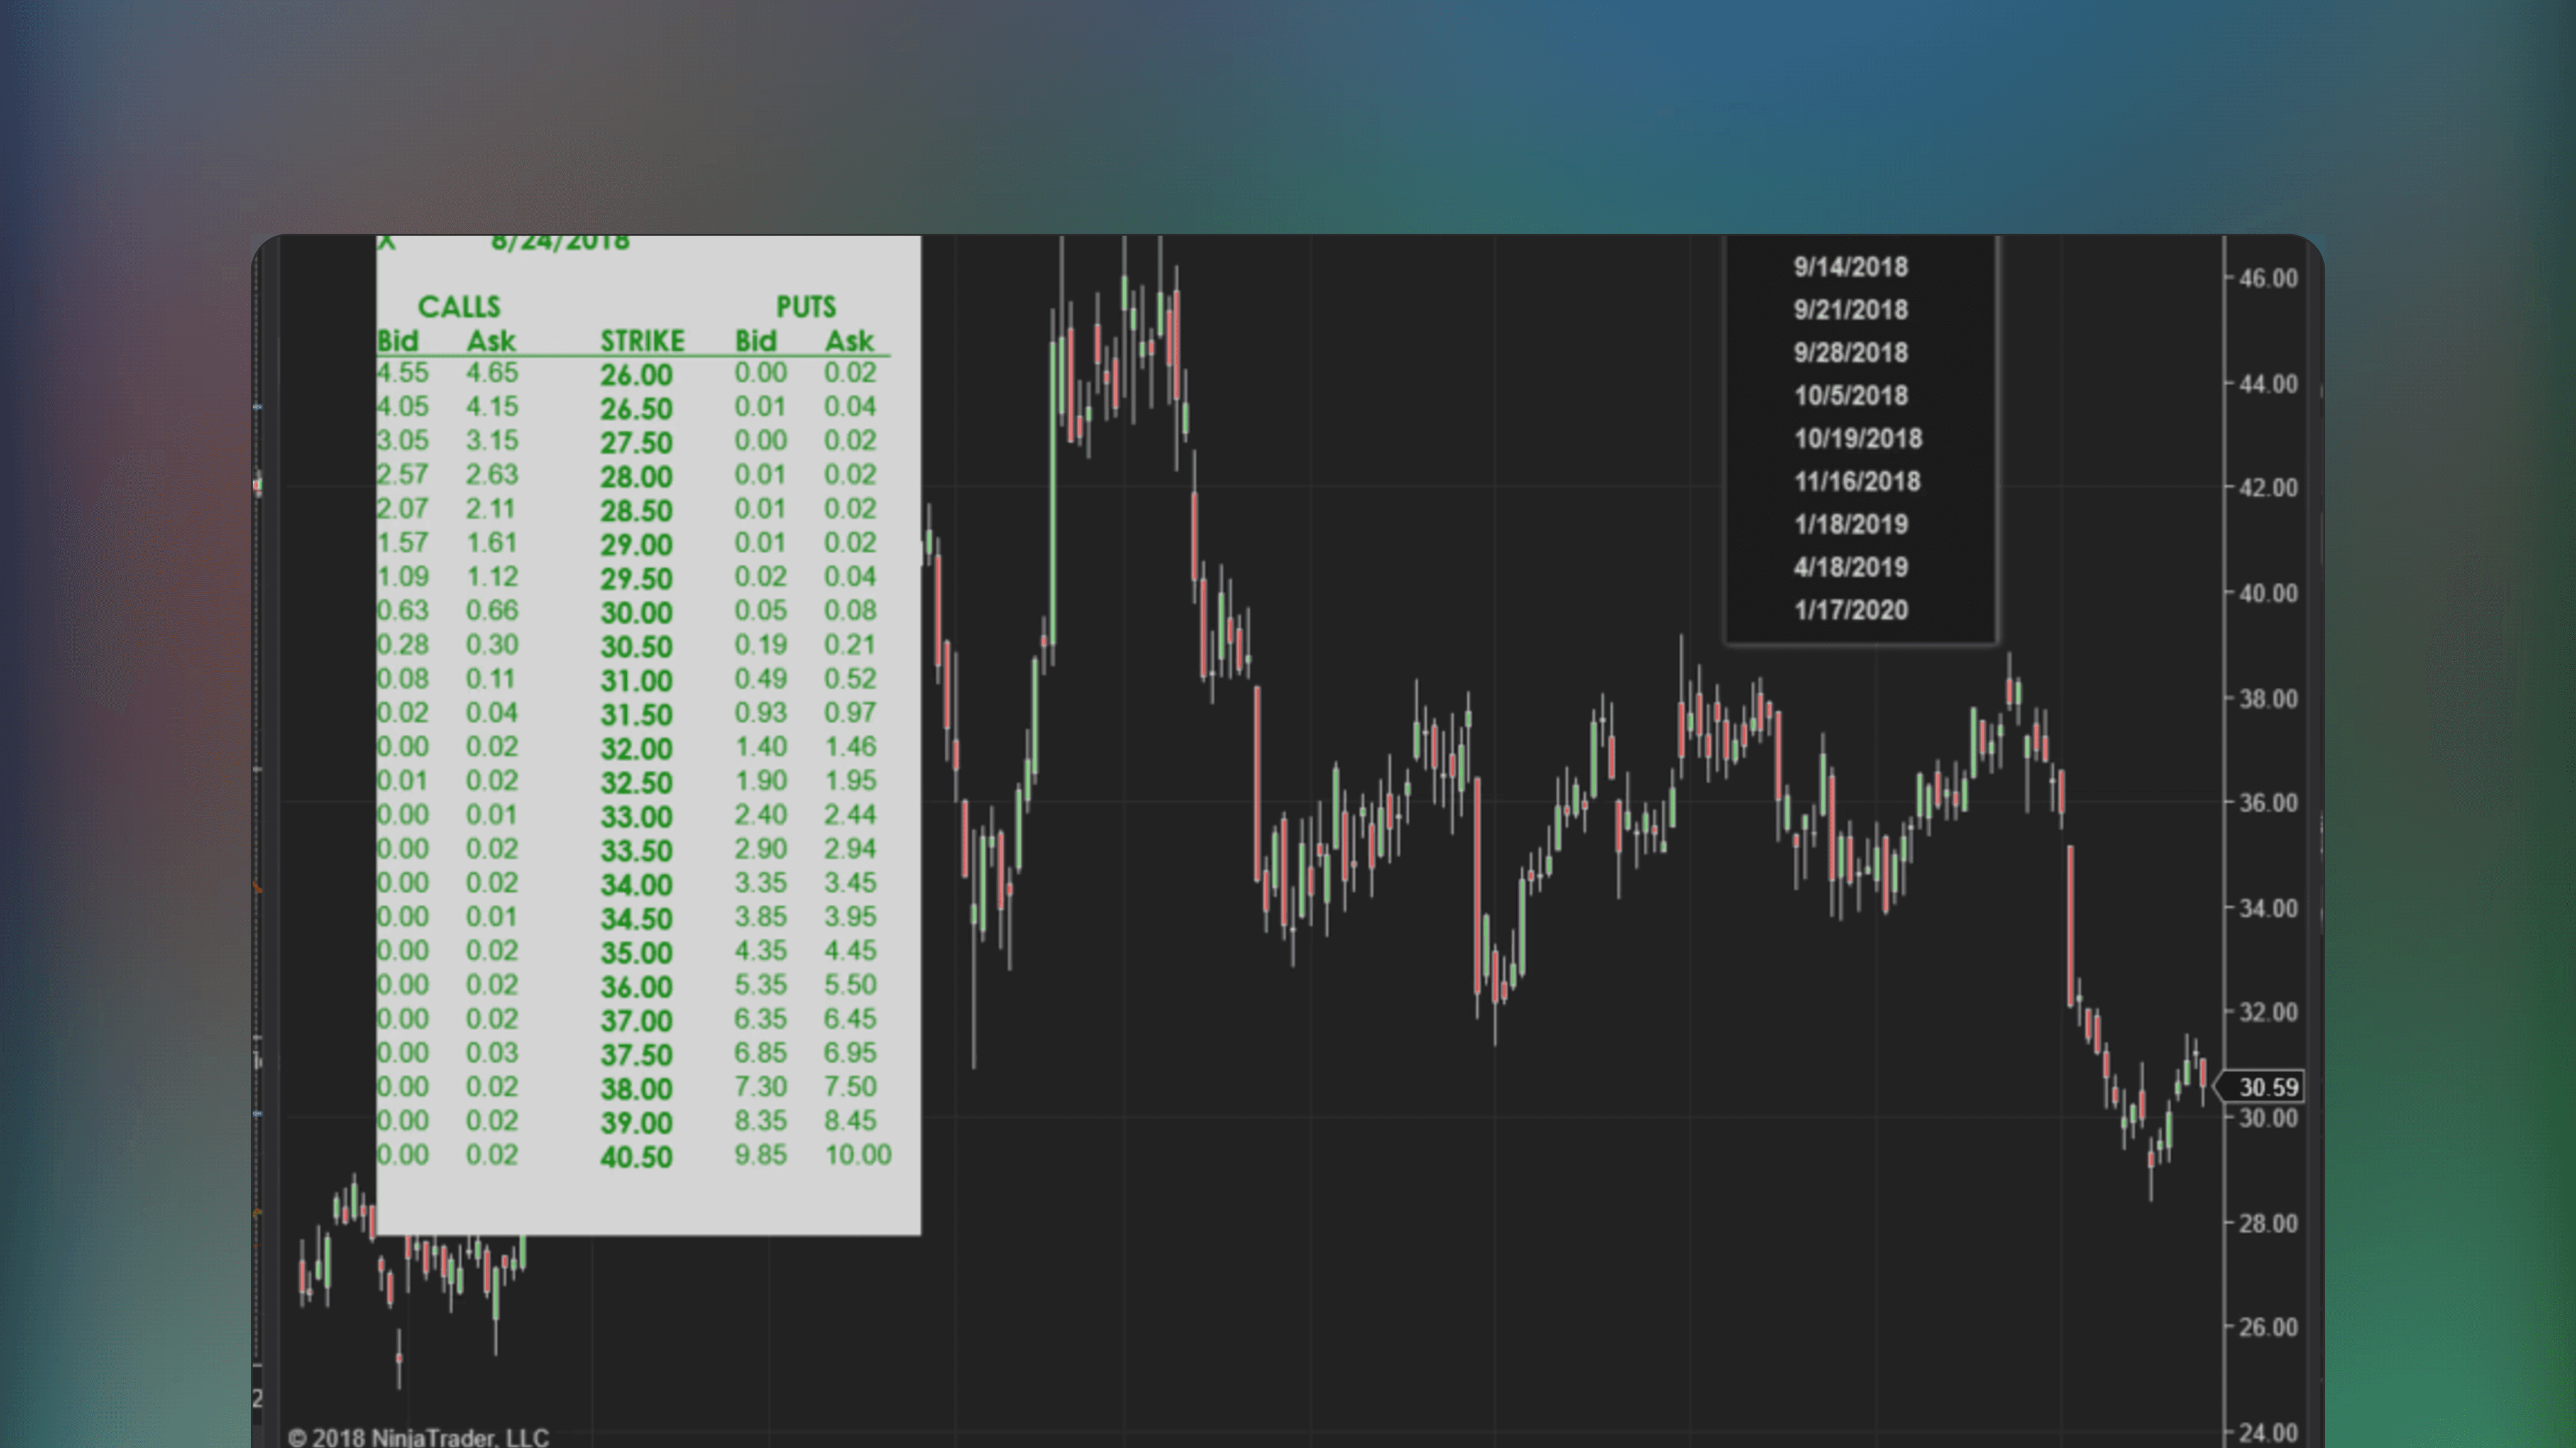
Options: Equity Options Chain Rendered on Chart Indicator
🔑
🌐
✅
🏅
Options: Equity Options Chain Rendered on Chart Indicator is a NinjaTrader indicator that integrates Yahoo’s options data on the chart directly. Pull up the options dashboard to aid your analysis whenever needed.
🤖
by NinjaTrader_AlanP
Free
NinjaTrader Indicator
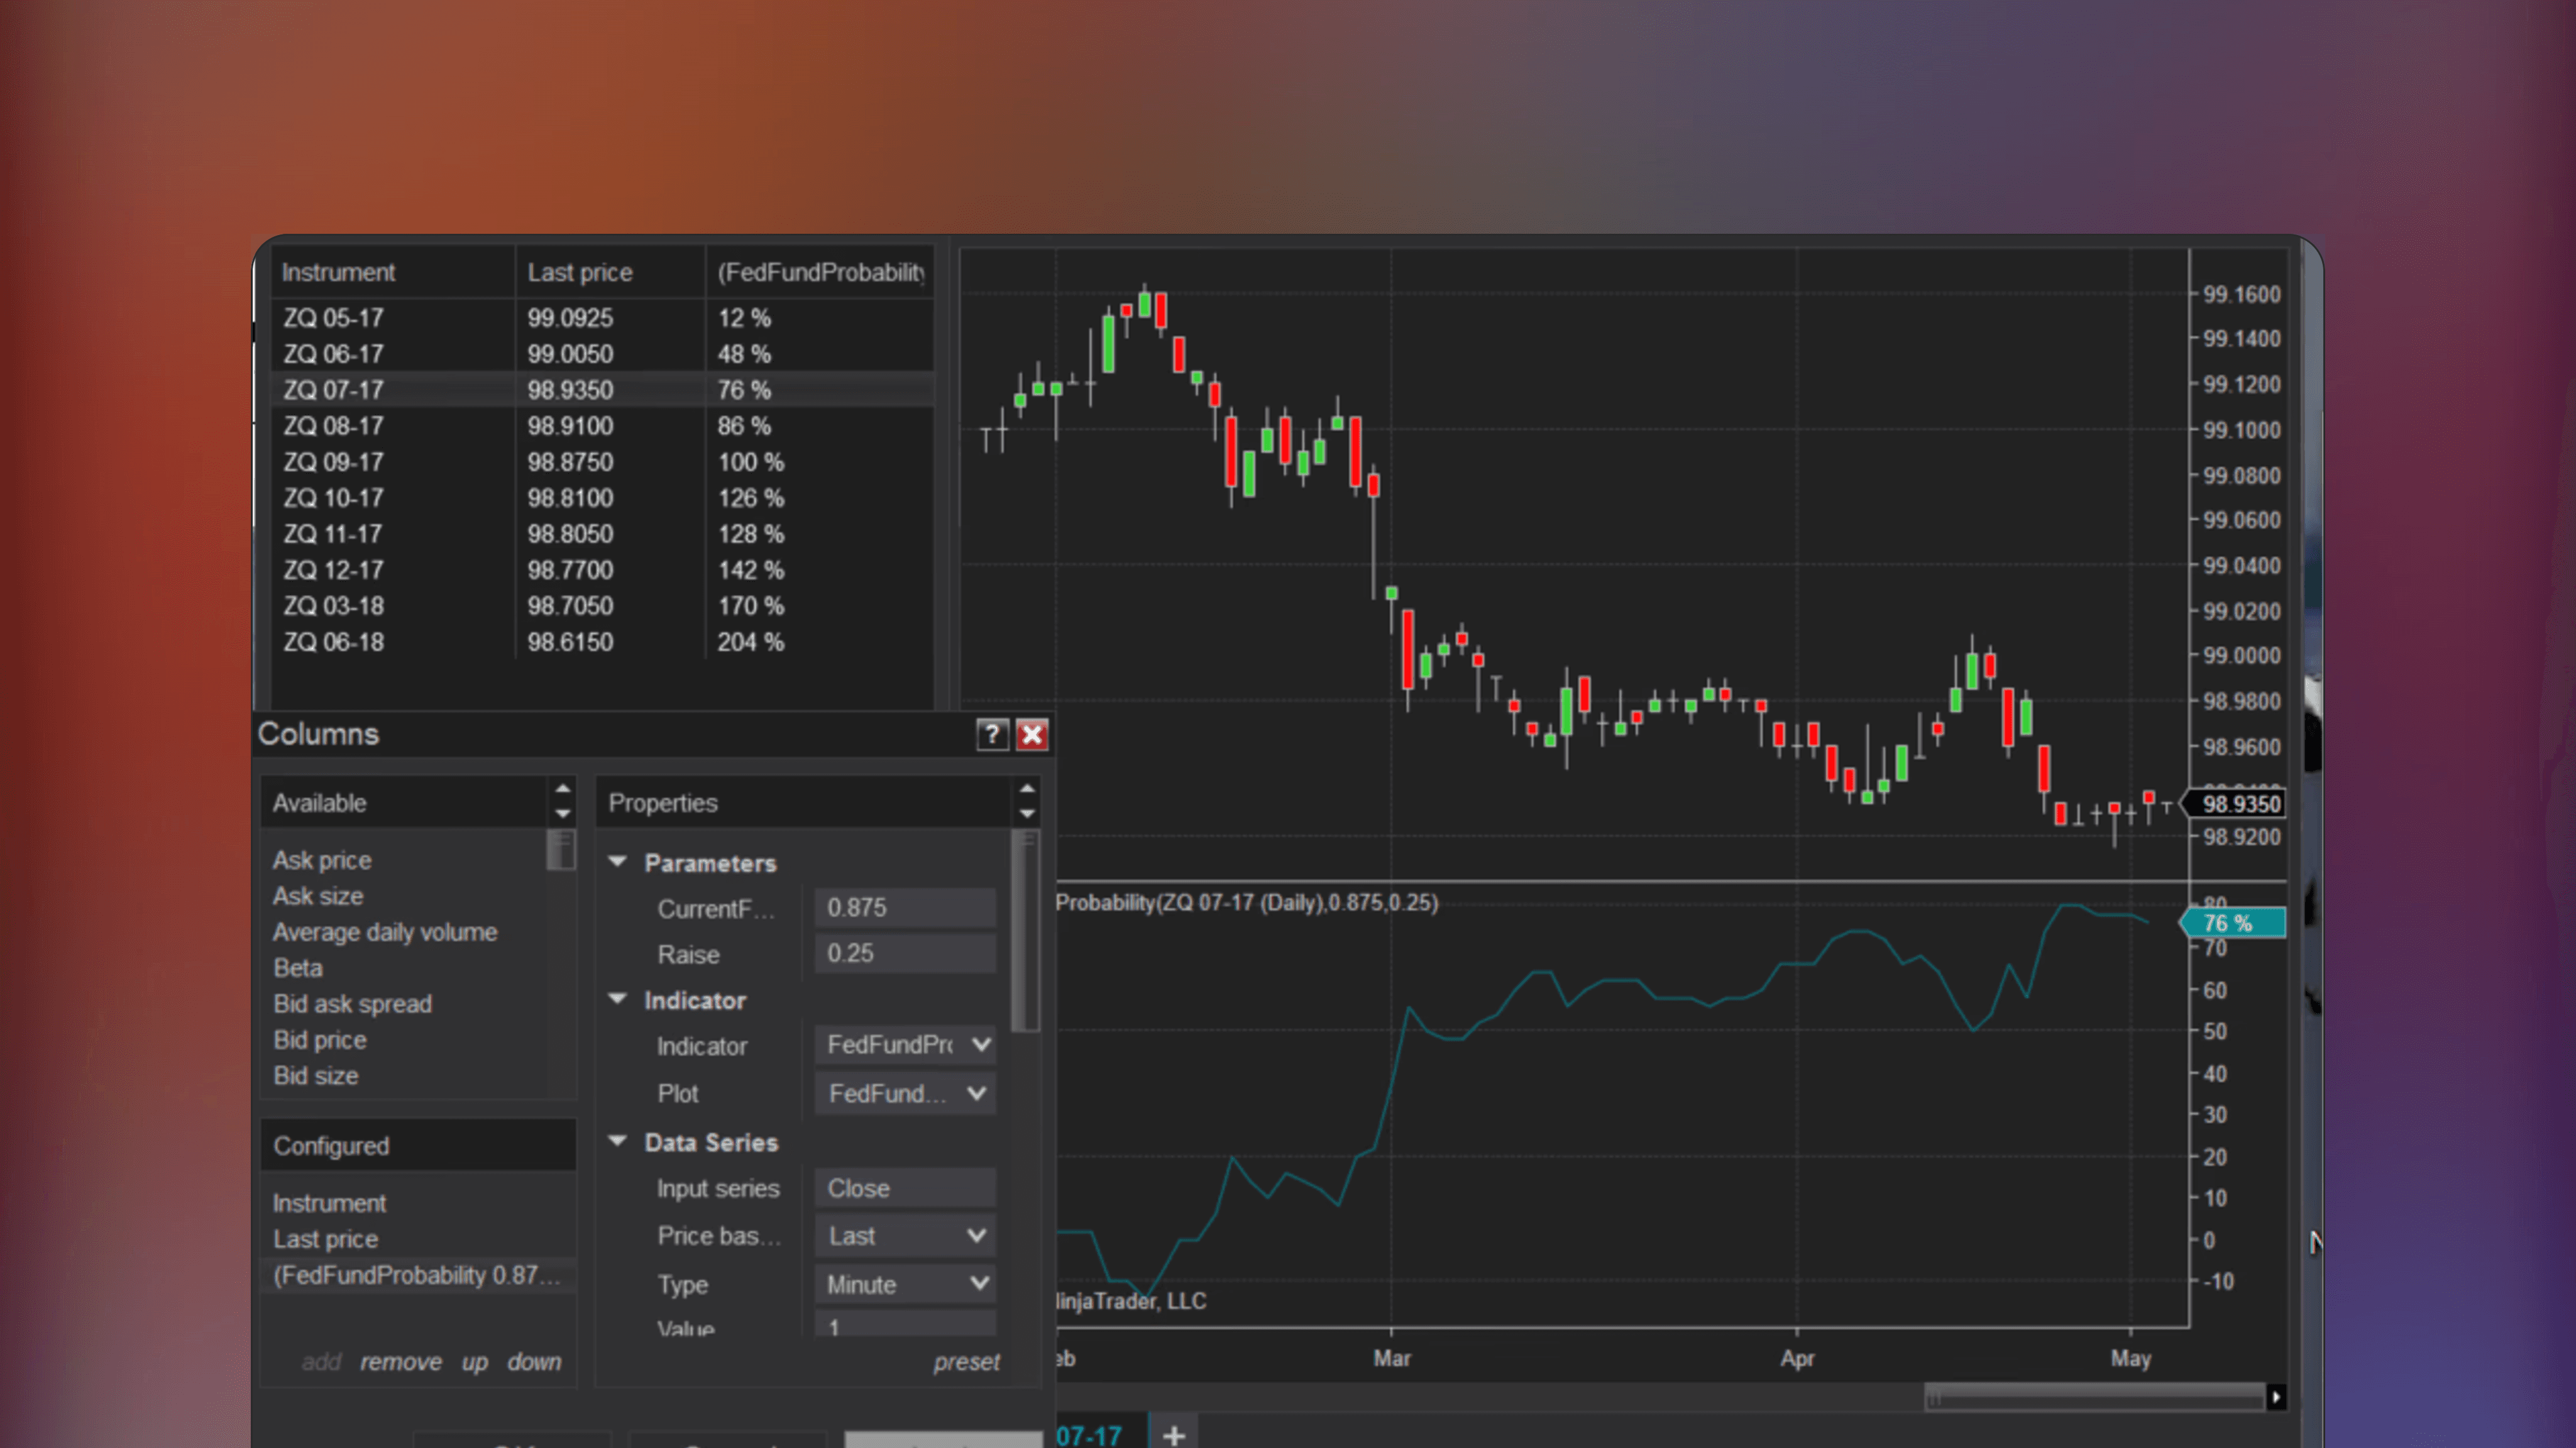
Fedfundprobability Indicator
🔑
🌐
✅
🏅
The Fedfundprobability Indicator is a NinjaTrader indicator that estimates the probability of specific FED interest rate hikes or cuts using FED futures contracts.

🤖
by siroki
Free
NinjaTrader Indicator
Sessioncolors
🔑
🌐
✅
Sessioncolors is a NinjaTrader indicator that marks and customizes the start and end times of the Asia, London, and New York trading sessions on a price chart. Identify trading sessions using colored boxes with adjustable visuals for each.
🤖
by NinjaTrader_Jim
Free
NinjaTrader Indicator
Probability Distribution NT8
🔑
🏅
Probability Distribution NT8 is a NinjaTrader Indicator that calculates probability distributions for price data, based on statistical methods introduced by John F. Ehlers.

🤖
by NinjaTrader_AdamP
Free
NinjaTrader Indicator
Spread Indicator With Candlesticks
🔑
Spread Indicator With Candlesticks is a free NinjaTrader indicator that visualizes bid-ask spreads by plotting them as easy to read candlesticks on trading charts.
🤖
by NinjaTrader_Gaby
Free
NinjaTrader Indicator
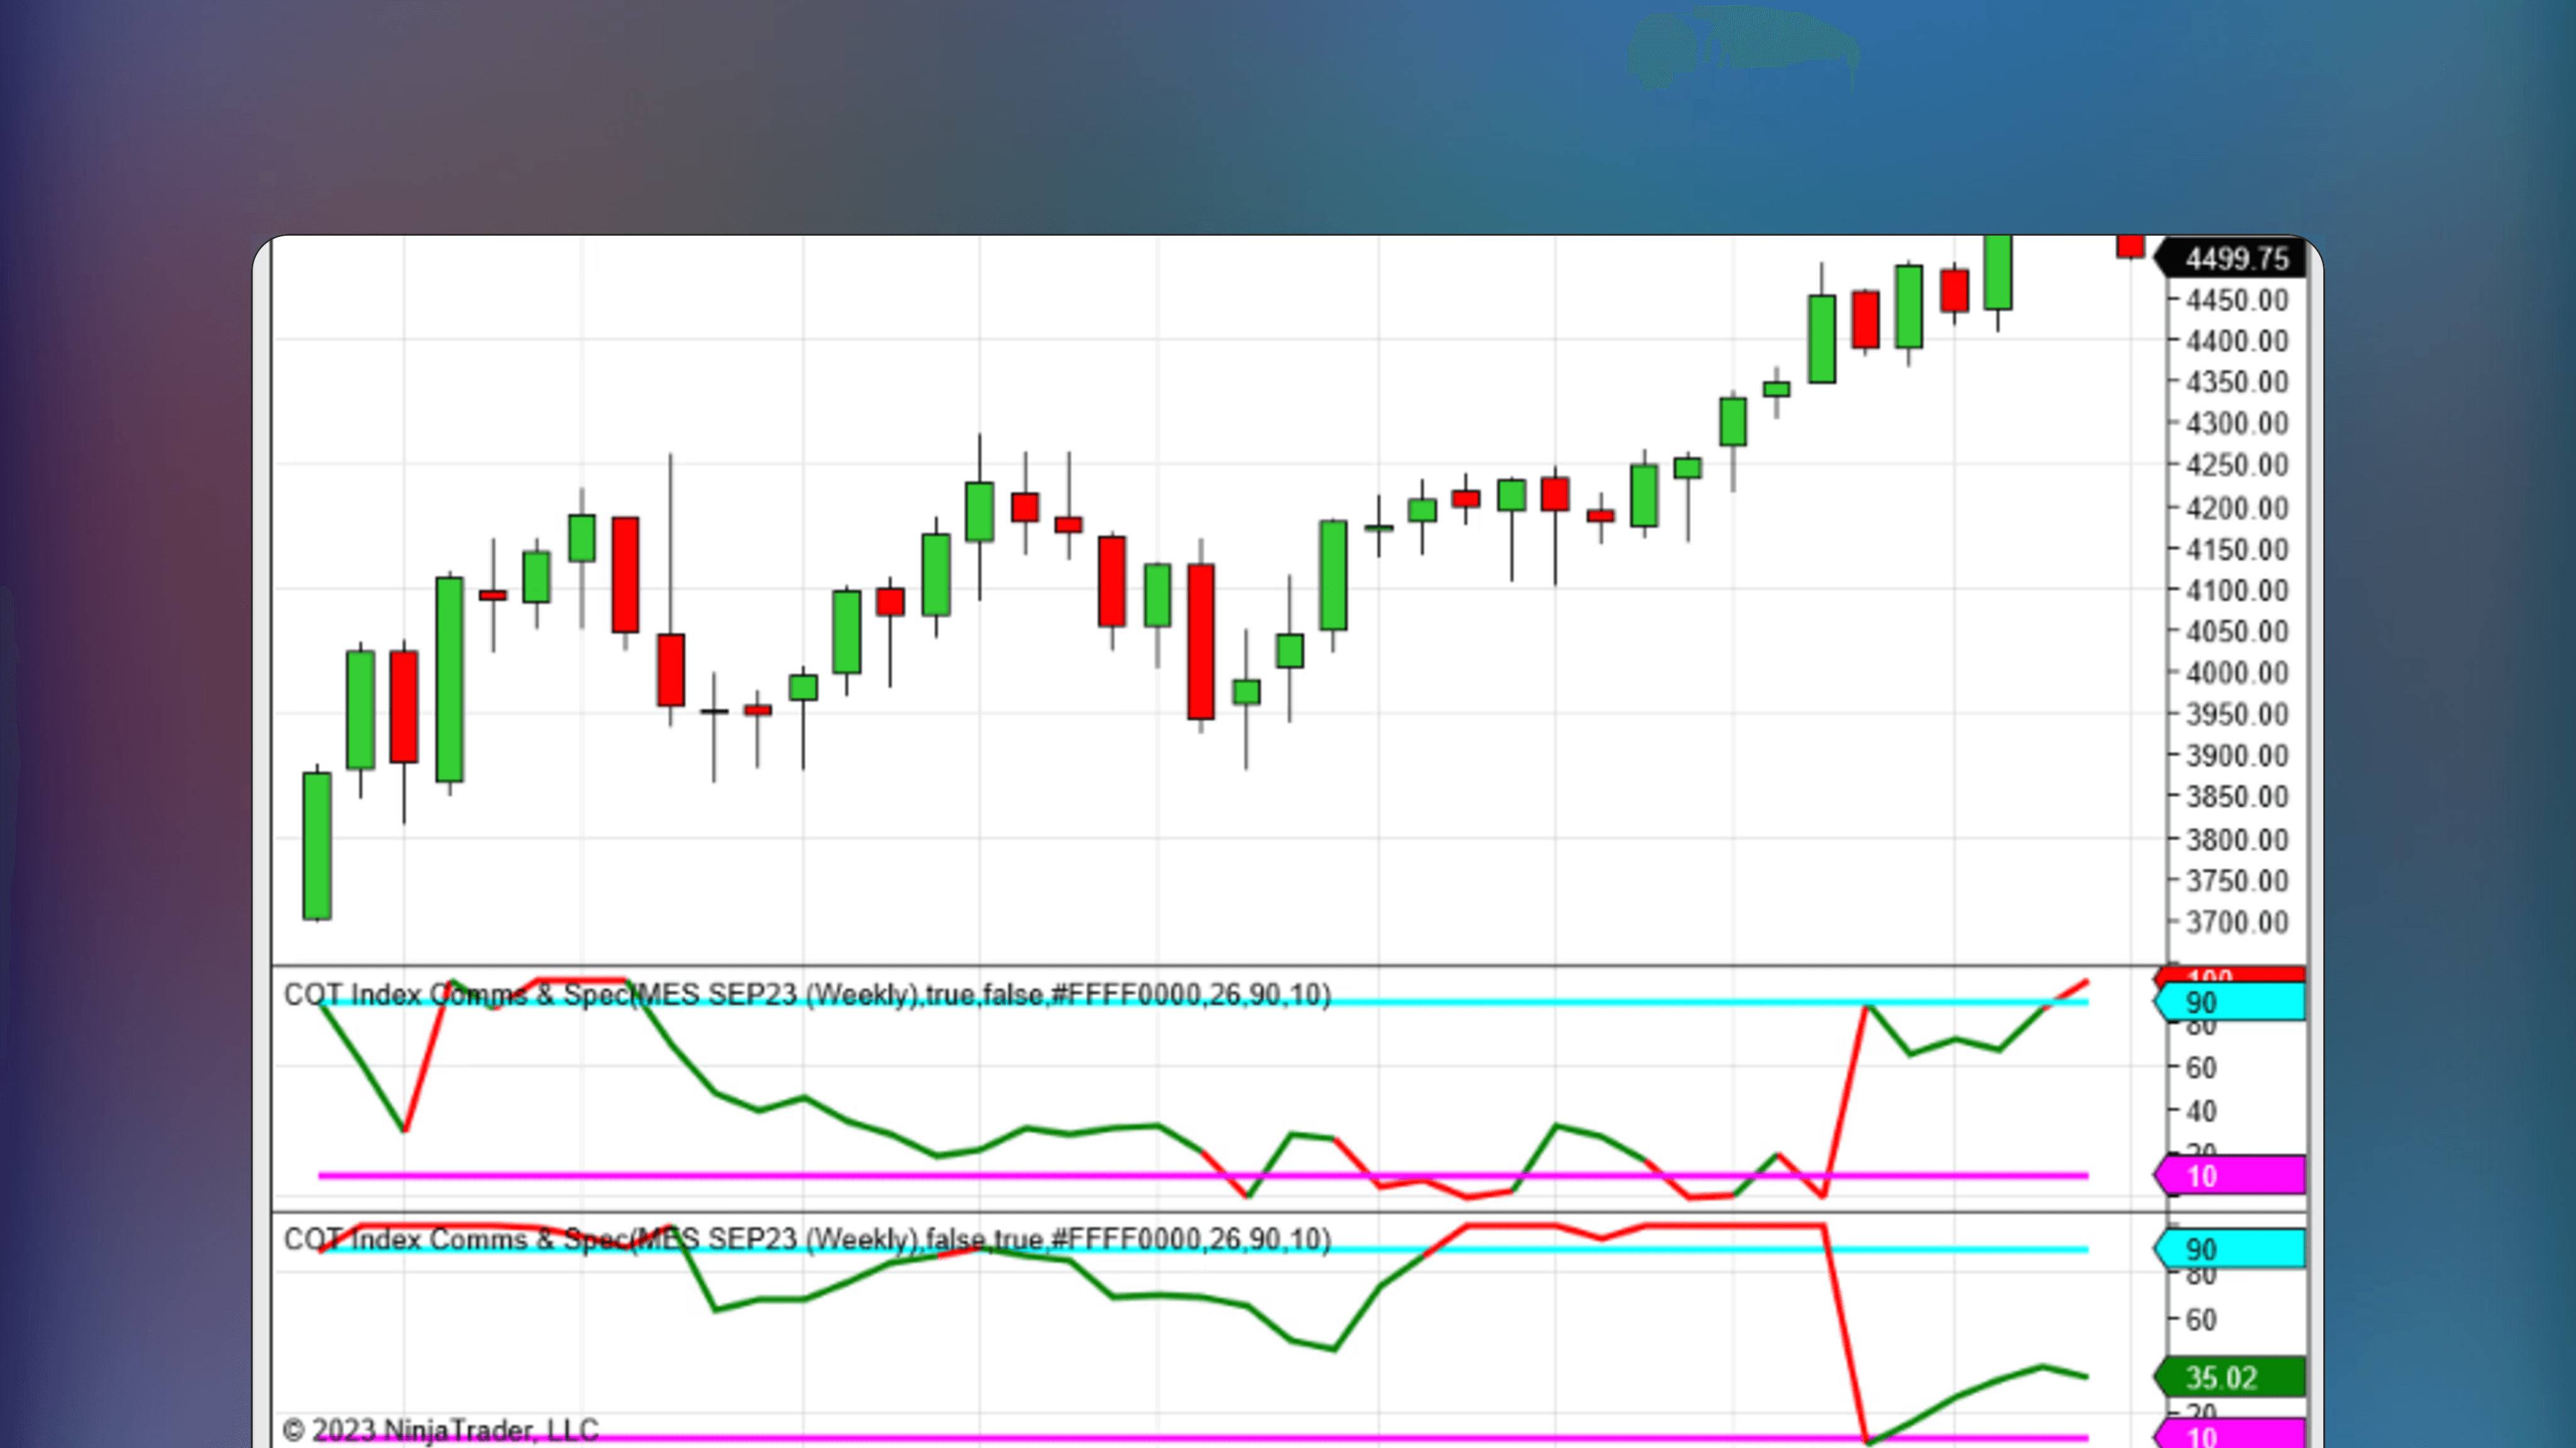
COT Index Comms & Spec NT8
🔑
🌐
✅
COT Index Comms & Spec NT8 is a NinjaTrader indicator that aggregates futures traders' positions using the COT index, providing data on positioning and sentiment.

🤖
by StevenL
Free
NinjaTrader Indicator
Futures Settlement Lines
🔑
🌐
Futures Settlement Lines is a NinjaTrader indicator that plots the last two futures contract settlement prices from the end of Regular Trading Hours, showing how current prices interact with these key closing levels.