


Monitor Global Liquidity Shifts
Ahead of each FOMC meeting, rate probabilities shift as economic data releases. Watch these shifts to position before announcements.
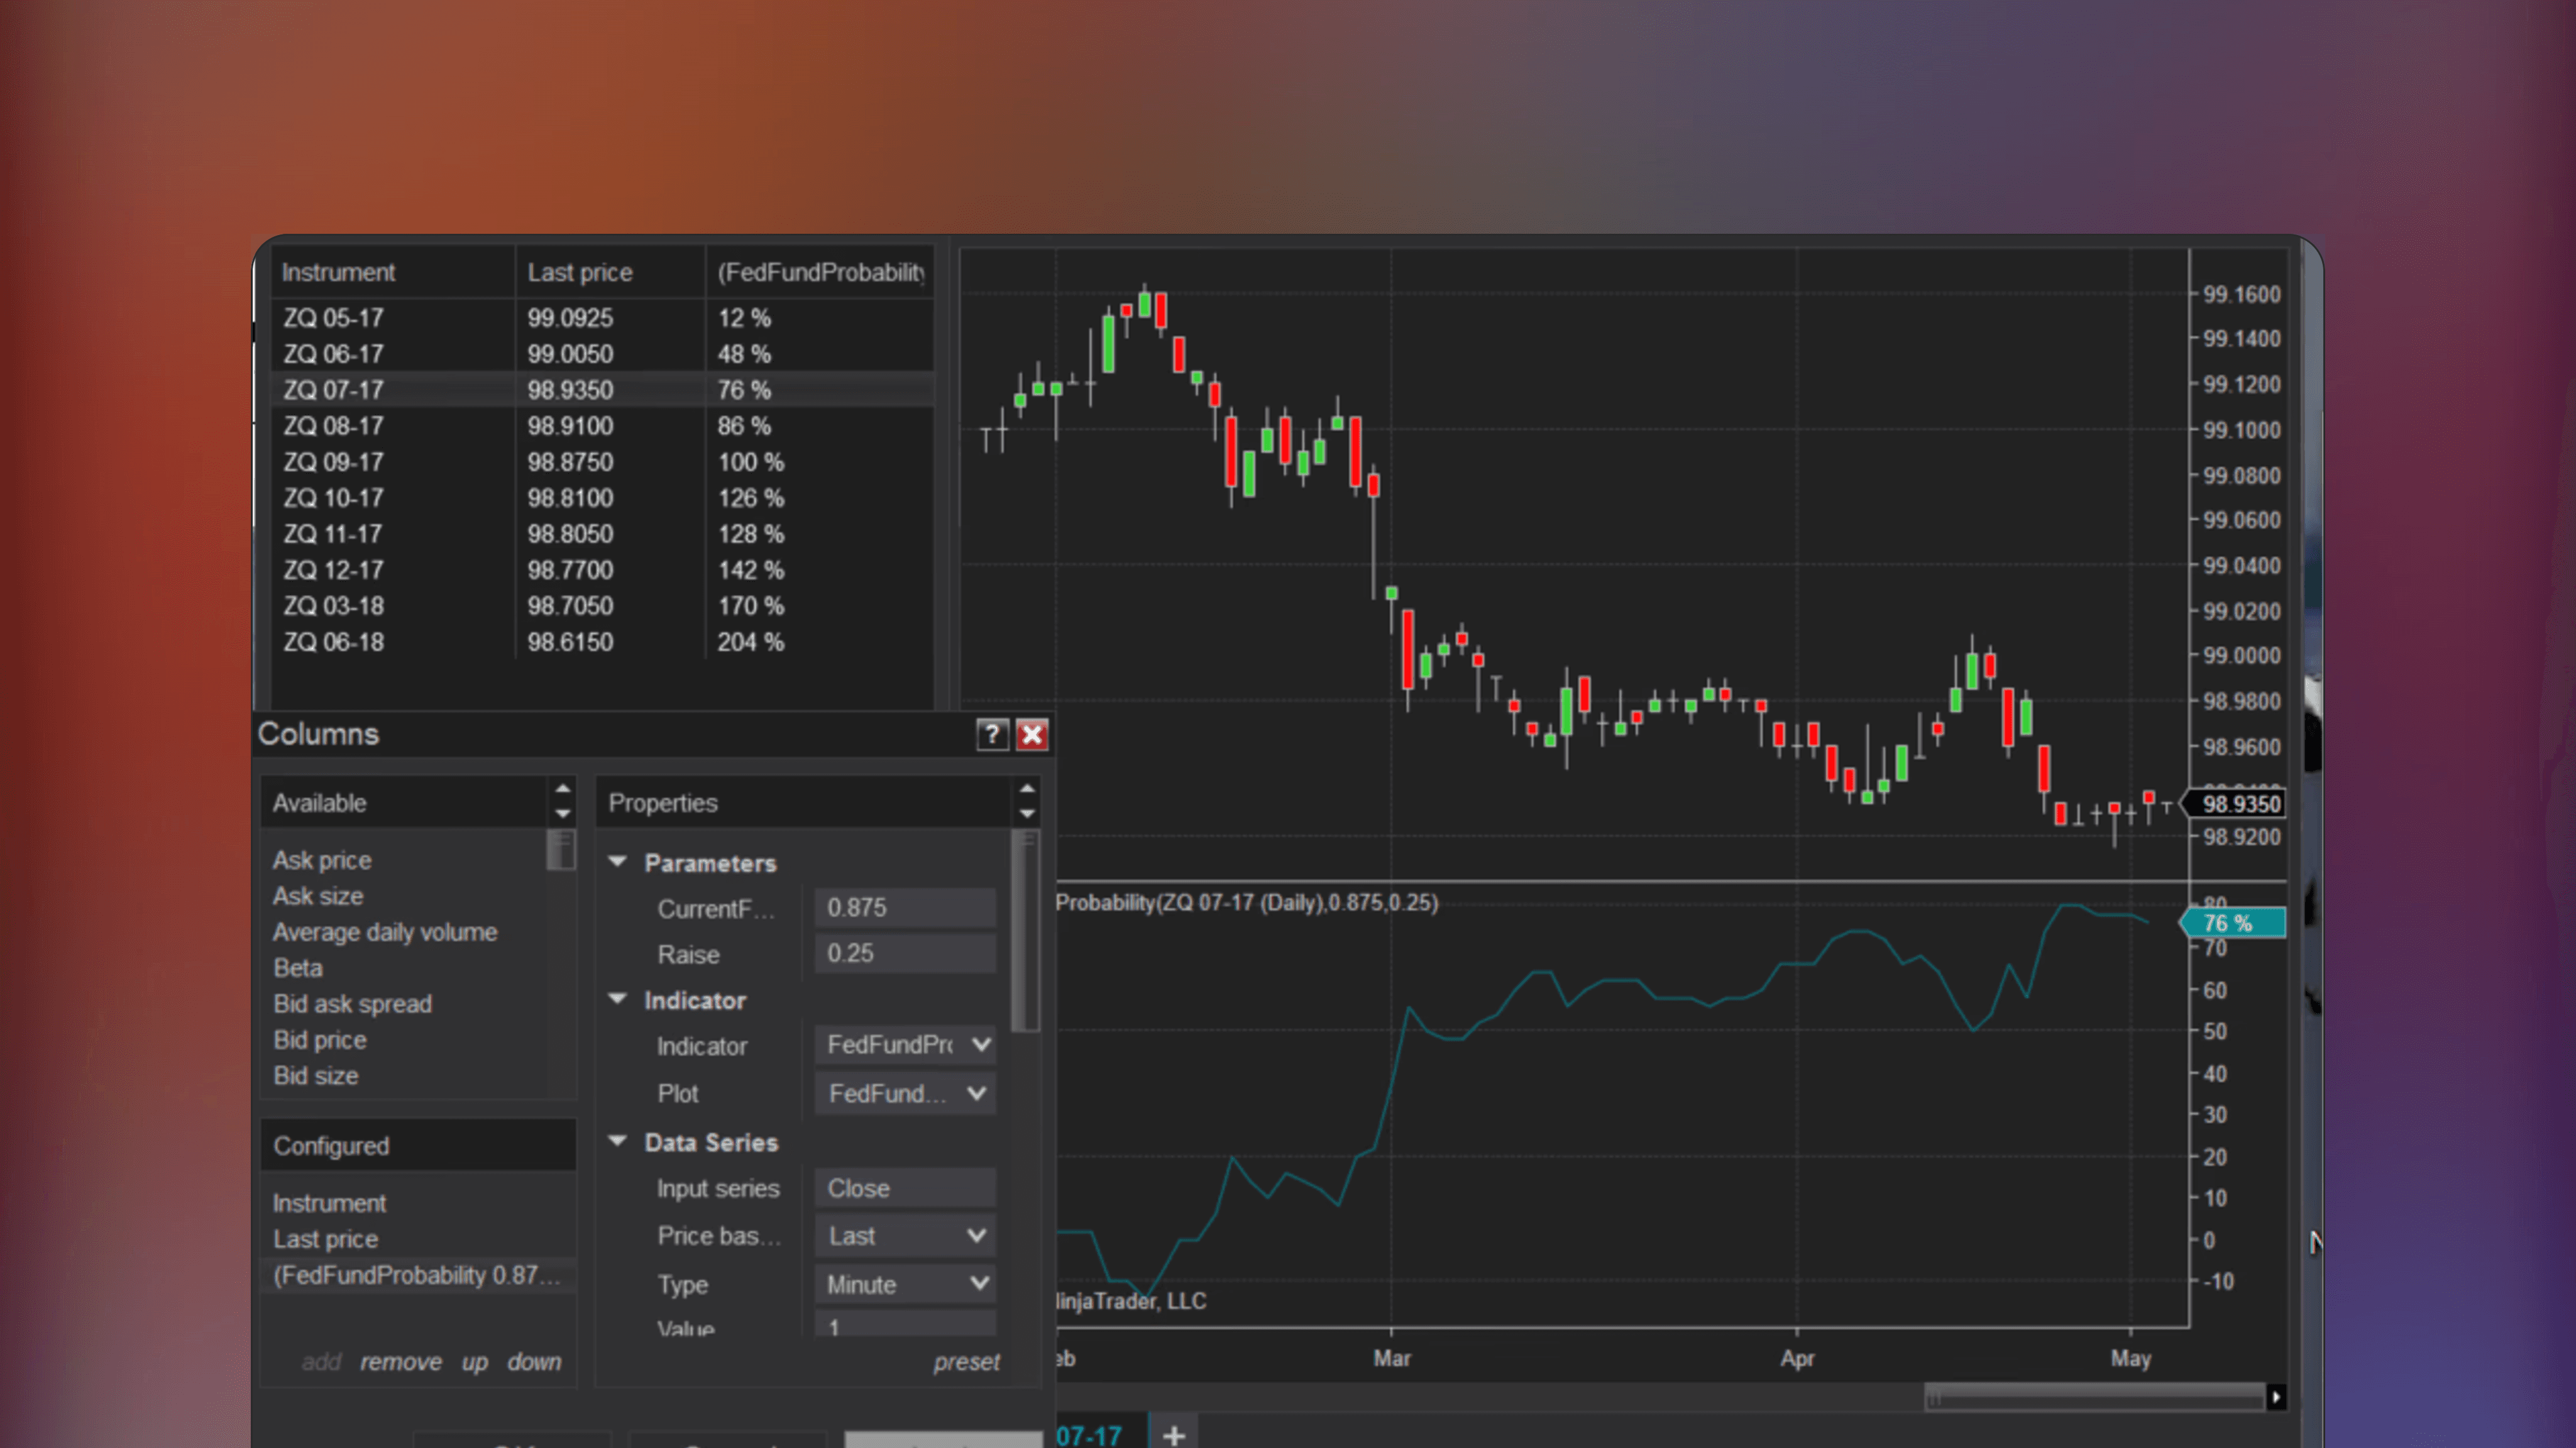
Quantify Rate Expectations
A 75% probability of a 25 basis point cut means the market strongly expects easing. These derived probabilities inform cross-asset trading decisions.
Integrate Macro Context with Charts
Rate expectations ripple across every asset class. Tracking probabilities alongside price charts adds macro-level context to technical decisions.
How are Fed fund probabilities calculated from futures prices?
The calculation uses Fed funds futures contracts pricing to back out implied rates for each FOMC meeting date. By comparing implied rates to current rates, the probability of various rate decisions can be derived. Changes in futures prices shift these probabilities in real time.
Why do rate probabilities sometimes change dramatically intraday?
Economic data releases, Fed speaker comments and market events shift expectations rapidly. A hot inflation print can instantly reprice rate hike odds higher. Futures markets react continuously to new information, causing probability swings throughout the session.
How should I trade around FOMC decisions using probability data?
When probabilities show high certainty of an outcome, the risk is the market already priced it in. Surprises move markets more than expected decisions. Watch for divergence between probabilities and Fed rhetoric. Position sizing should account for elevated event volatility.
⭐️
⭐️
⭐️
⭐️
⭐️


✍️
By Author
More by NinjaTrader_AlanP
🔥
New Listings
Featured this week


🤖
Similar Listings
Traders also viewed
All

🤖
by NinjaTrader_AlanP

Free
NinjaTrader Indicator
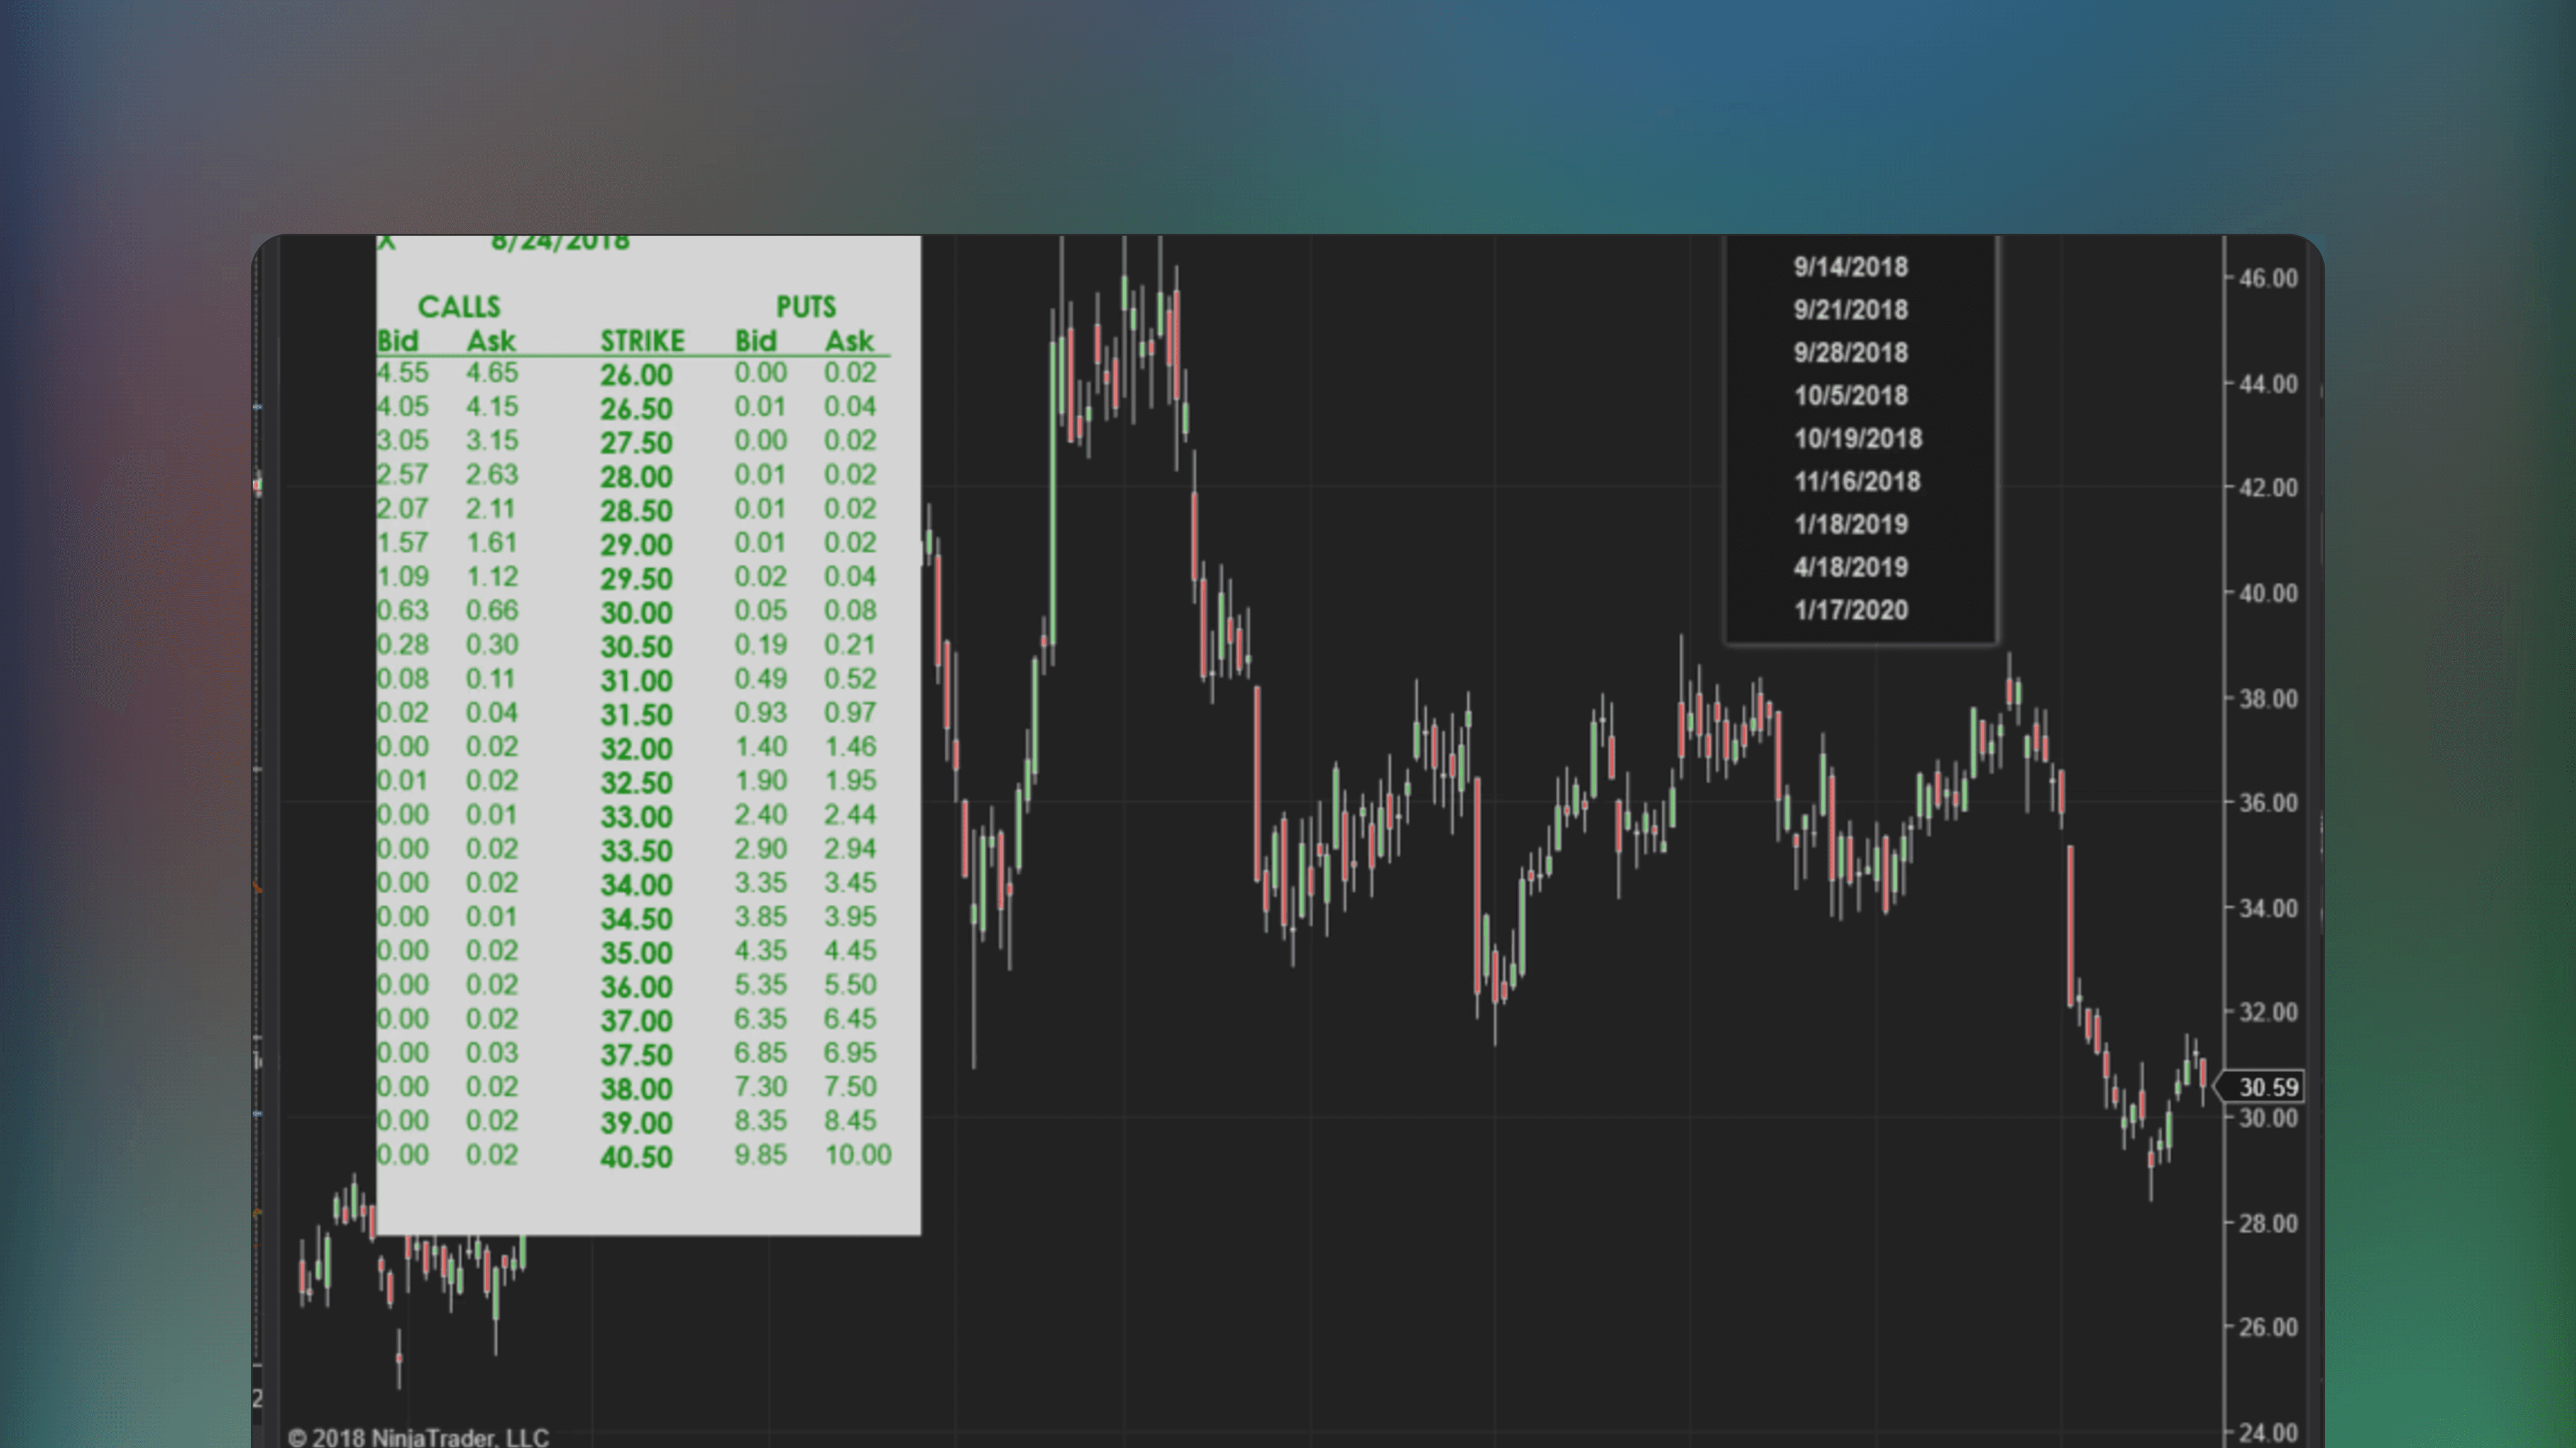
Options: Equity Options Chain Rendered on Chart Indicator
🔑
🌐
✅
🏅
Options: Equity Options Chain Rendered on Chart Indicator is a NinjaTrader indicator that integrates Yahoo’s options data on the chart directly. Pull up the options dashboard to aid your analysis whenever needed.

🤖
by NinjaTrader_Jim
Free
NinjaTrader Indicator
StockRatingSystem
🔑
🏅
StockRatingSystem is a NinjaTrader Indicator that ranks stocks using a mathematical formula based on Markos Katsanos' technical analysis methodology, as detailed in his June 2018 Stocks and Commodities article "A Technical Method for Rating Stocks".

🤖
by siroki
Free
NinjaTrader Indicator
Sessioncolors
🔑
🌐
✅
Sessioncolors is a NinjaTrader indicator that marks and customizes the start and end times of the Asia, London, and New York trading sessions on a price chart. Identify trading sessions using colored boxes with adjustable visuals for each.

🤖
by NinjaTrader_Jim
Free
NinjaTrader Indicator
Probability Distribution NT8
🔑
🏅
Probability Distribution NT8 is a NinjaTrader Indicator that calculates probability distributions for price data, based on statistical methods introduced by John F. Ehlers.

🤖
by NinjaTrader_AdamP
Free
NinjaTrader Indicator
Spread Indicator With Candlesticks
🔑
Spread Indicator With Candlesticks is a free NinjaTrader indicator that visualizes bid-ask spreads by plotting them as easy to read candlesticks on trading charts.
🤖
by NinjaTrader_Gaby
Free
NinjaTrader Indicator
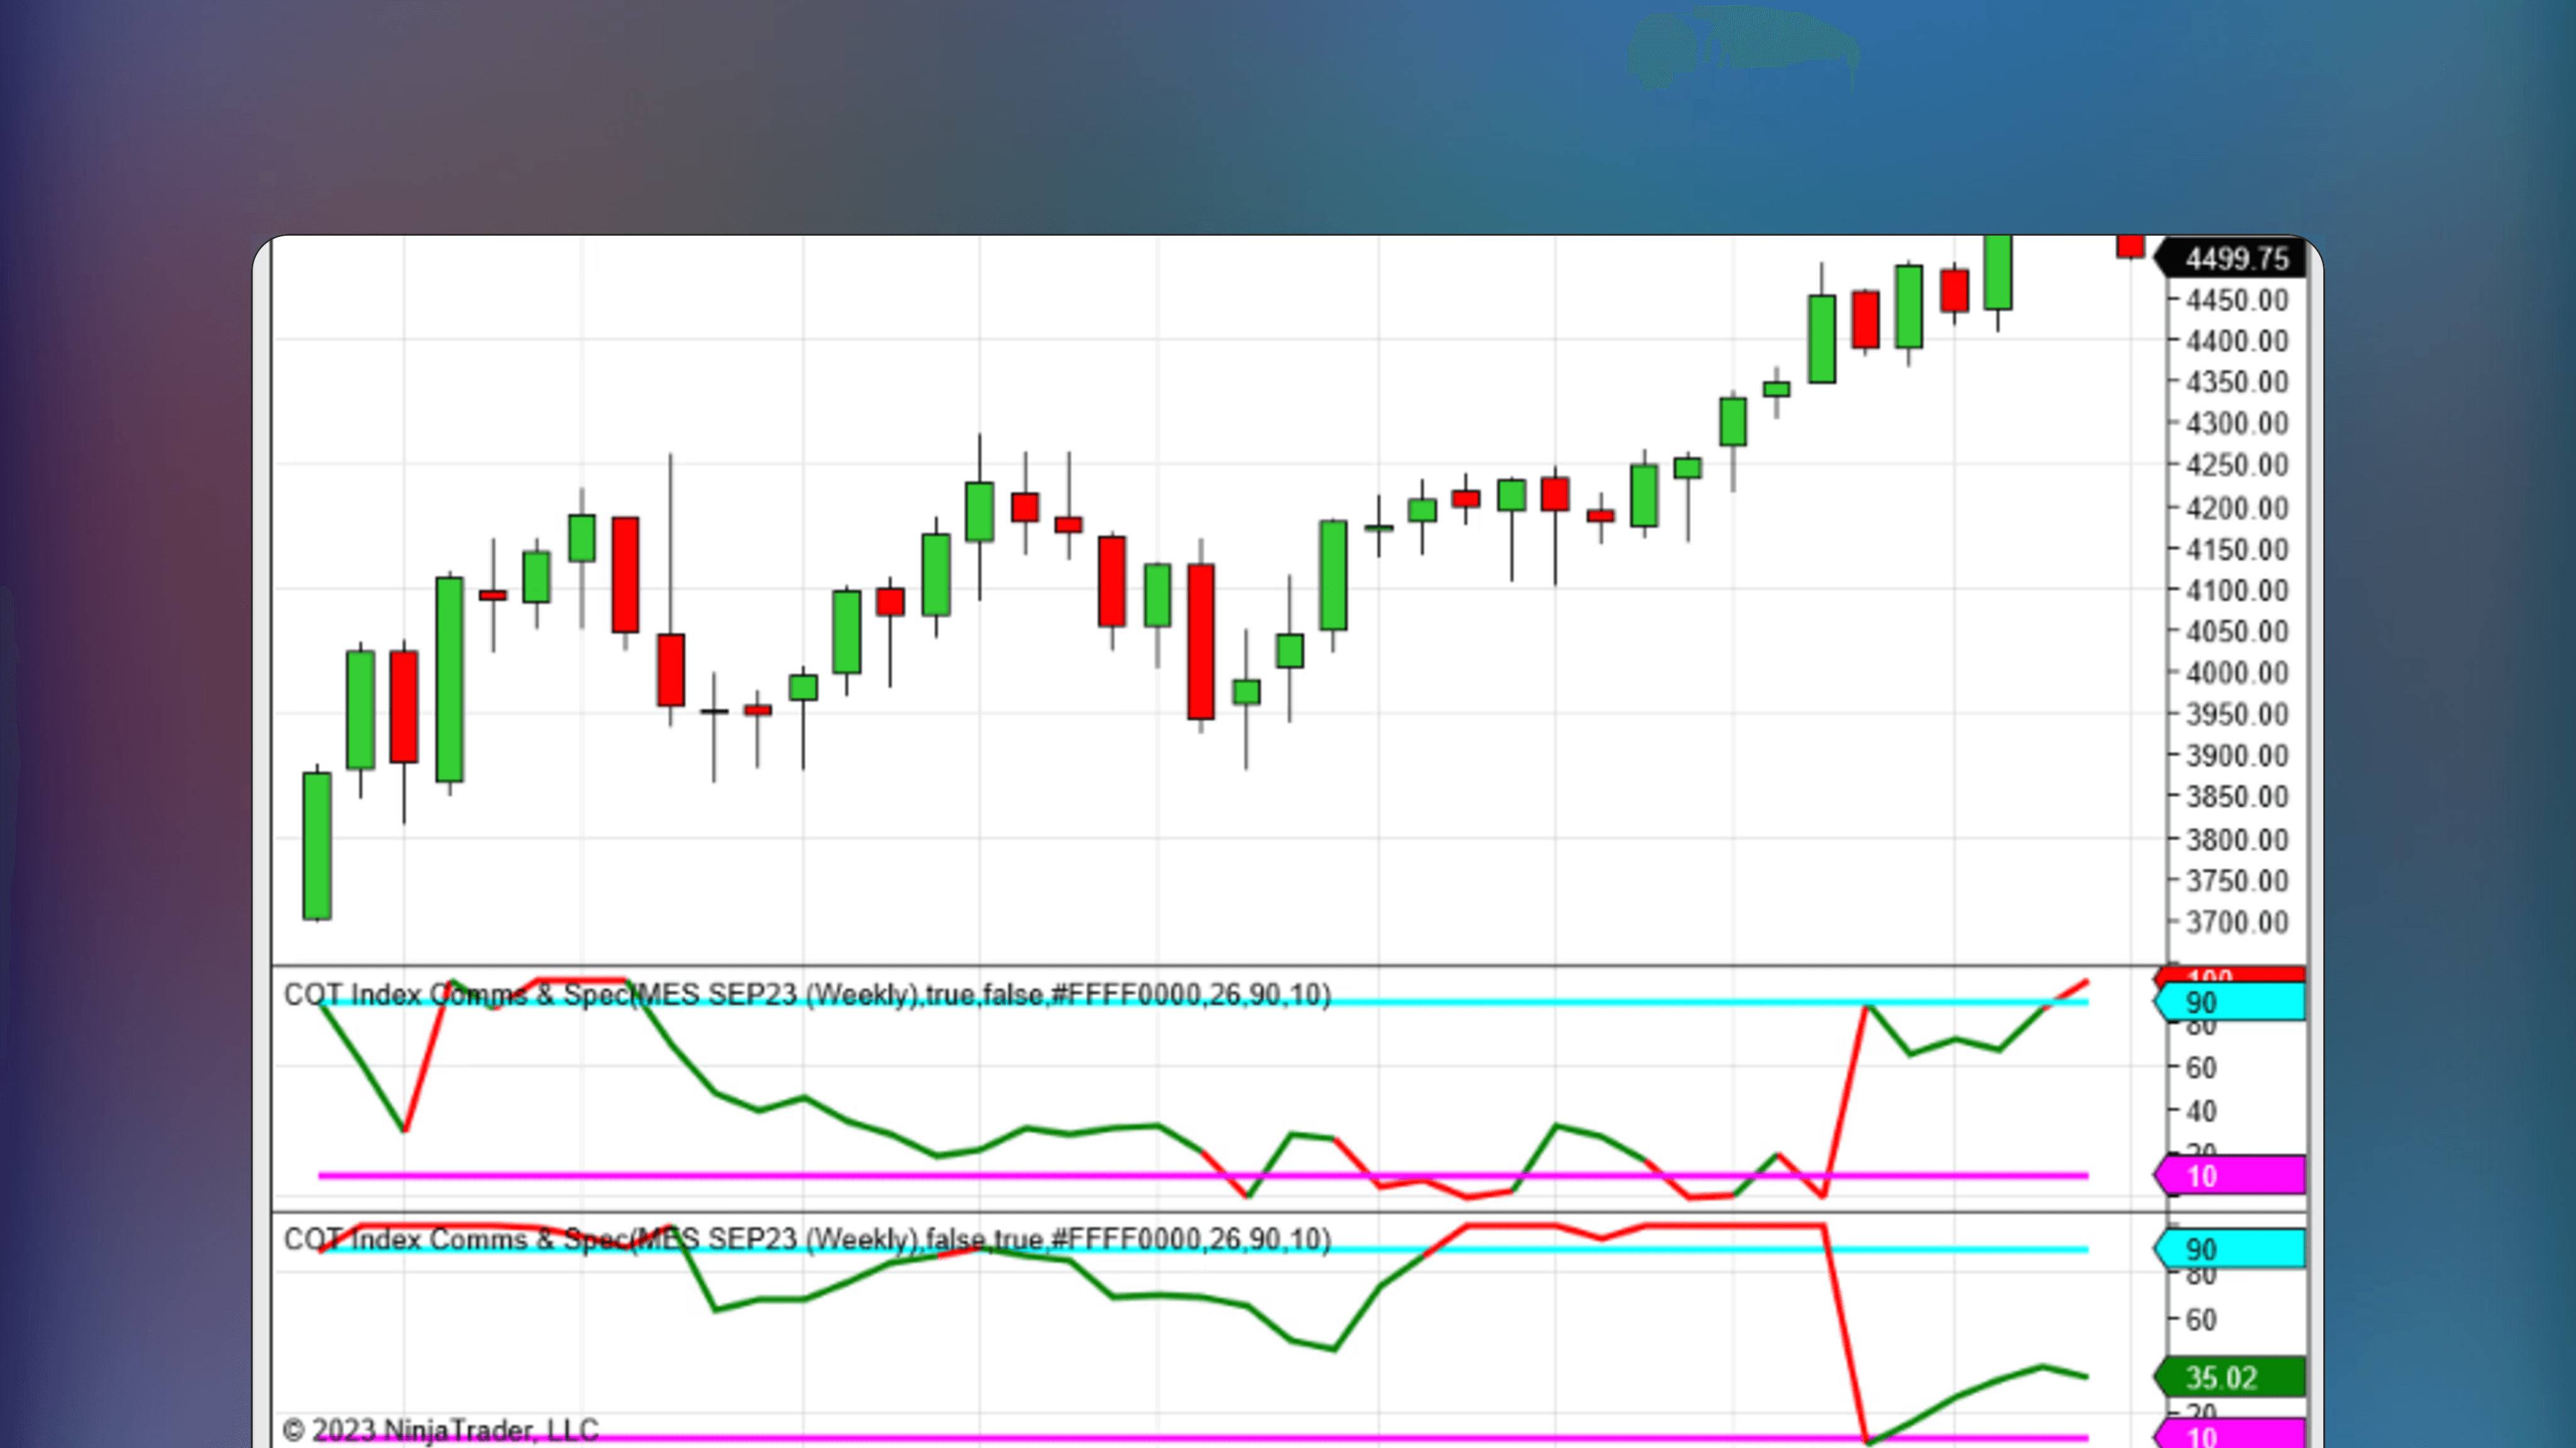
COT Index Comms & Spec NT8
🔑
🌐
✅
COT Index Comms & Spec NT8 is a NinjaTrader indicator that aggregates futures traders' positions using the COT index, providing data on positioning and sentiment.

🤖
by StevenL
Free
NinjaTrader Indicator
Futures Settlement Lines
🔑
🌐
Futures Settlement Lines is a NinjaTrader indicator that plots the last two futures contract settlement prices from the end of Regular Trading Hours, showing how current prices interact with these key closing levels.