


Spot Unusual Options Positioning
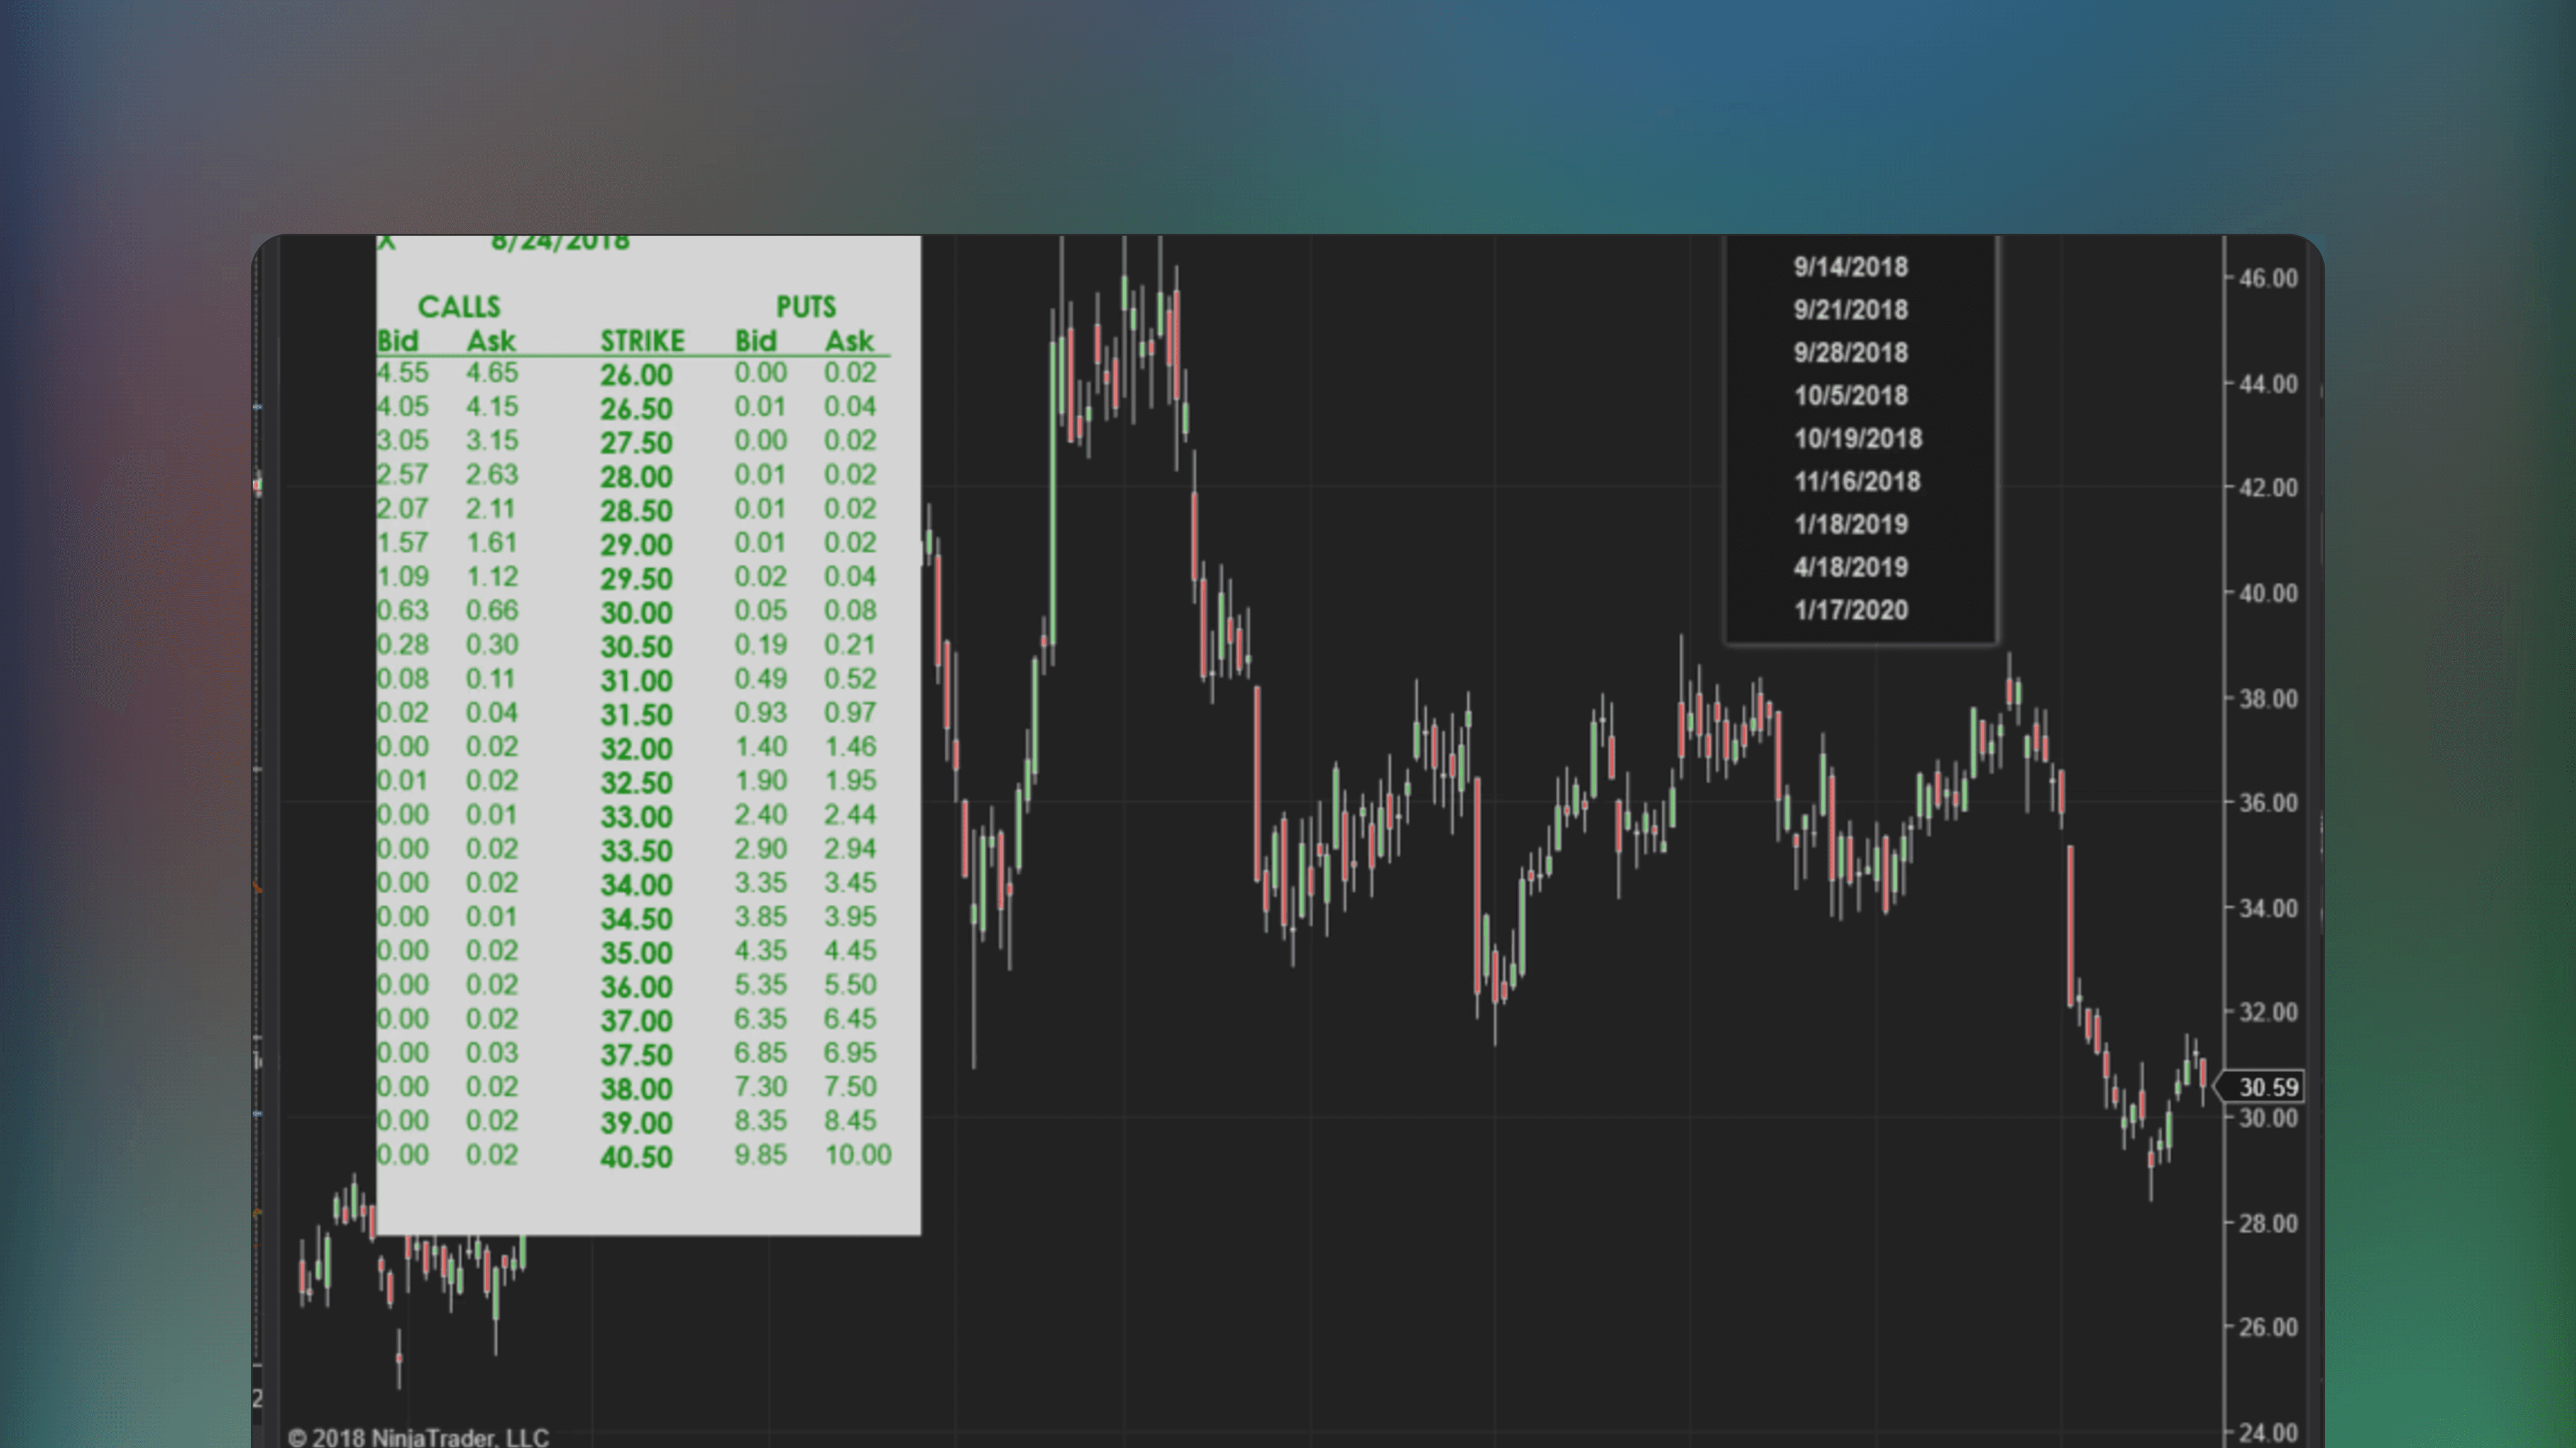
The dashboard shows call and put activity at various strikes. Heavy open interest at specific levels often acts as a magnet or barrier for price.
Reference Options Data Without Switching
Pull up the options dashboard whenever needed to see key chain data for the current underlying. No separate windows or tabs required.
Read Where Smart Money is Positioned
A breakout backed by heavy call volume and rising open interest is more convincing than one with declining options interest behind it.
How current is the options data displayed on the chart?
The indicator pulls data from Yahoo Finance, which provides delayed quotes. The data is suitable for identifying structural levels like high open interest strikes but may lag real-time conditions. Verify with your broker for live positioning.
Why do high open interest strikes often act as magnets for price?
Market makers hedge their options exposure by trading the underlying stock. Large call open interest at a strike means dealers may buy shares as price approaches, creating support. Put open interest creates selling pressure. This hedging activity influences price.
Can I use this for intraday trading or only swing trades?
Options positioning influences both timeframes. High OI strikes create intraday support and resistance while also affecting where price gravitates into expiration. The data is useful for both intraday targets and swing trade planning.
⭐️
⭐️
⭐️
⭐️
⭐️


✍️
By Author
More by NinjaTrader_AlanP
🔥
New Listings
Featured this week


🤖
Similar Listings
Traders also viewed
All

🤖
by NinjaTrader_AlanP

Free
NinjaTrader Indicator
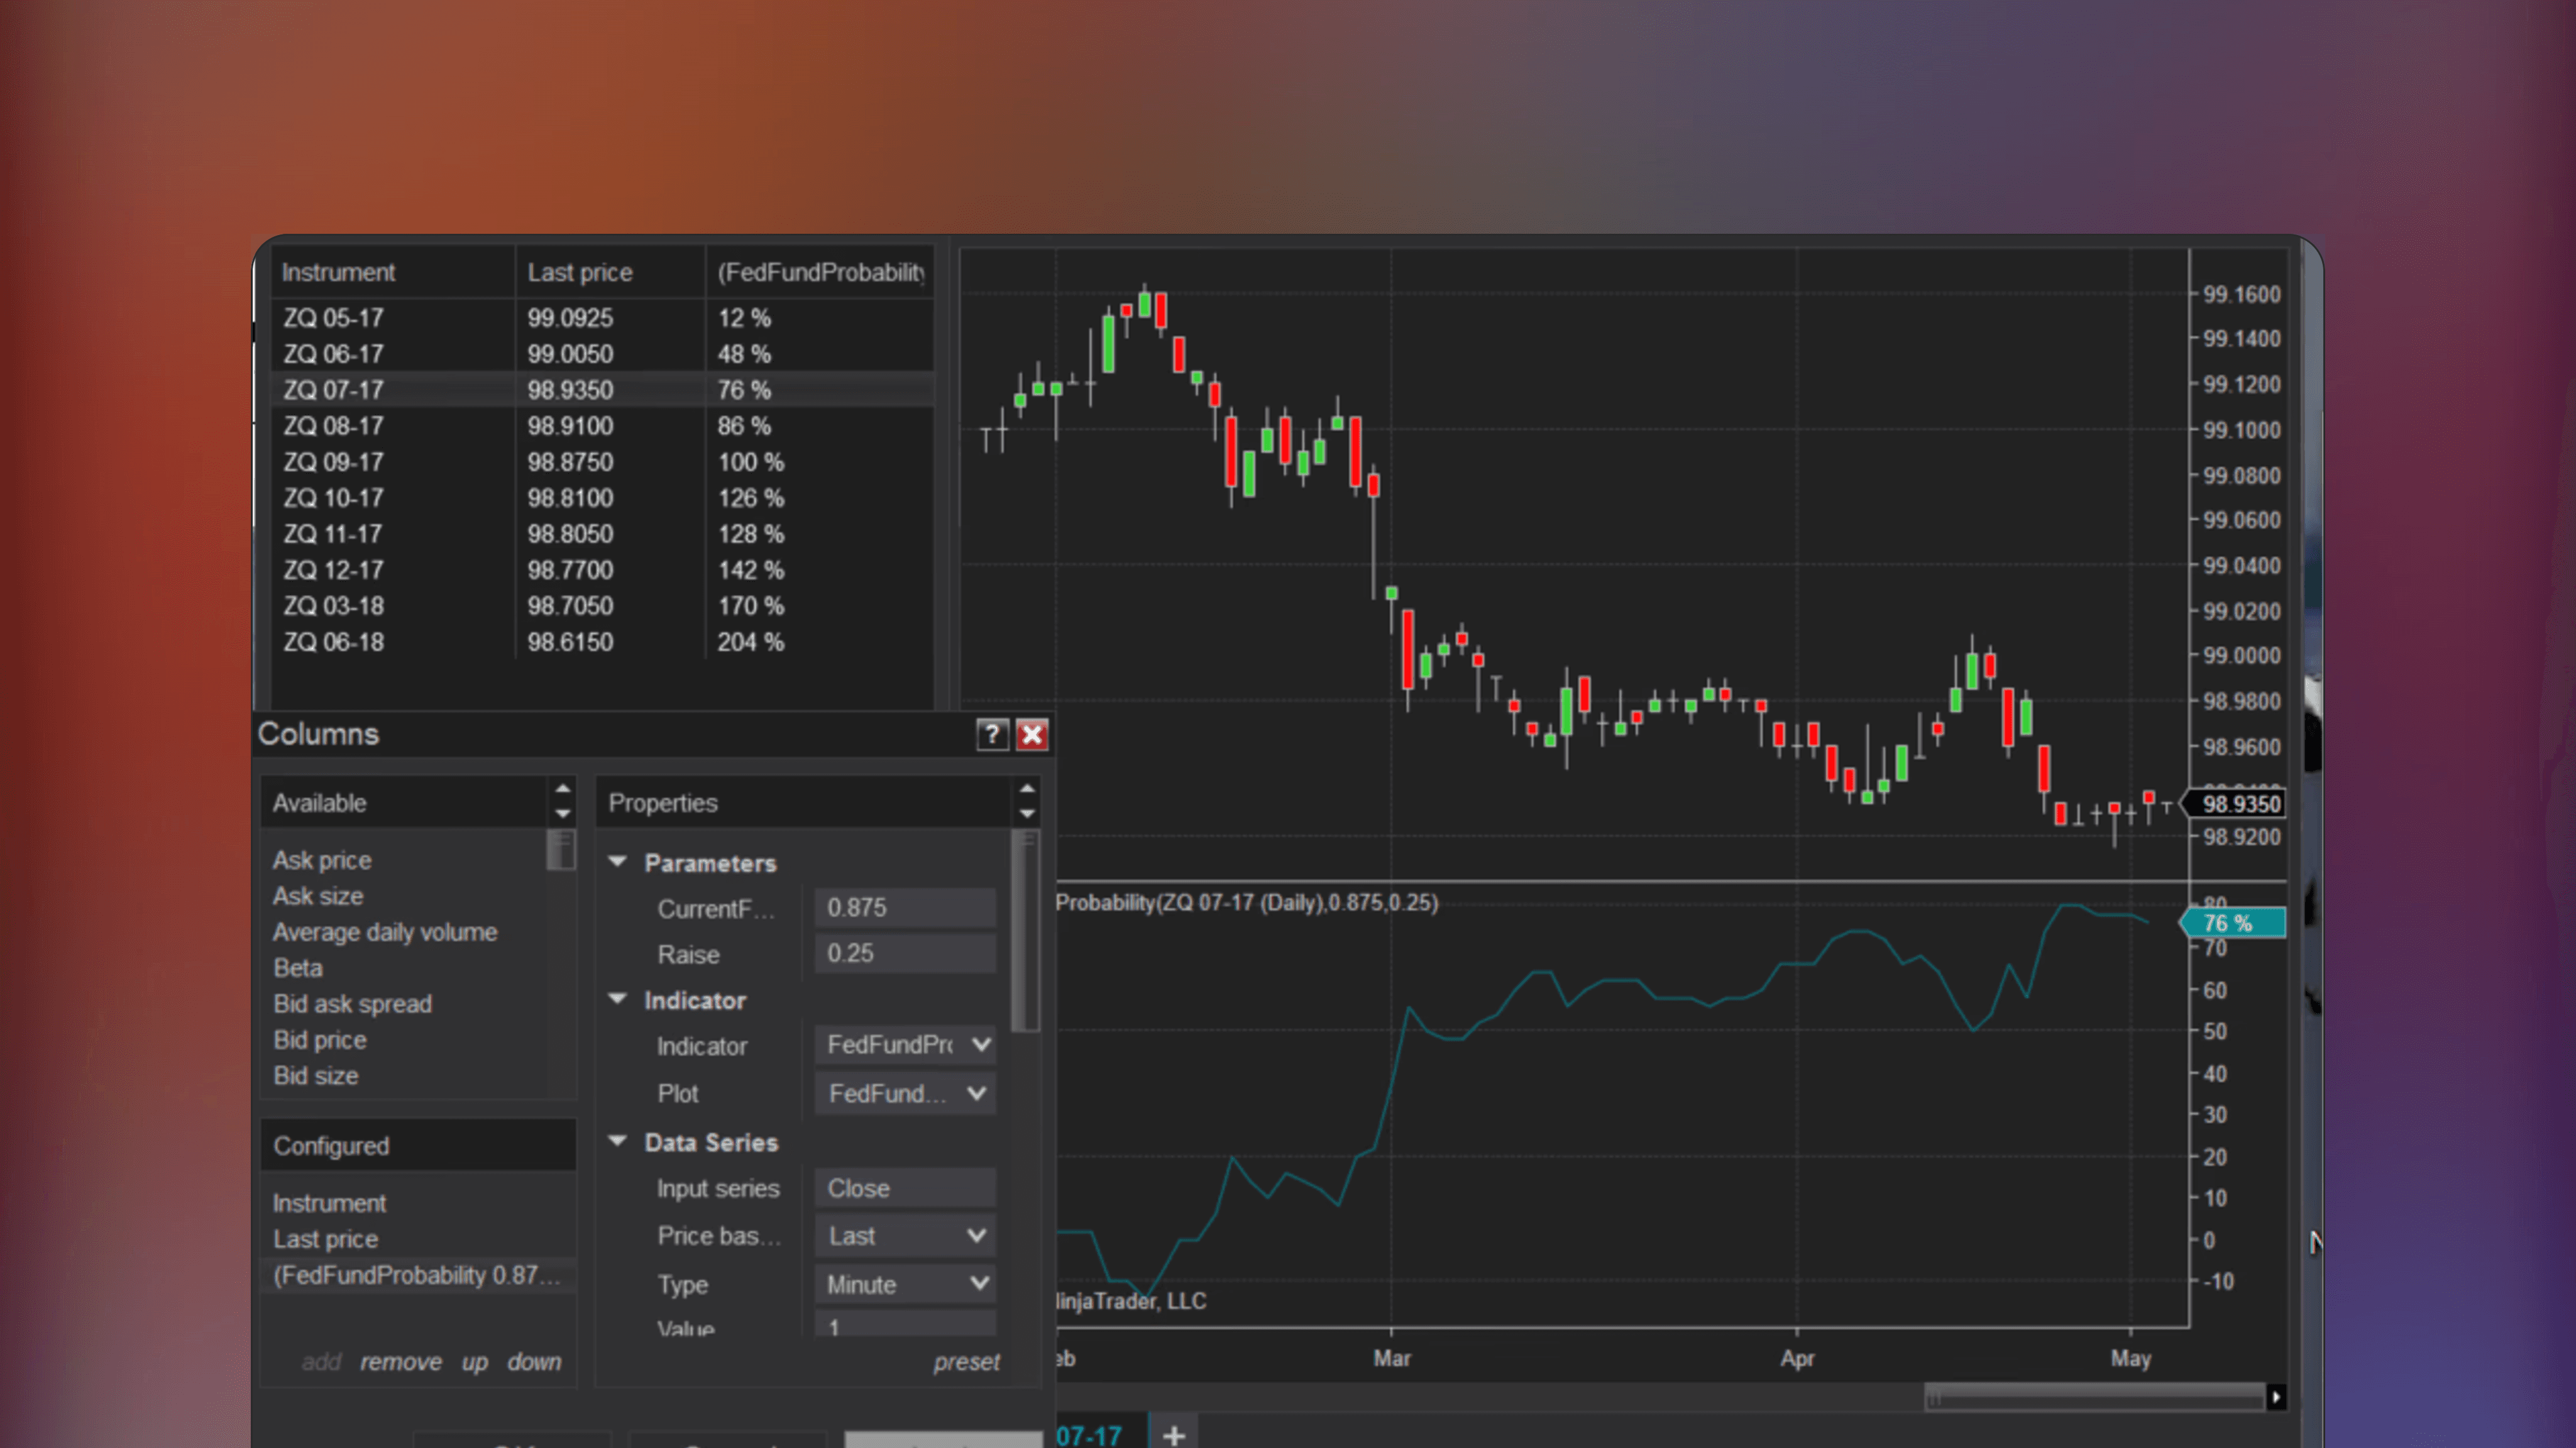
Fedfundprobability Indicator
🔑
🌐
✅
🏅
The Fedfundprobability Indicator is a NinjaTrader indicator that estimates the probability of specific FED interest rate hikes or cuts using FED futures contracts.

🤖
by NinjaTrader_Jim
Free
NinjaTrader Indicator
StockRatingSystem
🔑
🏅
StockRatingSystem is a NinjaTrader Indicator that ranks stocks using a mathematical formula based on Markos Katsanos' technical analysis methodology, as detailed in his June 2018 Stocks and Commodities article "A Technical Method for Rating Stocks".

🤖
by siroki
Free
NinjaTrader Indicator
Sessioncolors
🔑
🌐
✅
Sessioncolors is a NinjaTrader indicator that marks and customizes the start and end times of the Asia, London, and New York trading sessions on a price chart. Identify trading sessions using colored boxes with adjustable visuals for each.

🤖
by NinjaTrader_Jim
Free
NinjaTrader Indicator
Probability Distribution NT8
🔑
🏅
Probability Distribution NT8 is a NinjaTrader Indicator that calculates probability distributions for price data, based on statistical methods introduced by John F. Ehlers.

🤖
by NinjaTrader_AdamP
Free
NinjaTrader Indicator
Spread Indicator With Candlesticks
🔑
Spread Indicator With Candlesticks is a free NinjaTrader indicator that visualizes bid-ask spreads by plotting them as easy to read candlesticks on trading charts.
🤖
by NinjaTrader_Gaby
Free
NinjaTrader Indicator
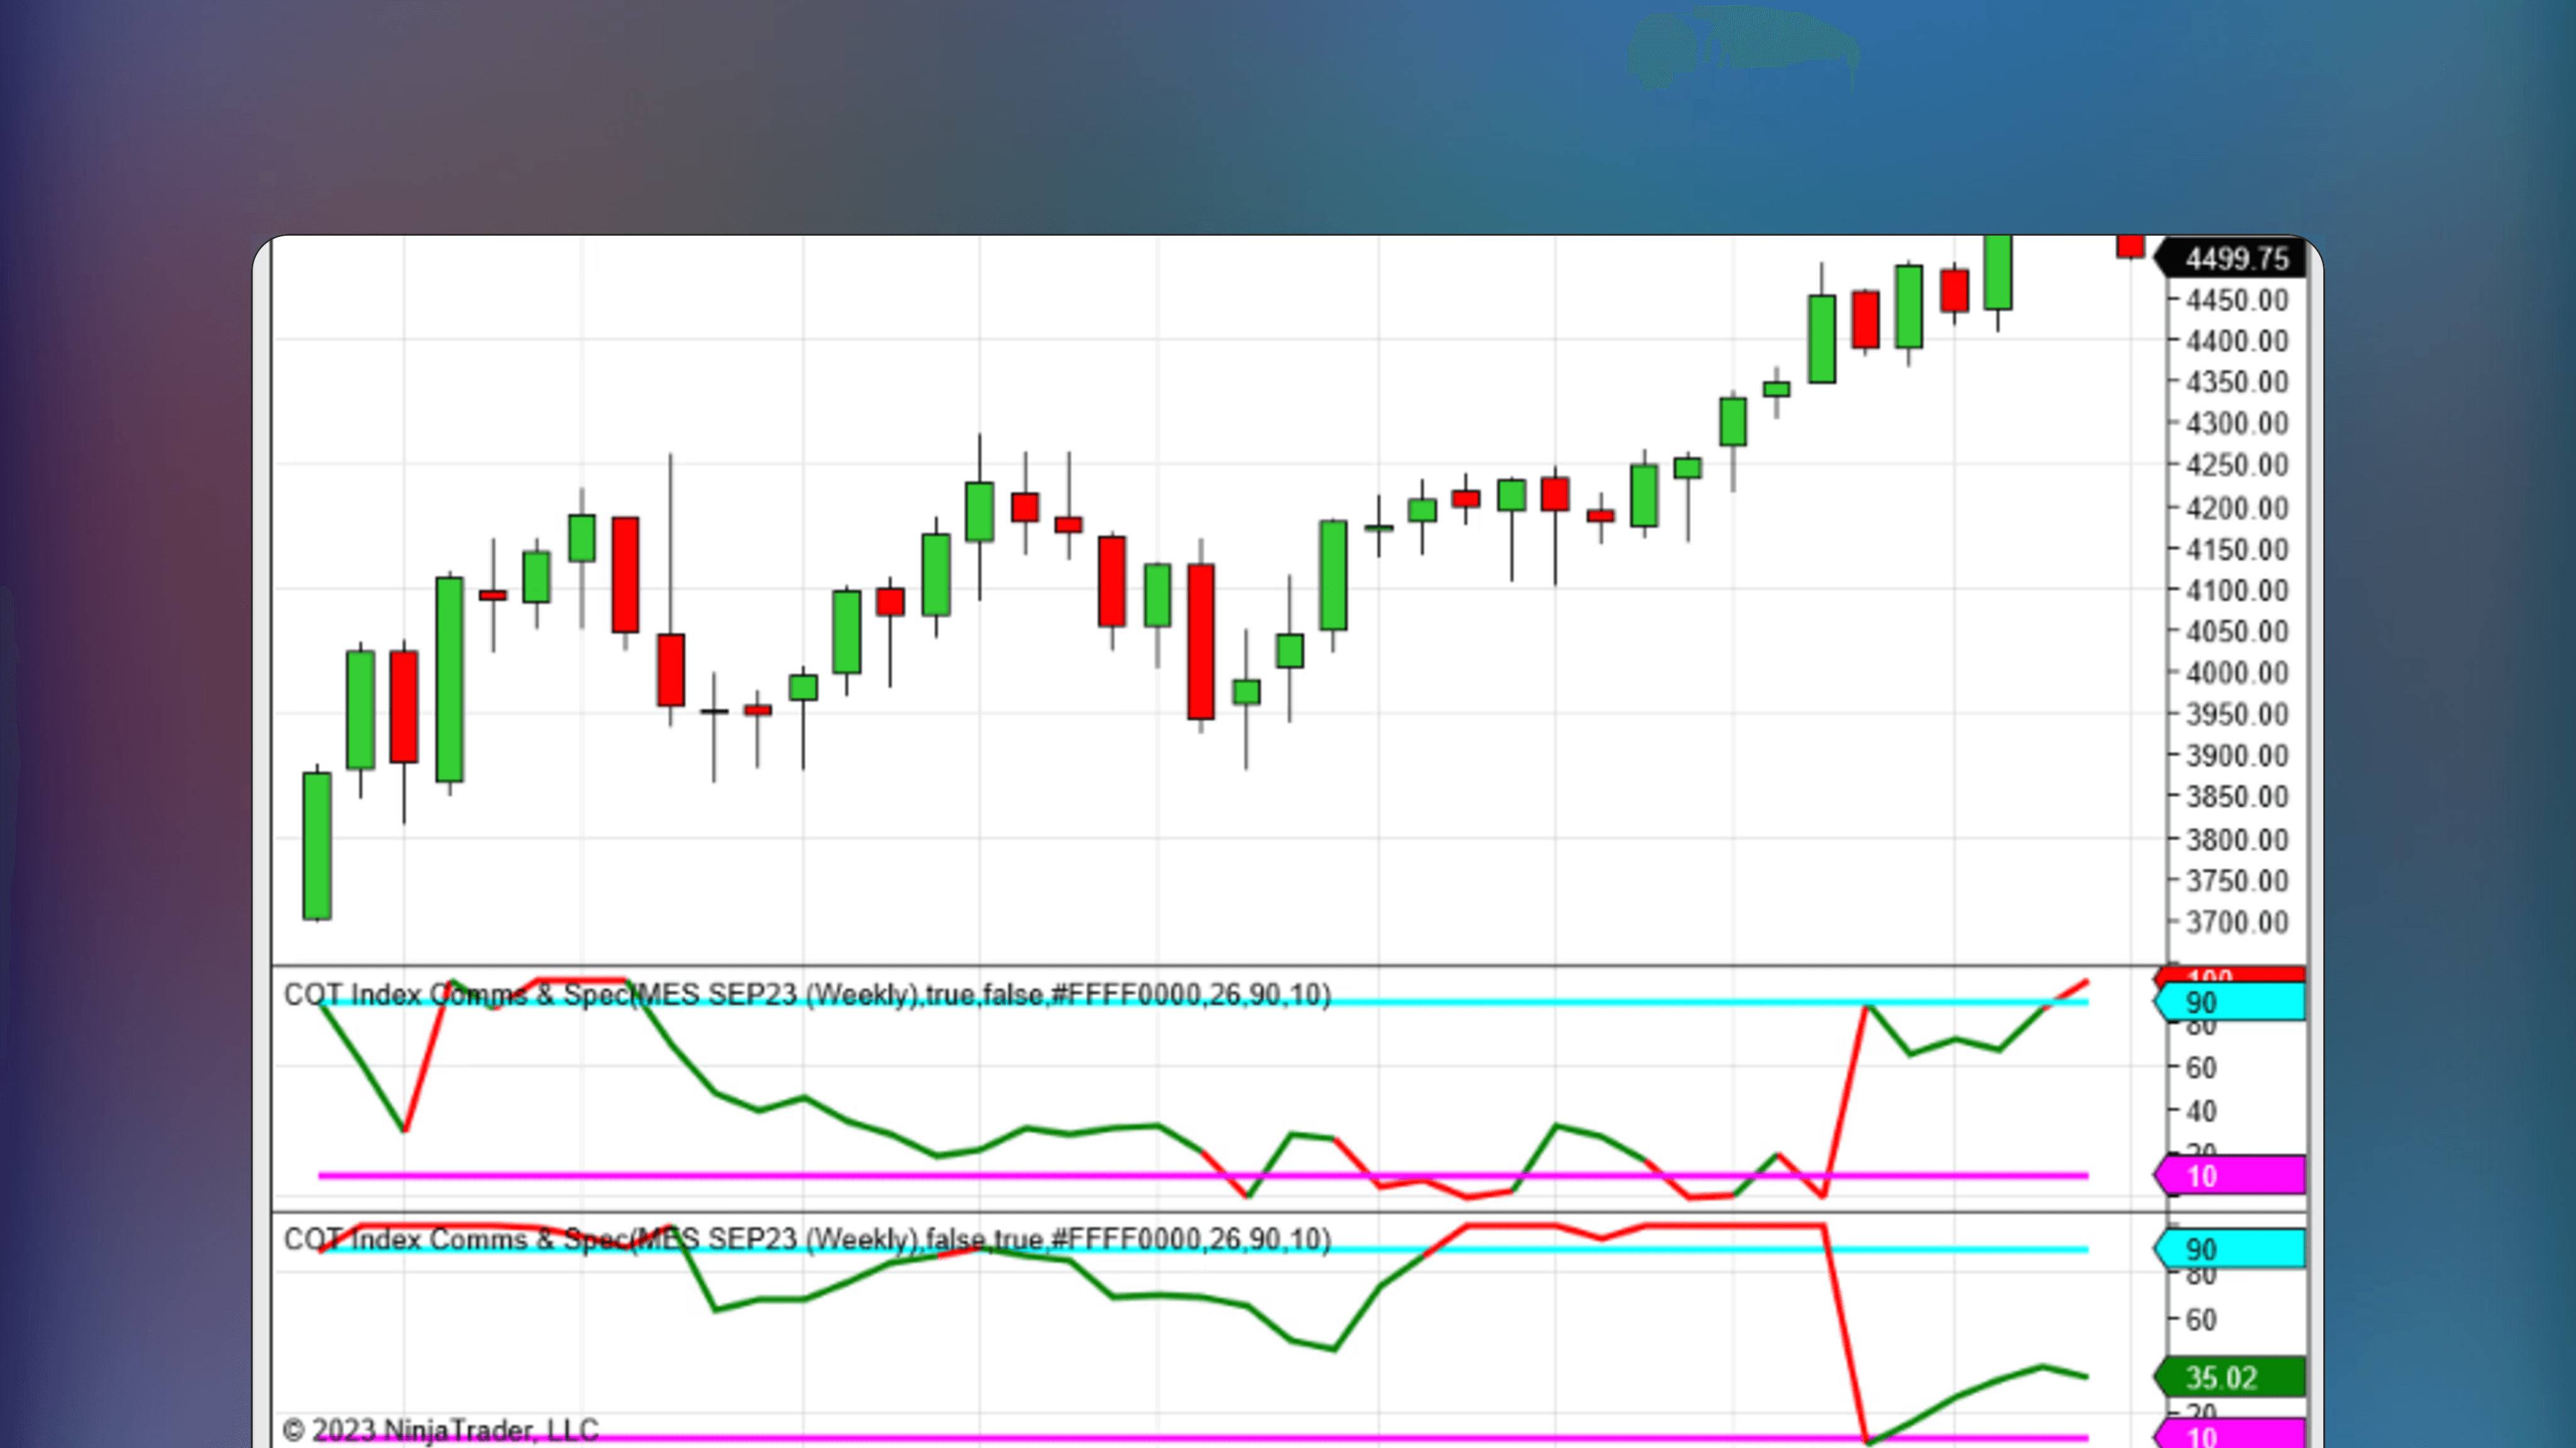
COT Index Comms & Spec NT8
🔑
🌐
✅
COT Index Comms & Spec NT8 is a NinjaTrader indicator that aggregates futures traders' positions using the COT index, providing data on positioning and sentiment.

🤖
by StevenL
Free
NinjaTrader Indicator
Futures Settlement Lines
🔑
🌐
Futures Settlement Lines is a NinjaTrader indicator that plots the last two futures contract settlement prices from the end of Regular Trading Hours, showing how current prices interact with these key closing levels.