


Track Institutional Reference Levels
Settlement prices mark where open positions are valued at session end. When price revisits these levels, order flow from institutional participants often creates tradeable reactions.
Gauge Sentiment Relative to Settlements
Price above both settlements signals bullish sentiment over two sessions. Between settlements indicates range-bound conditions while below both signals bearish structure.
Use Settlements as Trade Targets
Day traders use settlement lines as targets and reversal zones. A pullback to yesterday's settlement with buying pressure can mark a defined entry point.
Why do settlement prices matter for trading?
Settlement prices determine margin requirements and profit-loss calculations for institutional accounts. Large players often defend or target these levels. The settlement becomes a reference point that many participants watch, creating self-fulfilling support and resistance.
How do I trade when price approaches prior settlement levels?
Watch for reactions at prior settlement levels during regular trading. Price often pauses, reverses or accelerates through these levels. Look for confirmation patterns rather than blindly trading at settlement. Multiple settlements creating a zone increases significance.
Do settlement levels matter for all futures contracts equally?
Settlement levels matter most for heavily traded contracts with significant open interest. Major index futures and commodities show stronger settlement reactions than thinly traded contracts. Higher volume contracts have more participants watching these levels.
⭐️
⭐️
⭐️
⭐️
⭐️


🔥
New Listings
Featured this week


🤖
Similar Listings
Traders also viewed
All

🤖
by NinjaTrader_AlanP

Free
NinjaTrader Indicator
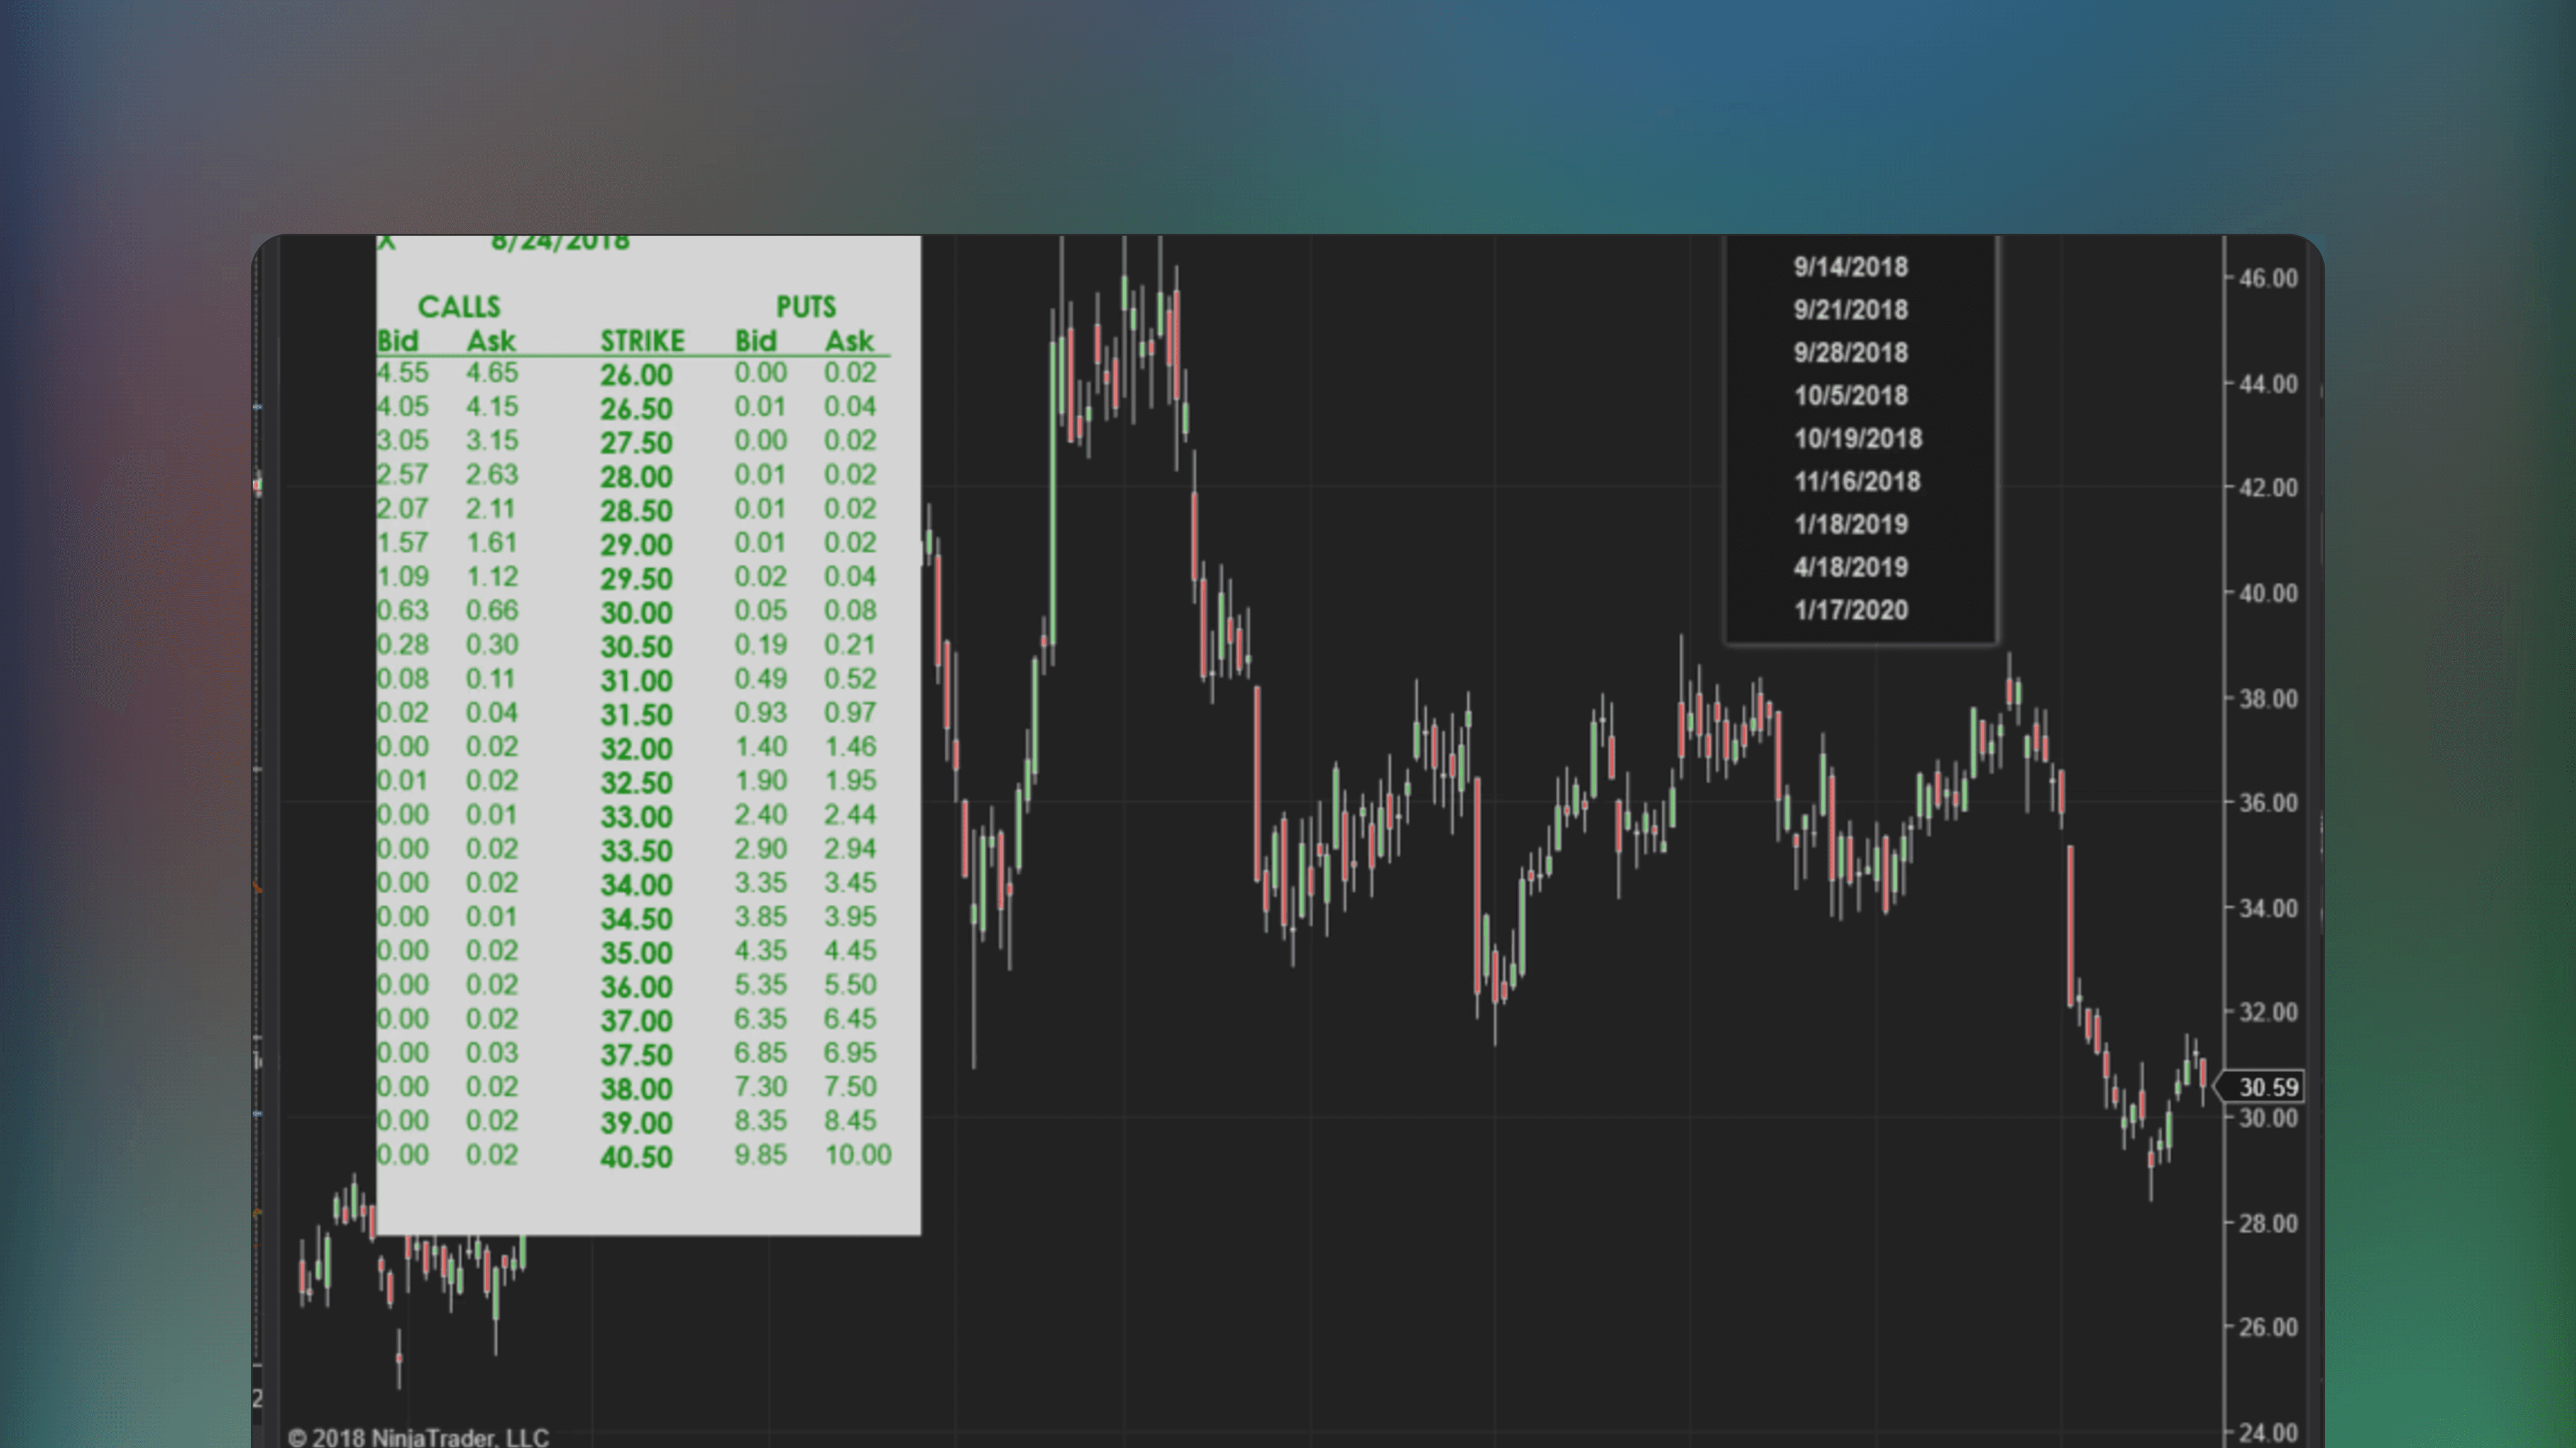
Options: Equity Options Chain Rendered on Chart Indicator
🔑
🌐
✅
🏅
Options: Equity Options Chain Rendered on Chart Indicator is a NinjaTrader indicator that integrates Yahoo’s options data on the chart directly. Pull up the options dashboard to aid your analysis whenever needed.
🤖
by NinjaTrader_AlanP
Free
NinjaTrader Indicator
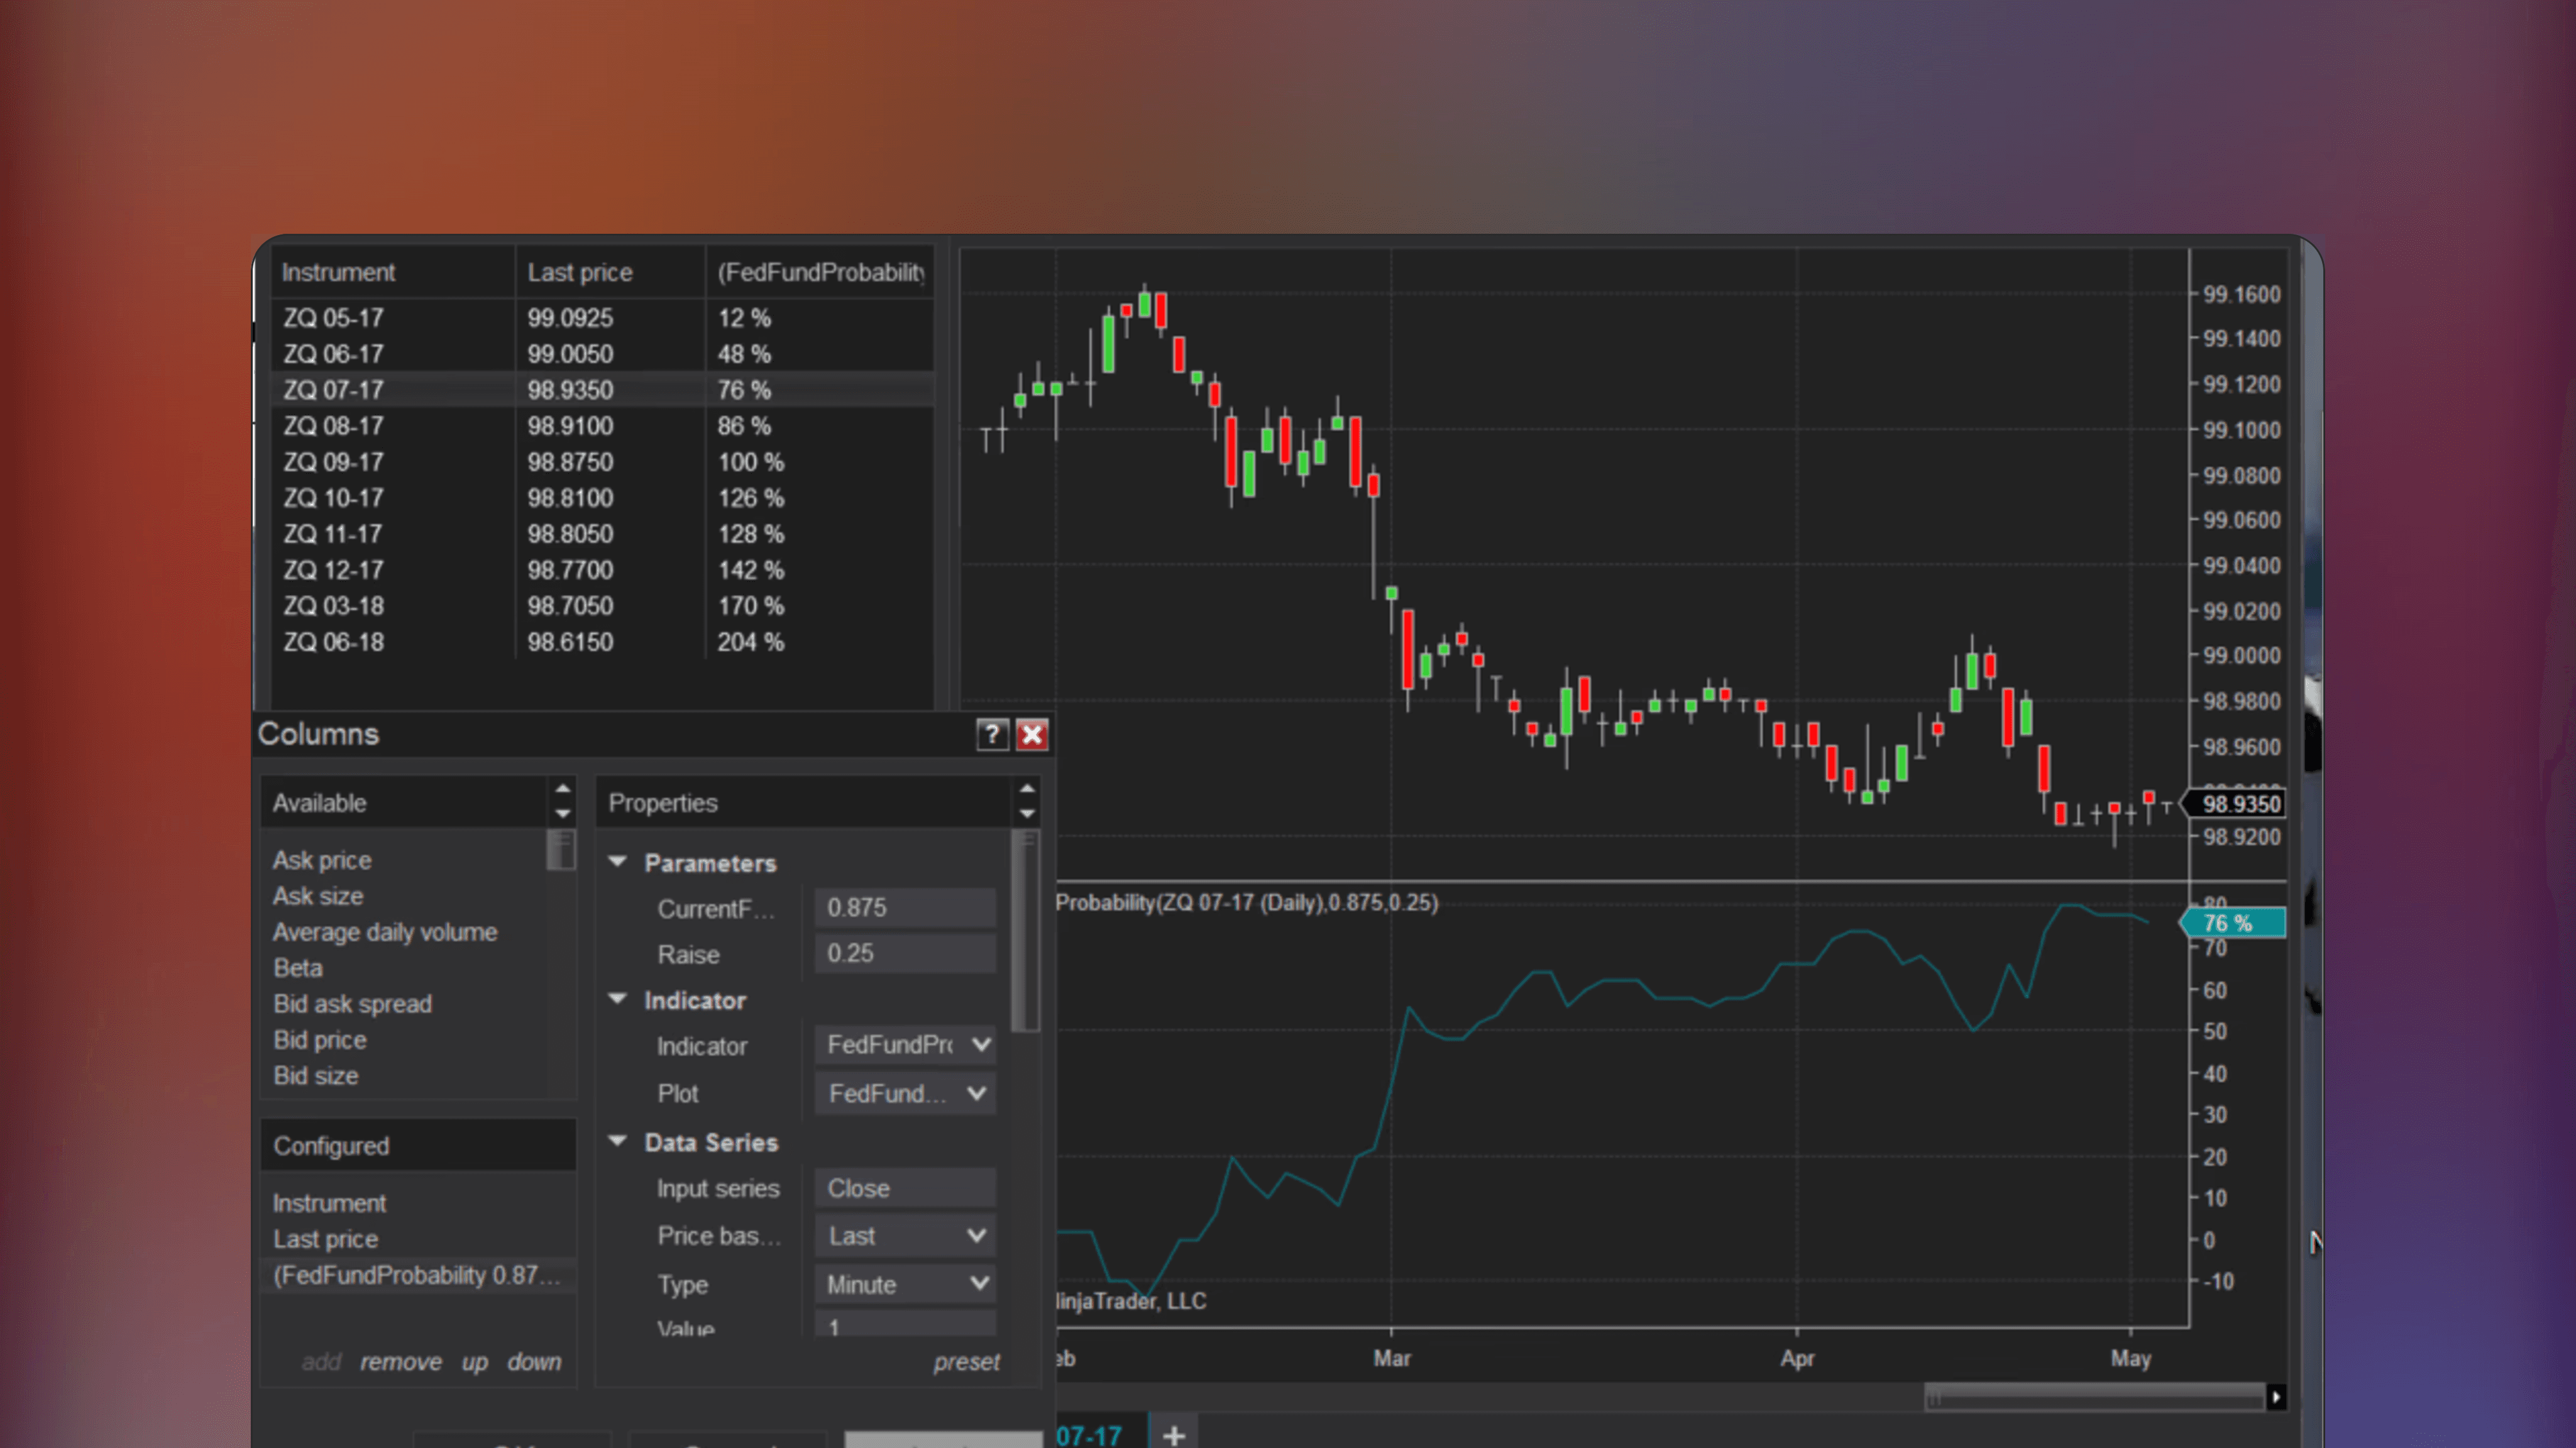
Fedfundprobability Indicator
🔑
🌐
✅
🏅
The Fedfundprobability Indicator is a NinjaTrader indicator that estimates the probability of specific FED interest rate hikes or cuts using FED futures contracts.

🤖
by NinjaTrader_Jim
Free
NinjaTrader Indicator
StockRatingSystem
🔑
🏅
StockRatingSystem is a NinjaTrader Indicator that ranks stocks using a mathematical formula based on Markos Katsanos' technical analysis methodology, as detailed in his June 2018 Stocks and Commodities article "A Technical Method for Rating Stocks".

🤖
by siroki
Free
NinjaTrader Indicator
Sessioncolors
🔑
🌐
✅
Sessioncolors is a NinjaTrader indicator that marks and customizes the start and end times of the Asia, London, and New York trading sessions on a price chart. Identify trading sessions using colored boxes with adjustable visuals for each.

🤖
by NinjaTrader_Jim
Free
NinjaTrader Indicator
Probability Distribution NT8
🔑
🏅
Probability Distribution NT8 is a NinjaTrader Indicator that calculates probability distributions for price data, based on statistical methods introduced by John F. Ehlers.

🤖
by NinjaTrader_AdamP
Free
NinjaTrader Indicator
Spread Indicator With Candlesticks
🔑
Spread Indicator With Candlesticks is a free NinjaTrader indicator that visualizes bid-ask spreads by plotting them as easy to read candlesticks on trading charts.
🤖
by NinjaTrader_Gaby
Free
NinjaTrader Indicator
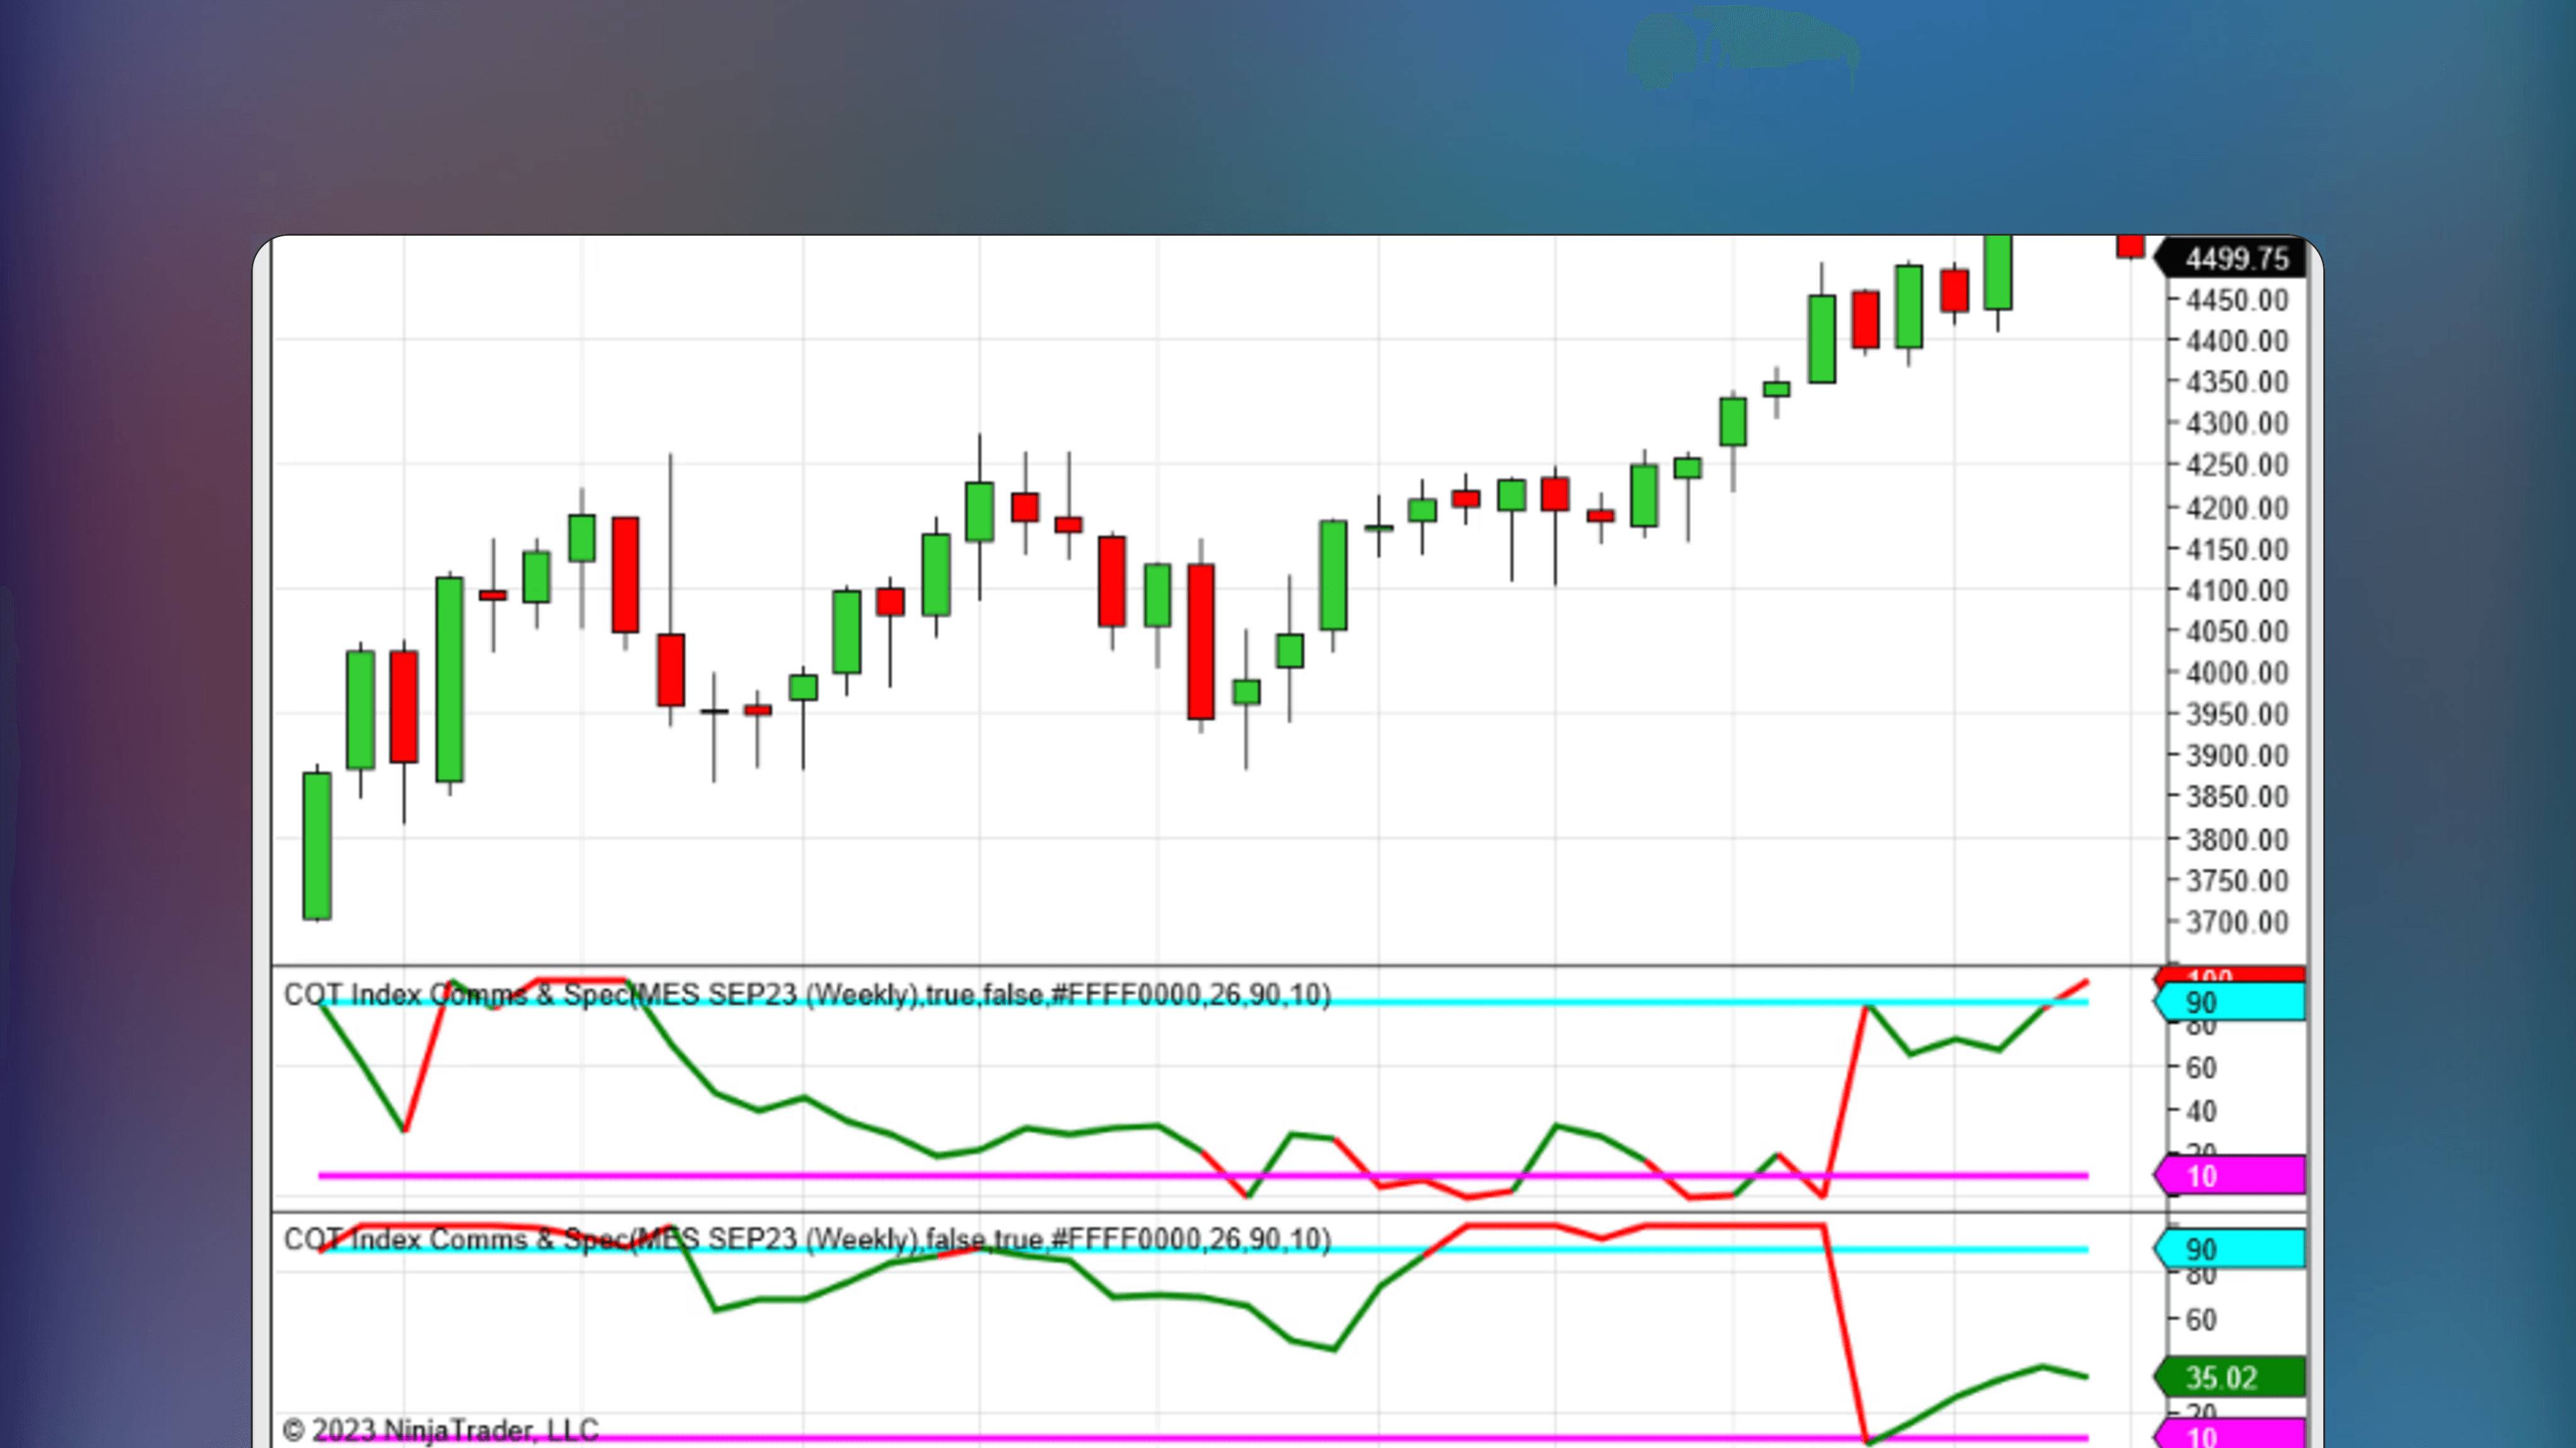
COT Index Comms & Spec NT8
🔑
🌐
✅
COT Index Comms & Spec NT8 is a NinjaTrader indicator that aggregates futures traders' positions using the COT index, providing data on positioning and sentiment.