


Track institutional positioning
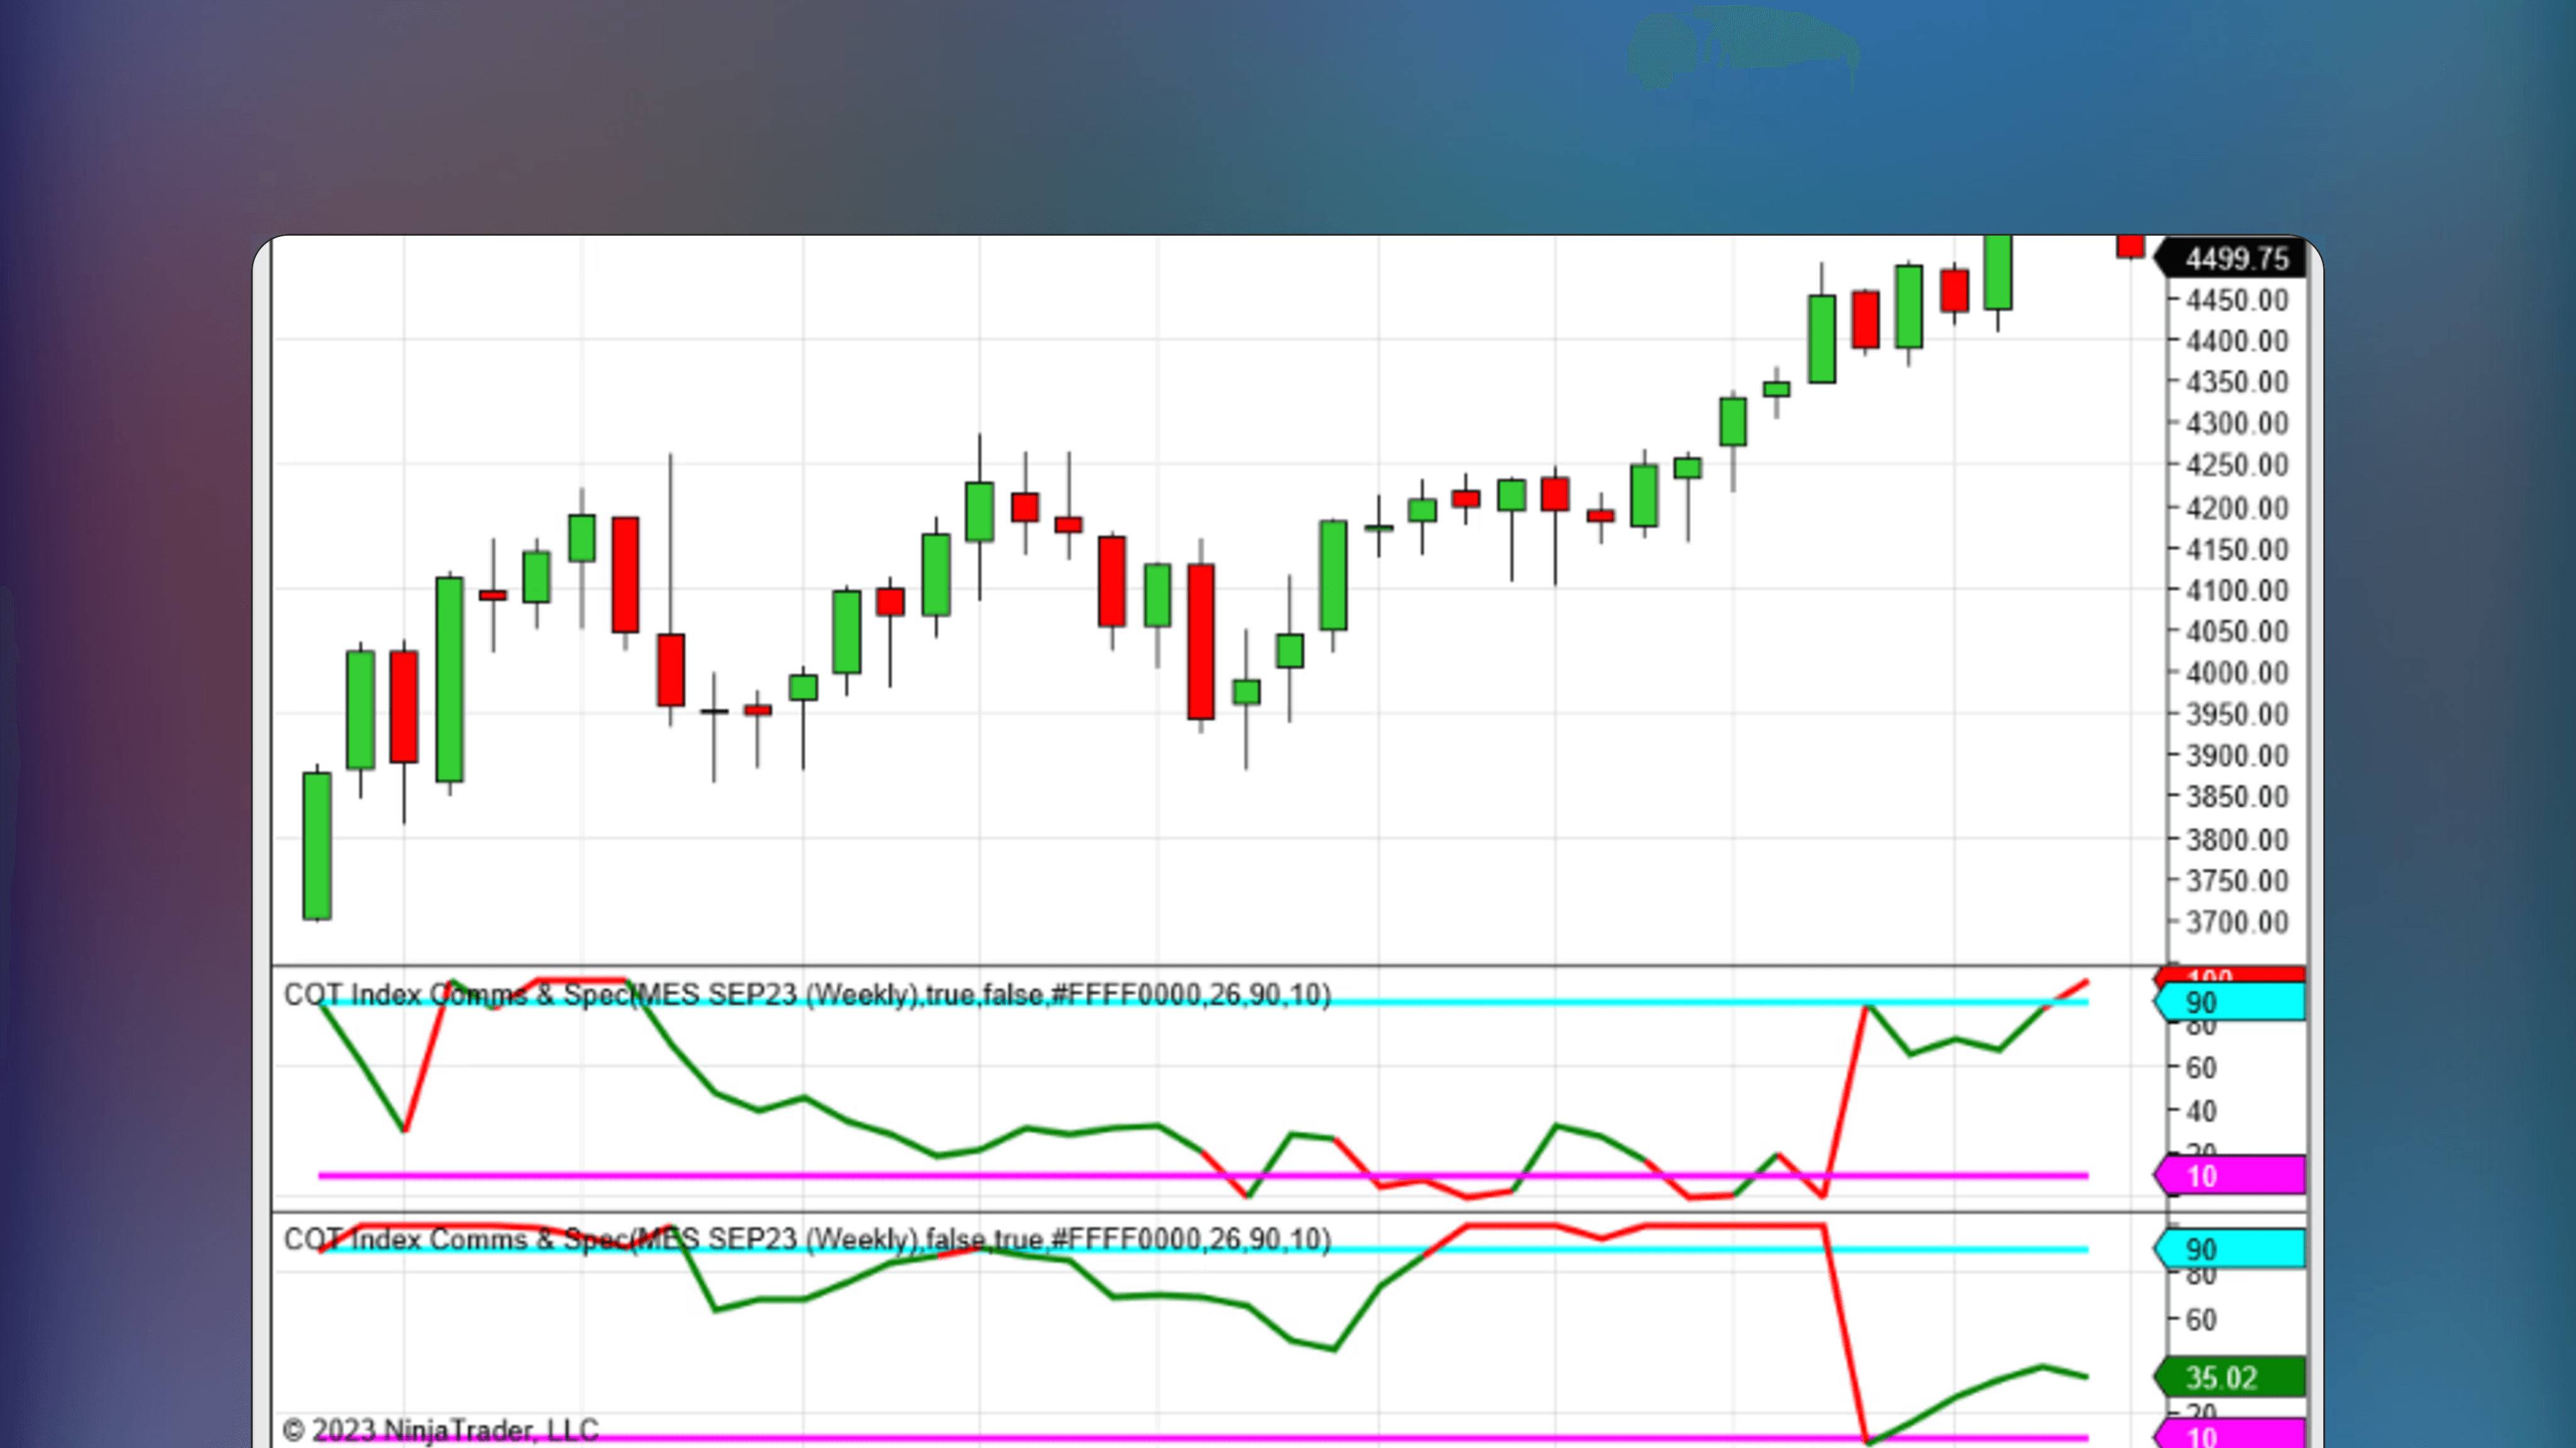
Commercials hedge real business risk and tend to be right at extremes while speculators follow momentum and tend to be wrong at turning points.
Obtain objective sentiment data
The COT Index normalizes positioning on a 0 to 100 scale, making readings comparable across different contracts and time periods for systematic analysis.
Identify sentiment extremes
Extreme readings historically precede major trend changes. When commercials reach extreme bullish positioning while speculators are heavily short, reversals often follow.
What is the difference between commercial and speculator positioning?
Commercials are producers and processors who hedge real business risk. They tend to be contrarian and right at extremes. Large speculators follow momentum and tend to be wrong at turning points.
How do I interpret the COT Index scale?
The index normalizes positioning on a 0 to 100 scale. A reading above 90 for commercials suggests extreme bullish positioning by smart money. Below 10 signals the opposite. These extremes historically precede major trend changes.
What timeframe is best for COT-based trading?
COT data updates weekly, making it best suited for swing and position trading rather than intraday scalping. Use the index as a weekly sentiment filter for medium-to-long-term directional bias on daily charts.
⭐️
⭐️
⭐️
⭐️
⭐️


✍️
By Author
More by NinjaTrader_Gaby
🔥
New Listings
Featured this week


🤖
Similar Listings
Traders also viewed
All

🤖
by NinjaTrader_AlanP

Free
NinjaTrader Indicator
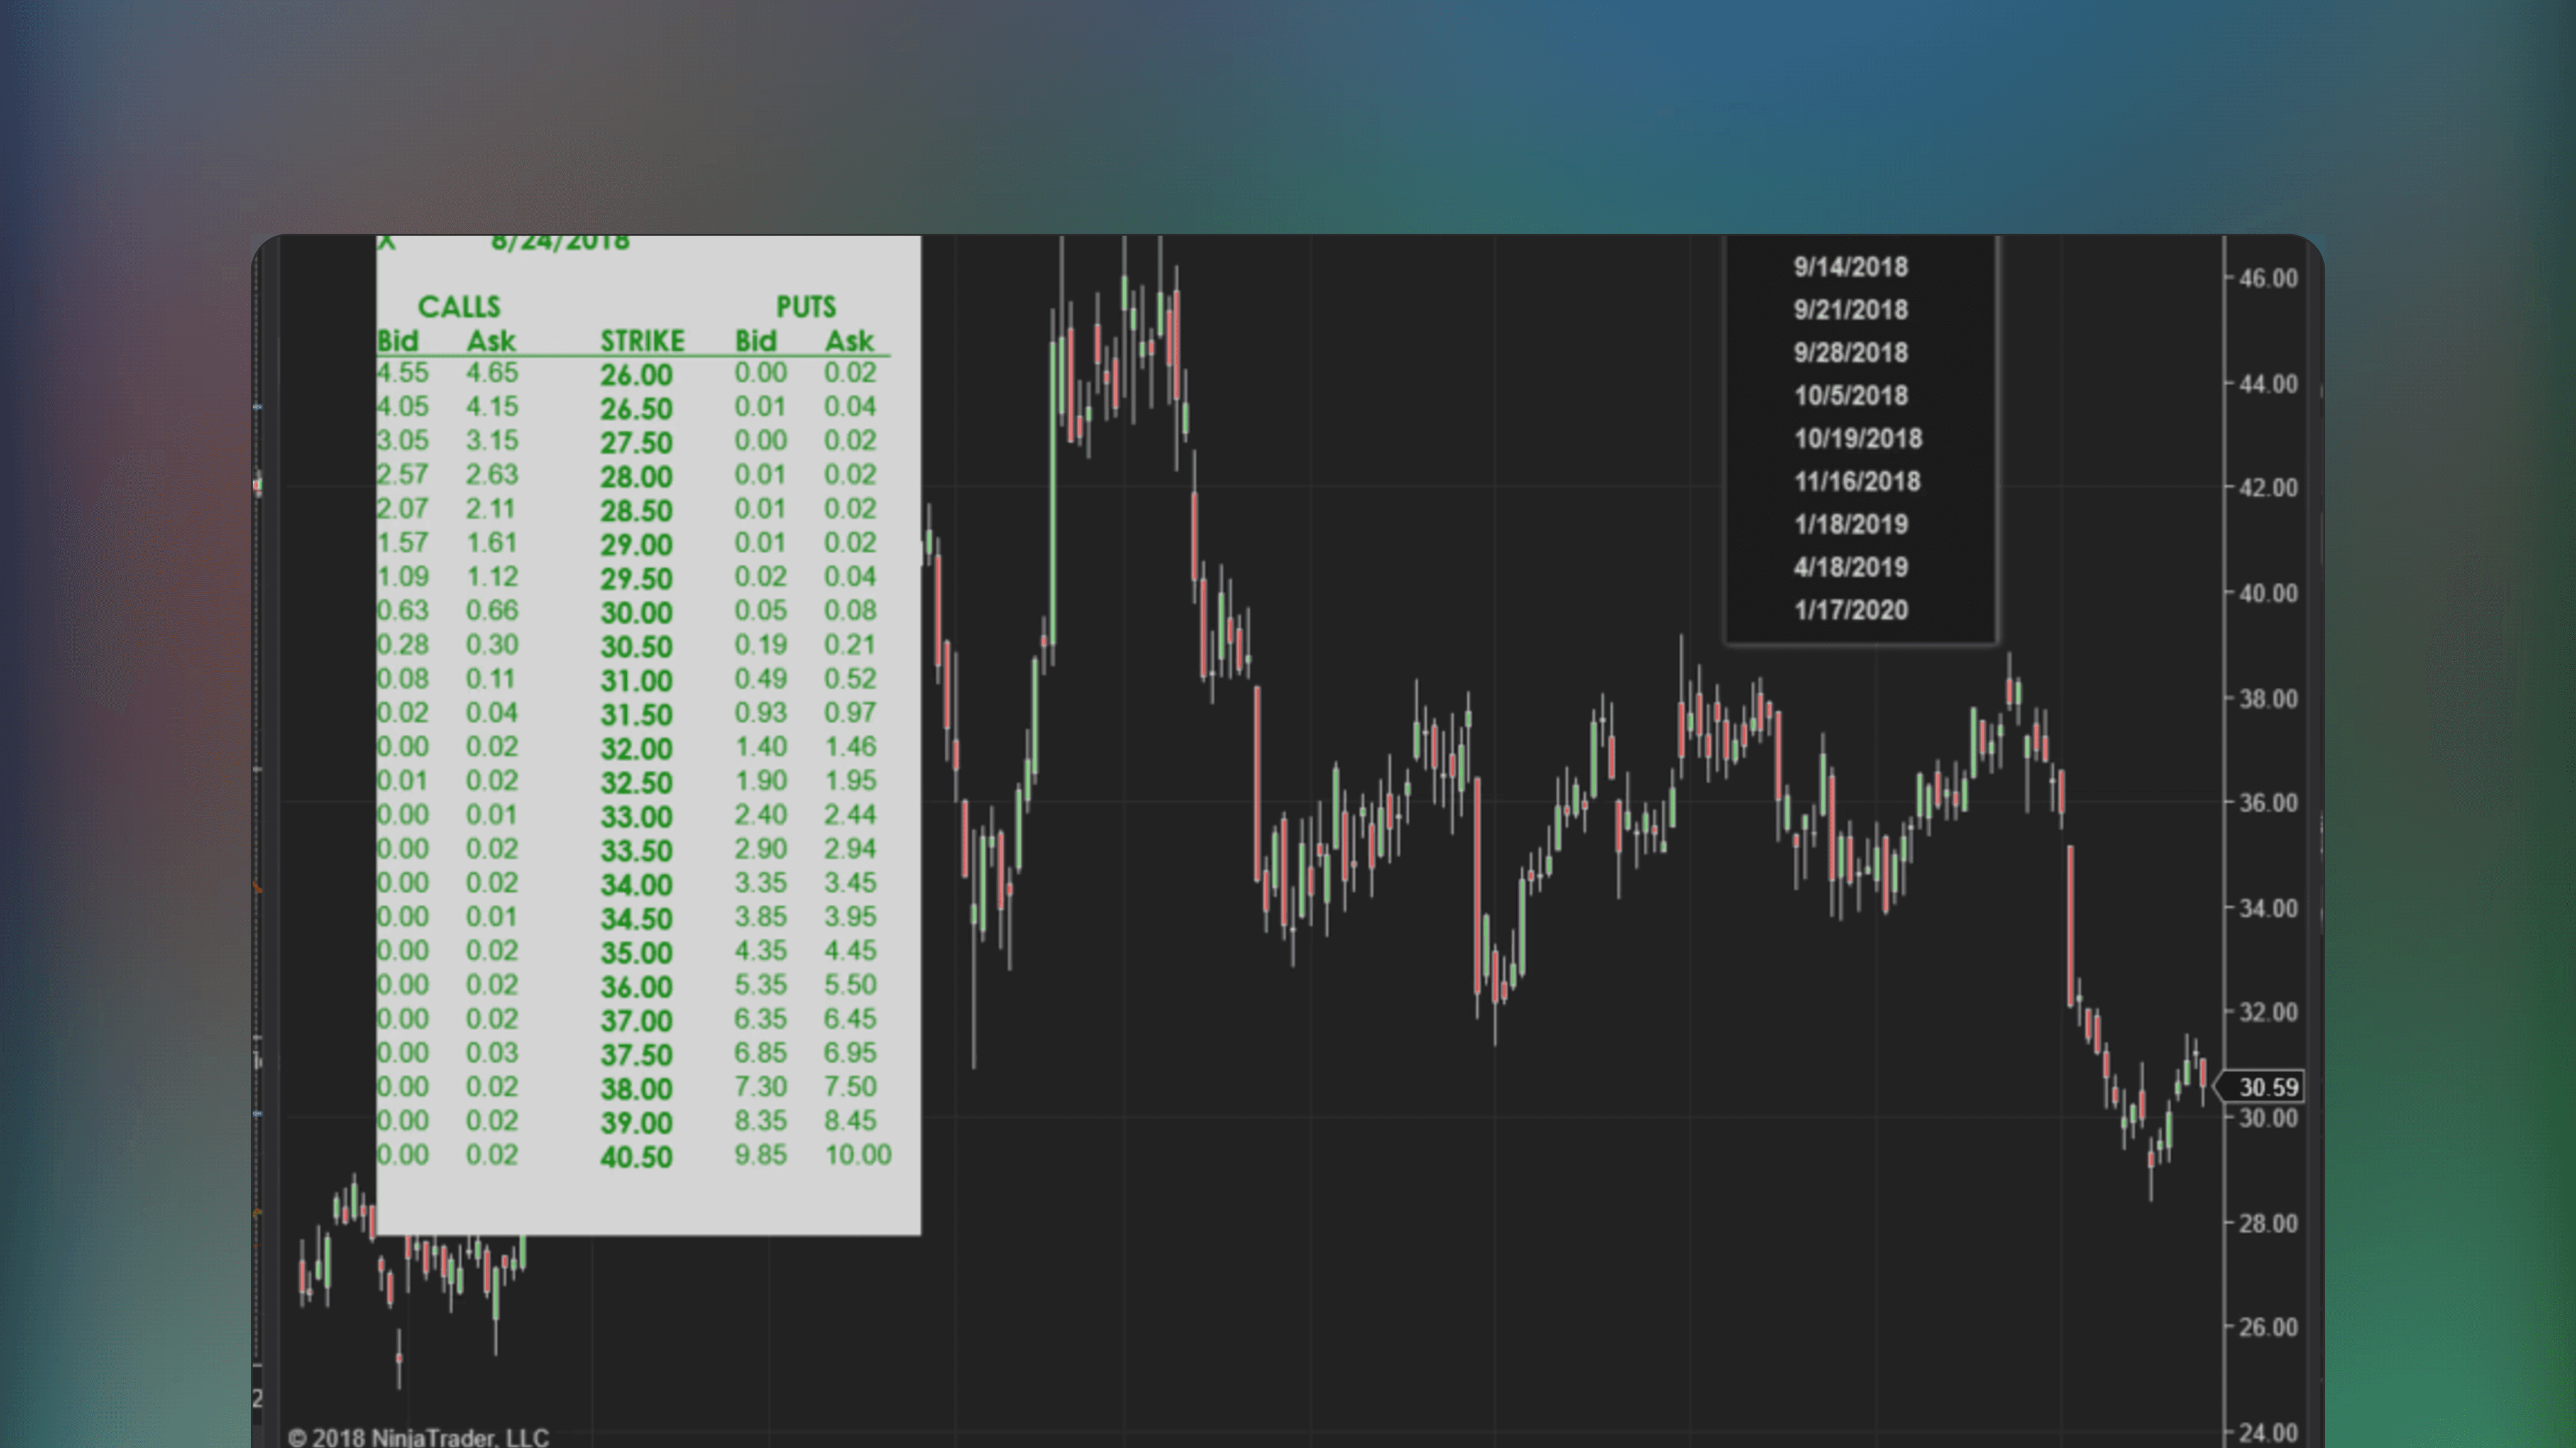
Options: Equity Options Chain Rendered on Chart Indicator
🔑
🌐
✅
🏅
Options: Equity Options Chain Rendered on Chart Indicator is a NinjaTrader indicator that integrates Yahoo’s options data on the chart directly. Pull up the options dashboard to aid your analysis whenever needed.
🤖
by NinjaTrader_AlanP
Free
NinjaTrader Indicator
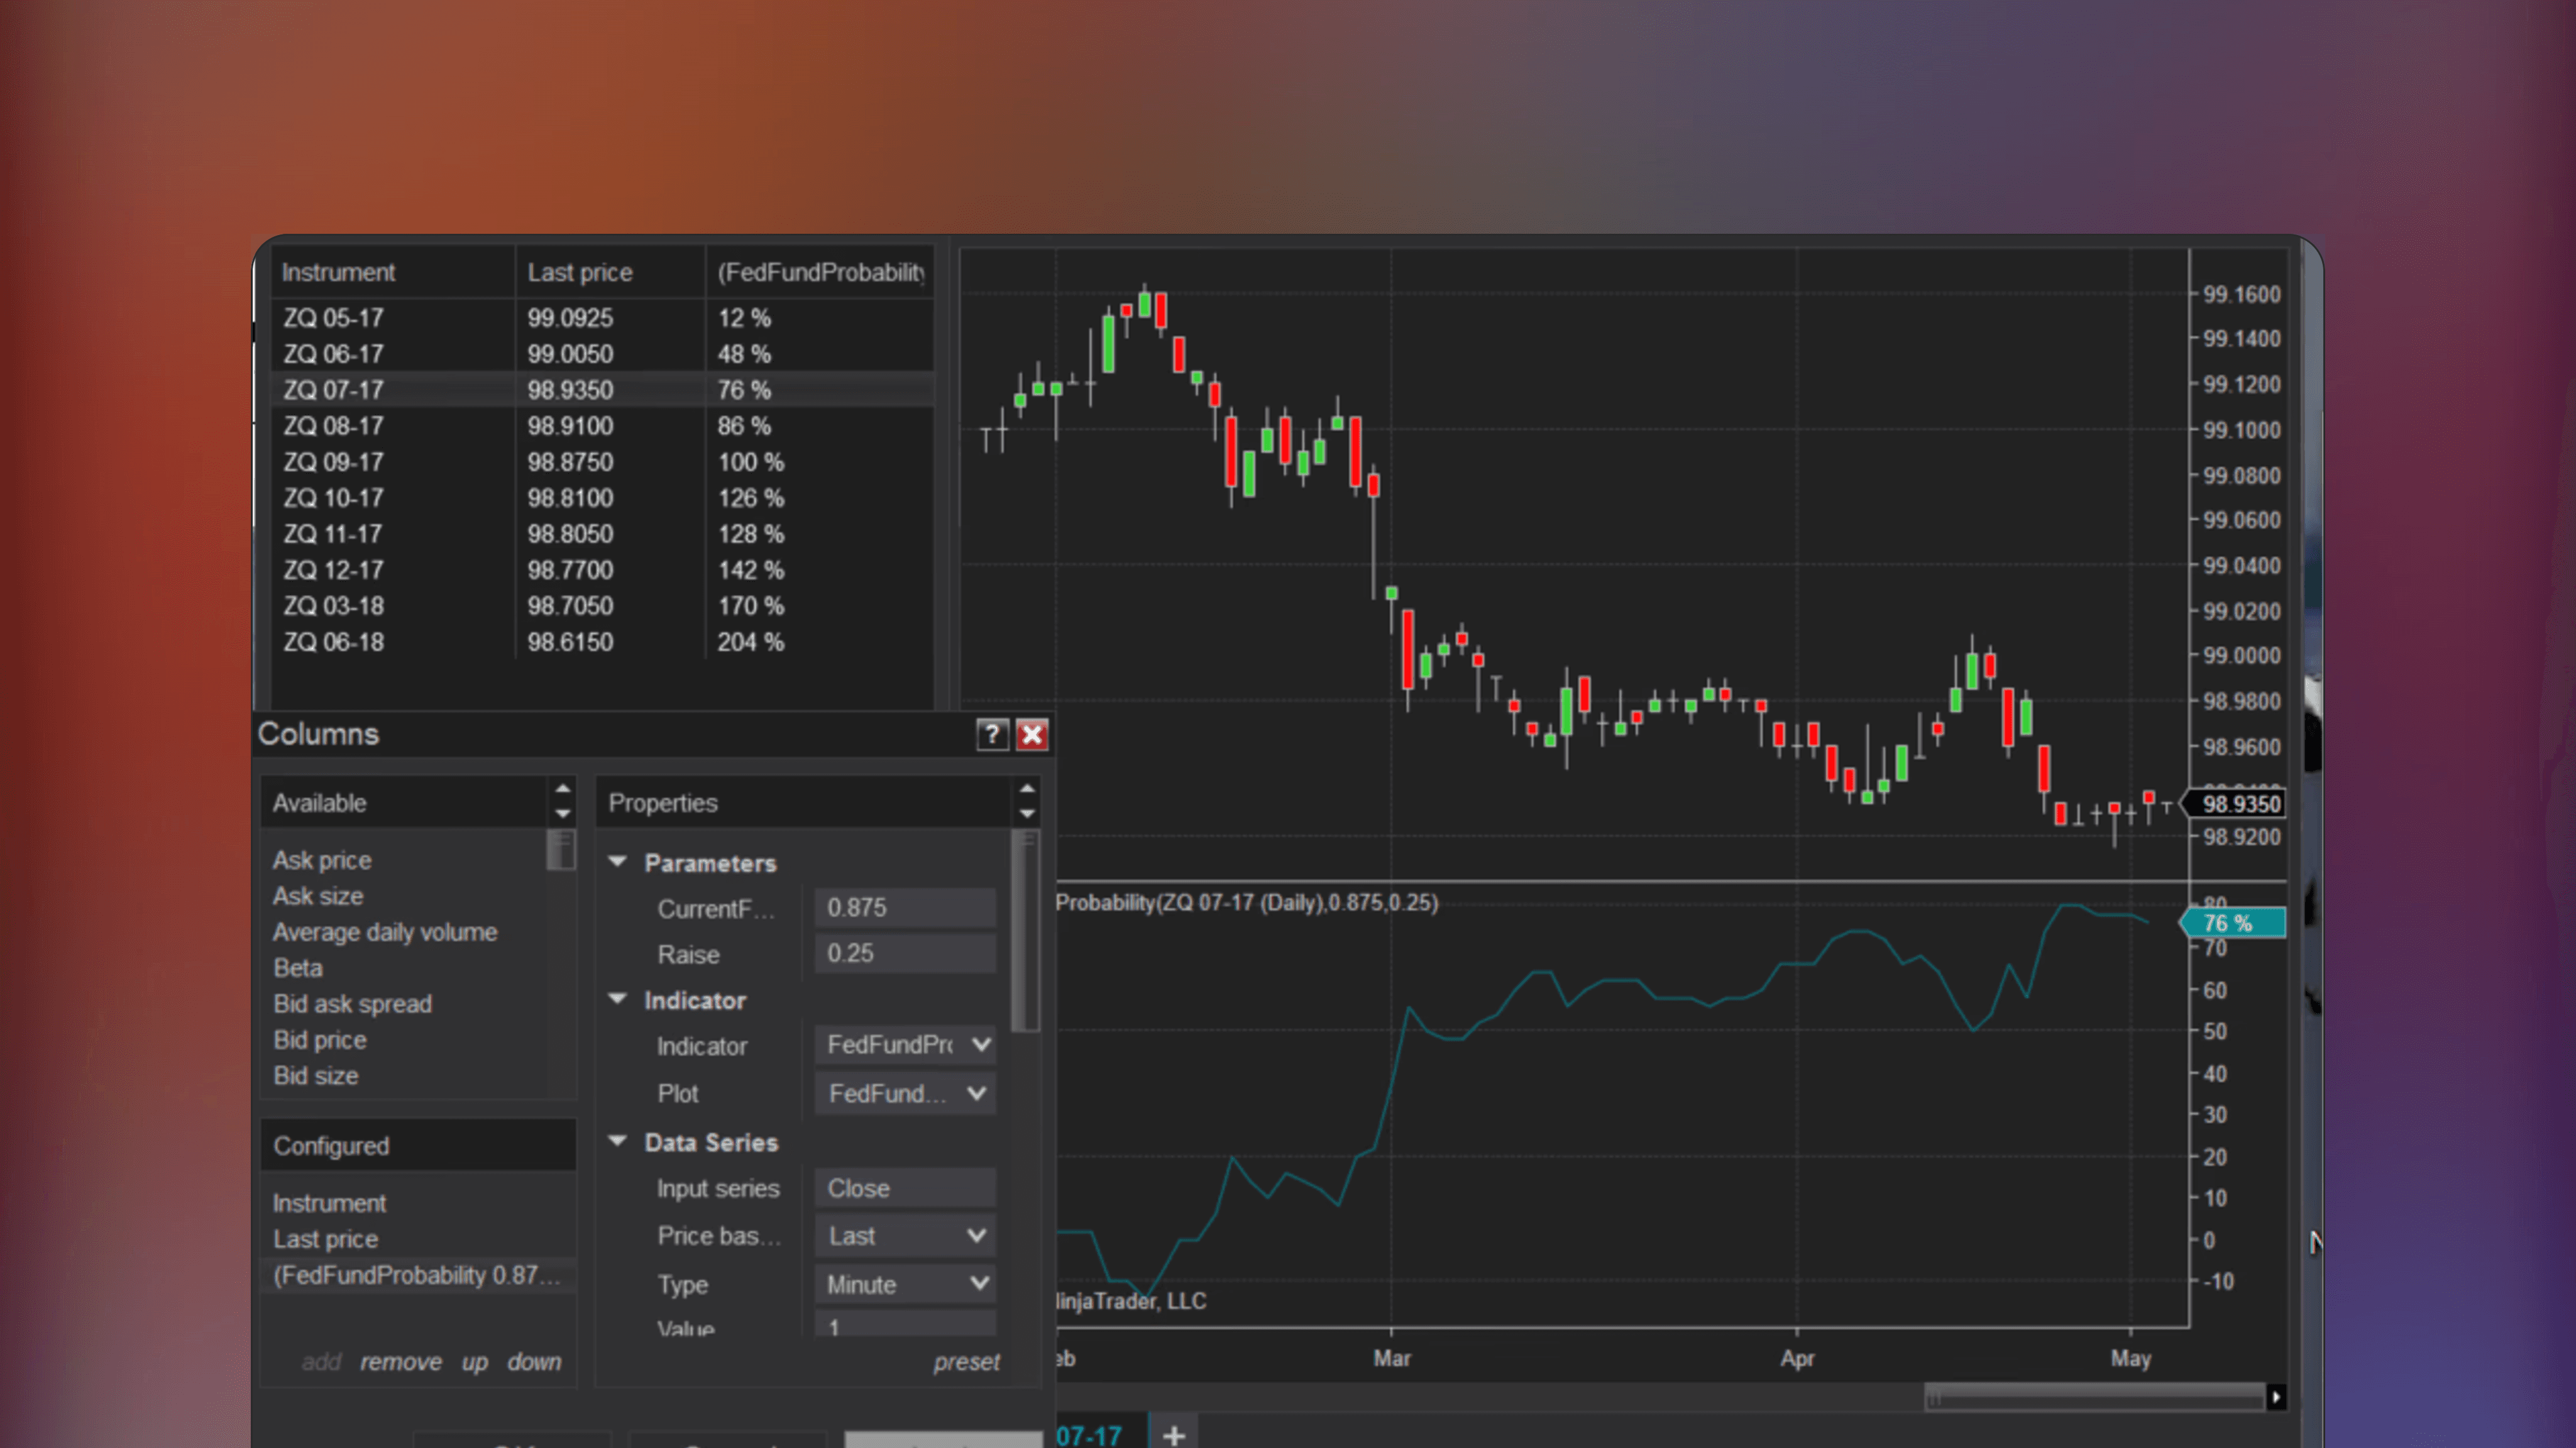
Fedfundprobability Indicator
🔑
🌐
✅
🏅
The Fedfundprobability Indicator is a NinjaTrader indicator that estimates the probability of specific FED interest rate hikes or cuts using FED futures contracts.

🤖
by NinjaTrader_Jim
Free
NinjaTrader Indicator
StockRatingSystem
🔑
🏅
StockRatingSystem is a NinjaTrader Indicator that ranks stocks using a mathematical formula based on Markos Katsanos' technical analysis methodology, as detailed in his June 2018 Stocks and Commodities article "A Technical Method for Rating Stocks".

🤖
by siroki
Free
NinjaTrader Indicator
Sessioncolors
🔑
🌐
✅
Sessioncolors is a NinjaTrader indicator that marks and customizes the start and end times of the Asia, London, and New York trading sessions on a price chart. Identify trading sessions using colored boxes with adjustable visuals for each.

🤖
by NinjaTrader_Jim
Free
NinjaTrader Indicator
Probability Distribution NT8
🔑
🏅
Probability Distribution NT8 is a NinjaTrader Indicator that calculates probability distributions for price data, based on statistical methods introduced by John F. Ehlers.

🤖
by NinjaTrader_AdamP
Free
NinjaTrader Indicator
Spread Indicator With Candlesticks
🔑
Spread Indicator With Candlesticks is a free NinjaTrader indicator that visualizes bid-ask spreads by plotting them as easy to read candlesticks on trading charts.

🤖
by StevenL
Free
NinjaTrader Indicator
Futures Settlement Lines
🔑
🌐
Futures Settlement Lines is a NinjaTrader indicator that plots the last two futures contract settlement prices from the end of Regular Trading Hours, showing how current prices interact with these key closing levels.