


Identify High-Probability Zones
The distribution curve shows where price is statistically most likely to settle, creating objective reference points for mean reversion trades.
Measure Statistical Risk
Positions taken at the tails of the distribution carry higher risk while those near the center align with statistical probability.
Apply to Custom Market Data
The calculation can be applied to any price series in NinjaTrader, adapting the statistical framework to various instruments and timeframes.
How does the distribution help identify trading levels?
Prices at the distribution's tails represent low-probability extremes. If price sits at the 95th percentile, it is statistically stretched and mean reversion becomes favorable. The distribution quantifies what qualifies as extreme.
What are Ehlers' methods and why are they used?
John F. Ehlers pioneered applying digital signal processing to financial markets. His techniques filter noise and extract meaningful cycles from price data. The indicator uses his methods to create more accurate probability estimates.
Does the distribution work in trending markets?
In strong trends, price can remain at distribution extremes longer than expected. The distribution assumes some degree of mean reversion. Combining probability analysis with trend filters helps avoid fading strong momentum.
⭐️
⭐️
⭐️
⭐️
⭐️


✍️
By Author
More by NinjaTrader_Jim

🤖
by NinjaTrader_Jim

Free
NinjaTrader Indicator
MeanReversal Strategy NT8
🔑
🌐
🏅
MeanReversal Strategy NT8 is a NinjaTrader Indicator based on Anthony Garner’s 2019 backtested mean-reversion strategy, identifying assets that have moved to extremes from their mean for potential reversion.

🤖
by NinjaTrader_Jim

Free
NinjaTrader Indicator
StockRatingSystem
🔑
🏅
StockRatingSystem is a NinjaTrader Indicator that ranks stocks using a mathematical formula based on Markos Katsanos' technical analysis methodology, as detailed in his June 2018 Stocks and Commodities article "A Technical Method for Rating Stocks".
🔥
New Listings
Featured this week


🤖
Similar Listings
Traders also viewed
All

🤖
by NinjaTrader_AlanP
Free
NinjaTrader Indicator
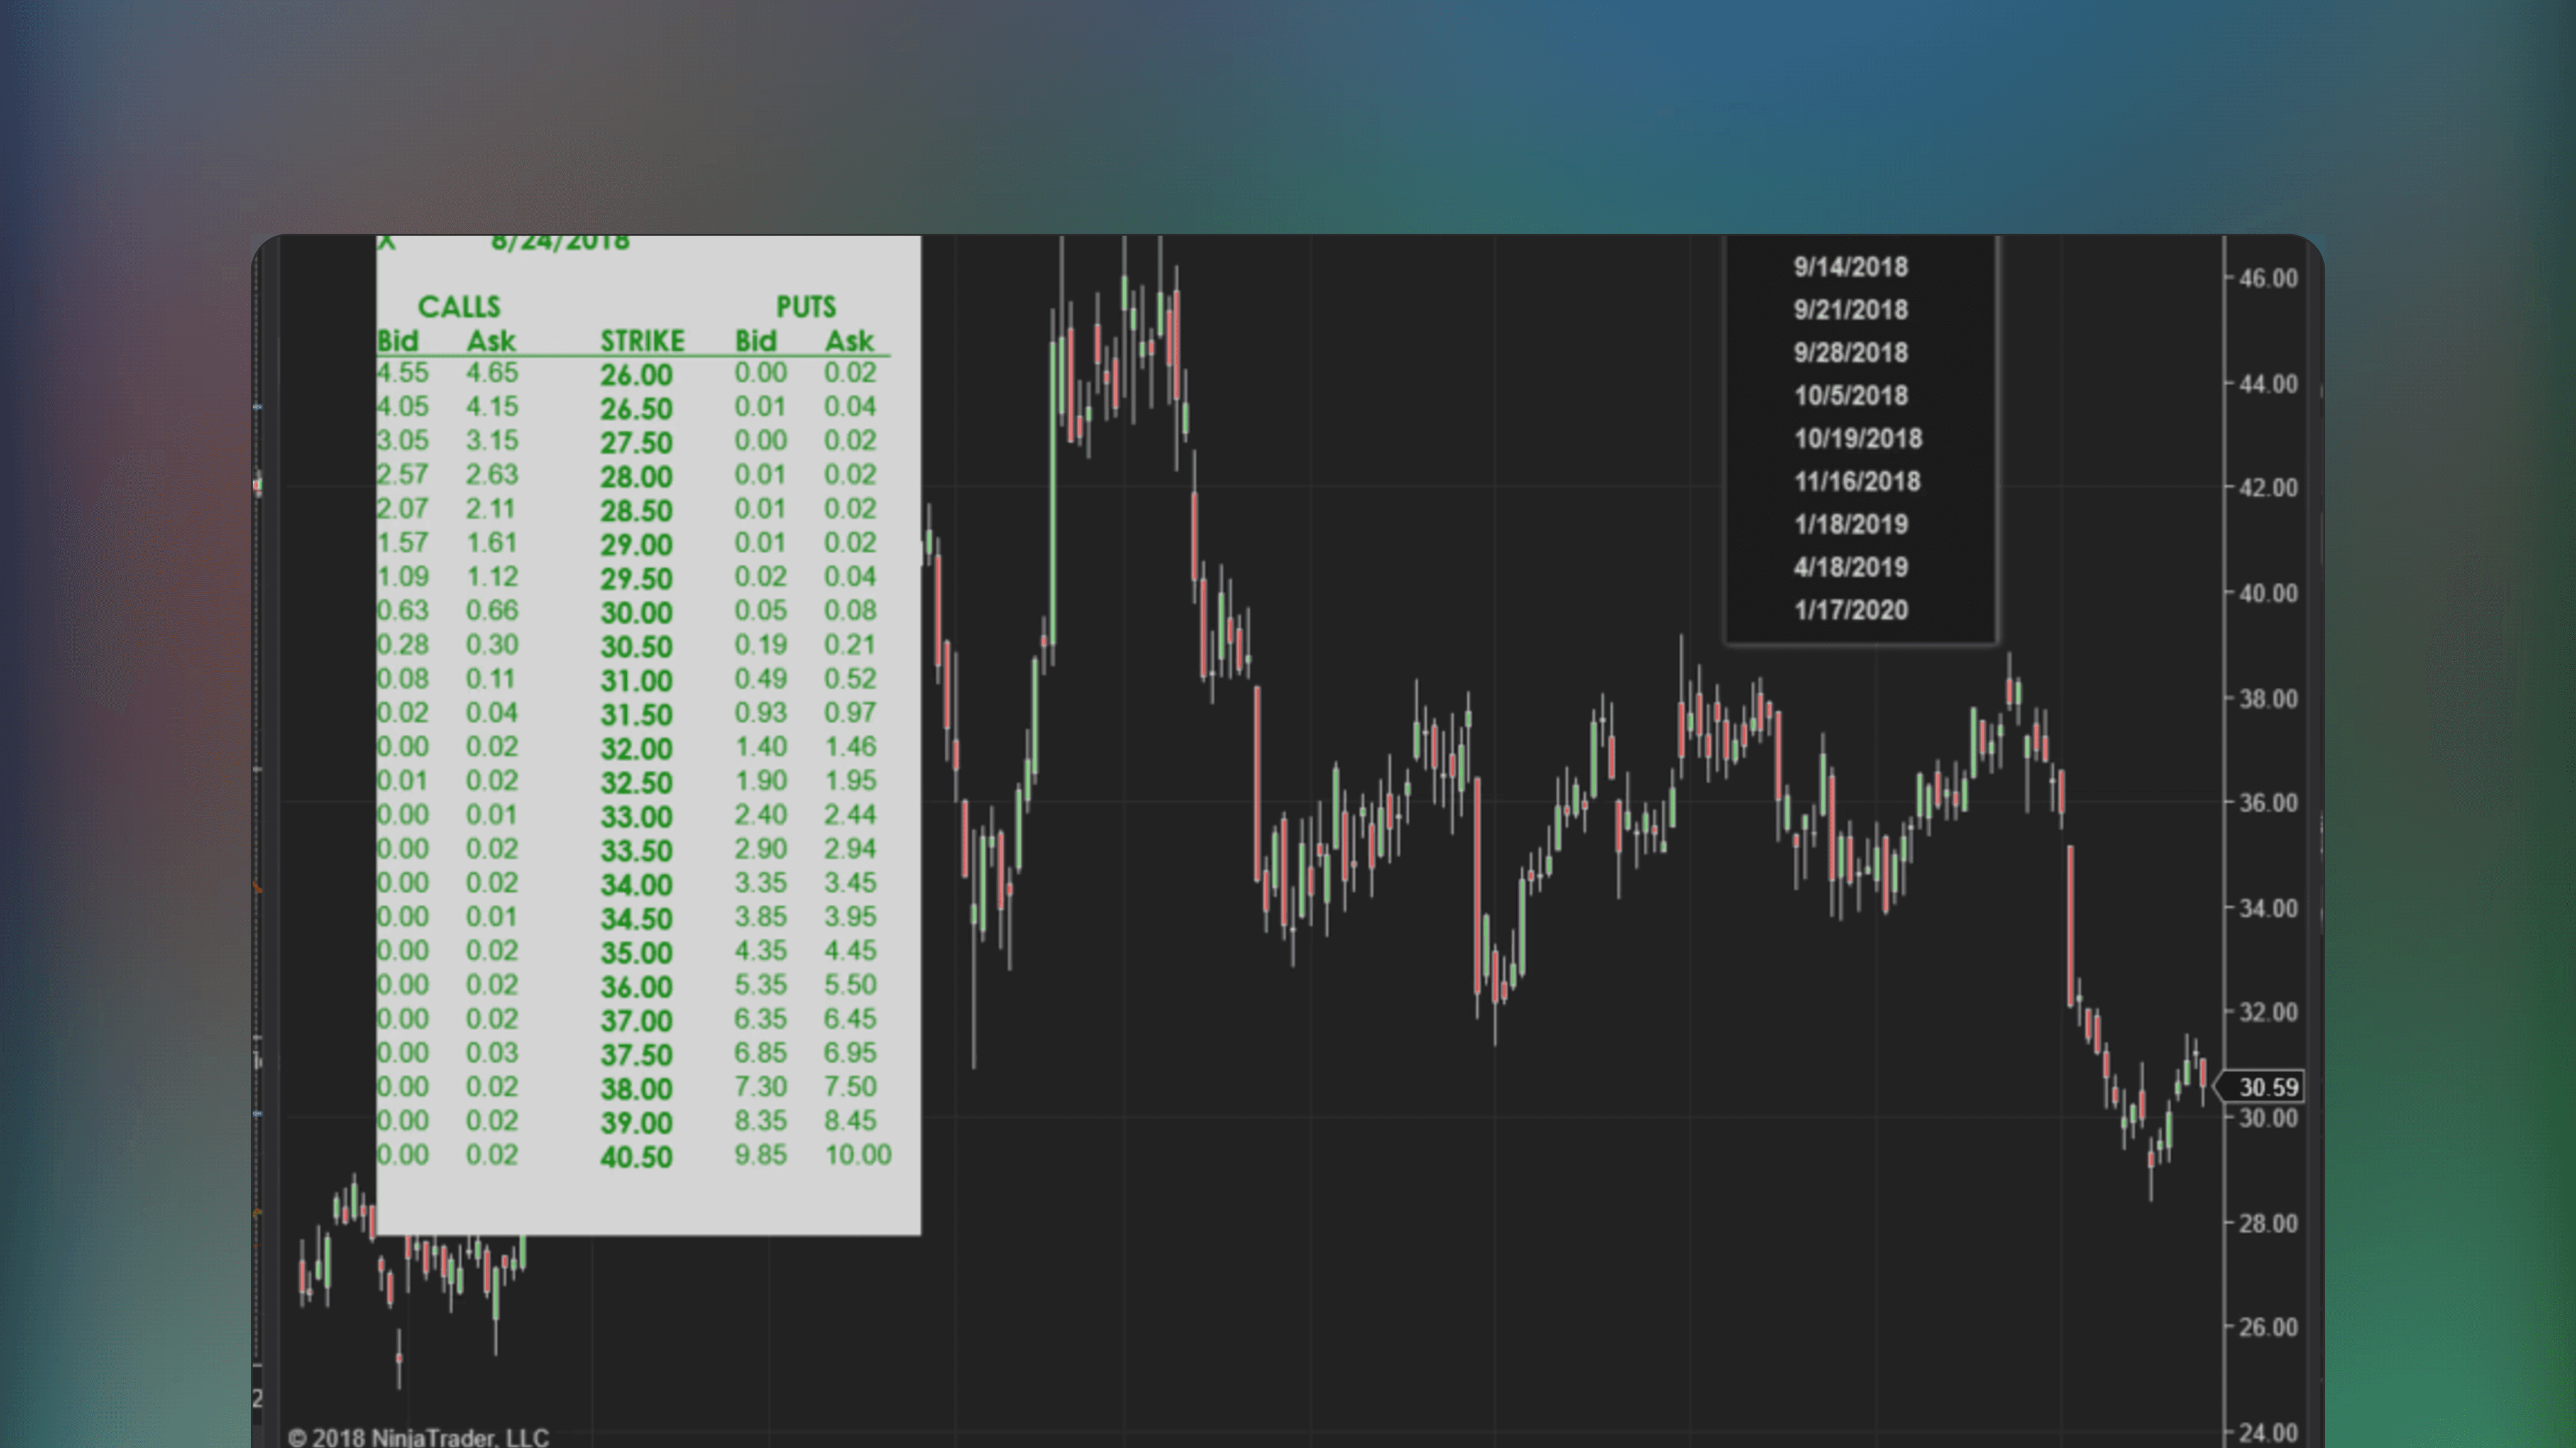
Options: Equity Options Chain Rendered on Chart Indicator
🔑
🌐
✅
🏅
Options: Equity Options Chain Rendered on Chart Indicator is a NinjaTrader indicator that integrates Yahoo’s options data on the chart directly. Pull up the options dashboard to aid your analysis whenever needed.
🤖
by NinjaTrader_AlanP
Free
NinjaTrader Indicator
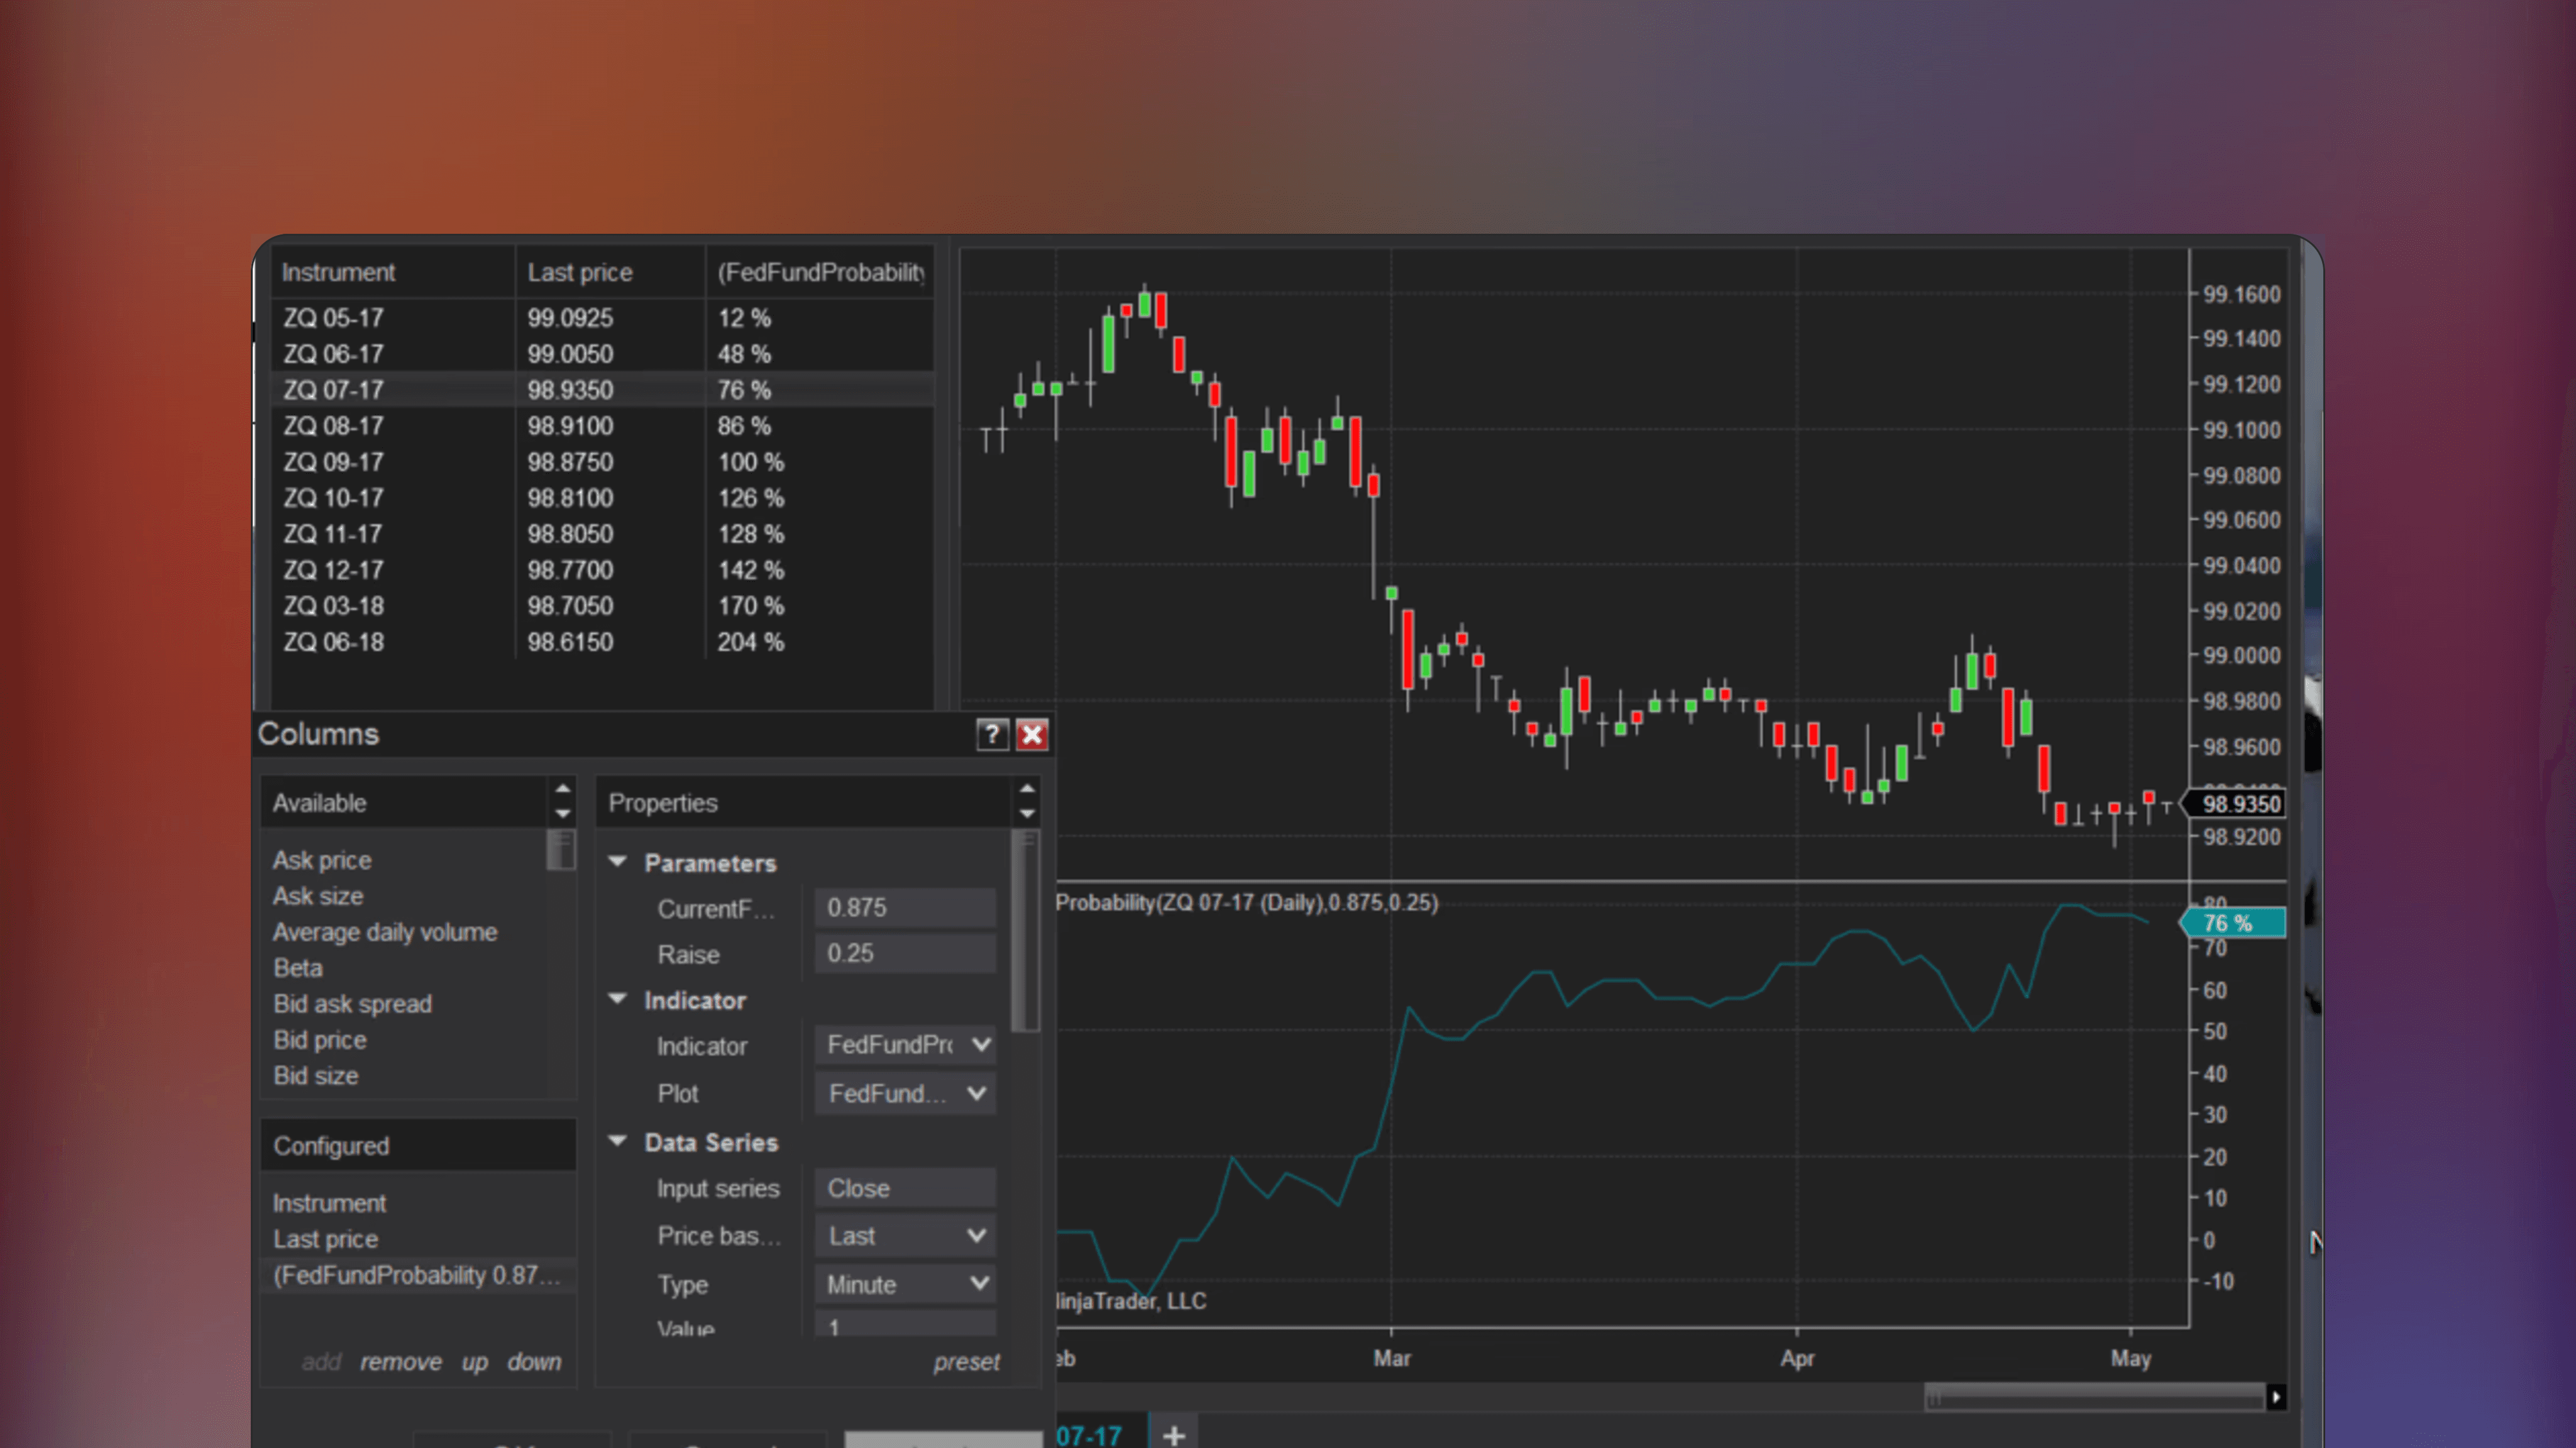
Fedfundprobability Indicator
🔑
🌐
✅
🏅
The Fedfundprobability Indicator is a NinjaTrader indicator that estimates the probability of specific FED interest rate hikes or cuts using FED futures contracts.
🤖
by NinjaTrader_Jim
Free
NinjaTrader Indicator
StockRatingSystem
🔑
🏅
StockRatingSystem is a NinjaTrader Indicator that ranks stocks using a mathematical formula based on Markos Katsanos' technical analysis methodology, as detailed in his June 2018 Stocks and Commodities article "A Technical Method for Rating Stocks".

🤖
by siroki
Free
NinjaTrader Indicator
Sessioncolors
🔑
🌐
✅
Sessioncolors is a NinjaTrader indicator that marks and customizes the start and end times of the Asia, London, and New York trading sessions on a price chart. Identify trading sessions using colored boxes with adjustable visuals for each.

🤖
by NinjaTrader_AdamP
Free
NinjaTrader Indicator
Spread Indicator With Candlesticks
🔑
Spread Indicator With Candlesticks is a free NinjaTrader indicator that visualizes bid-ask spreads by plotting them as easy to read candlesticks on trading charts.
🤖
by NinjaTrader_Gaby
Free
NinjaTrader Indicator
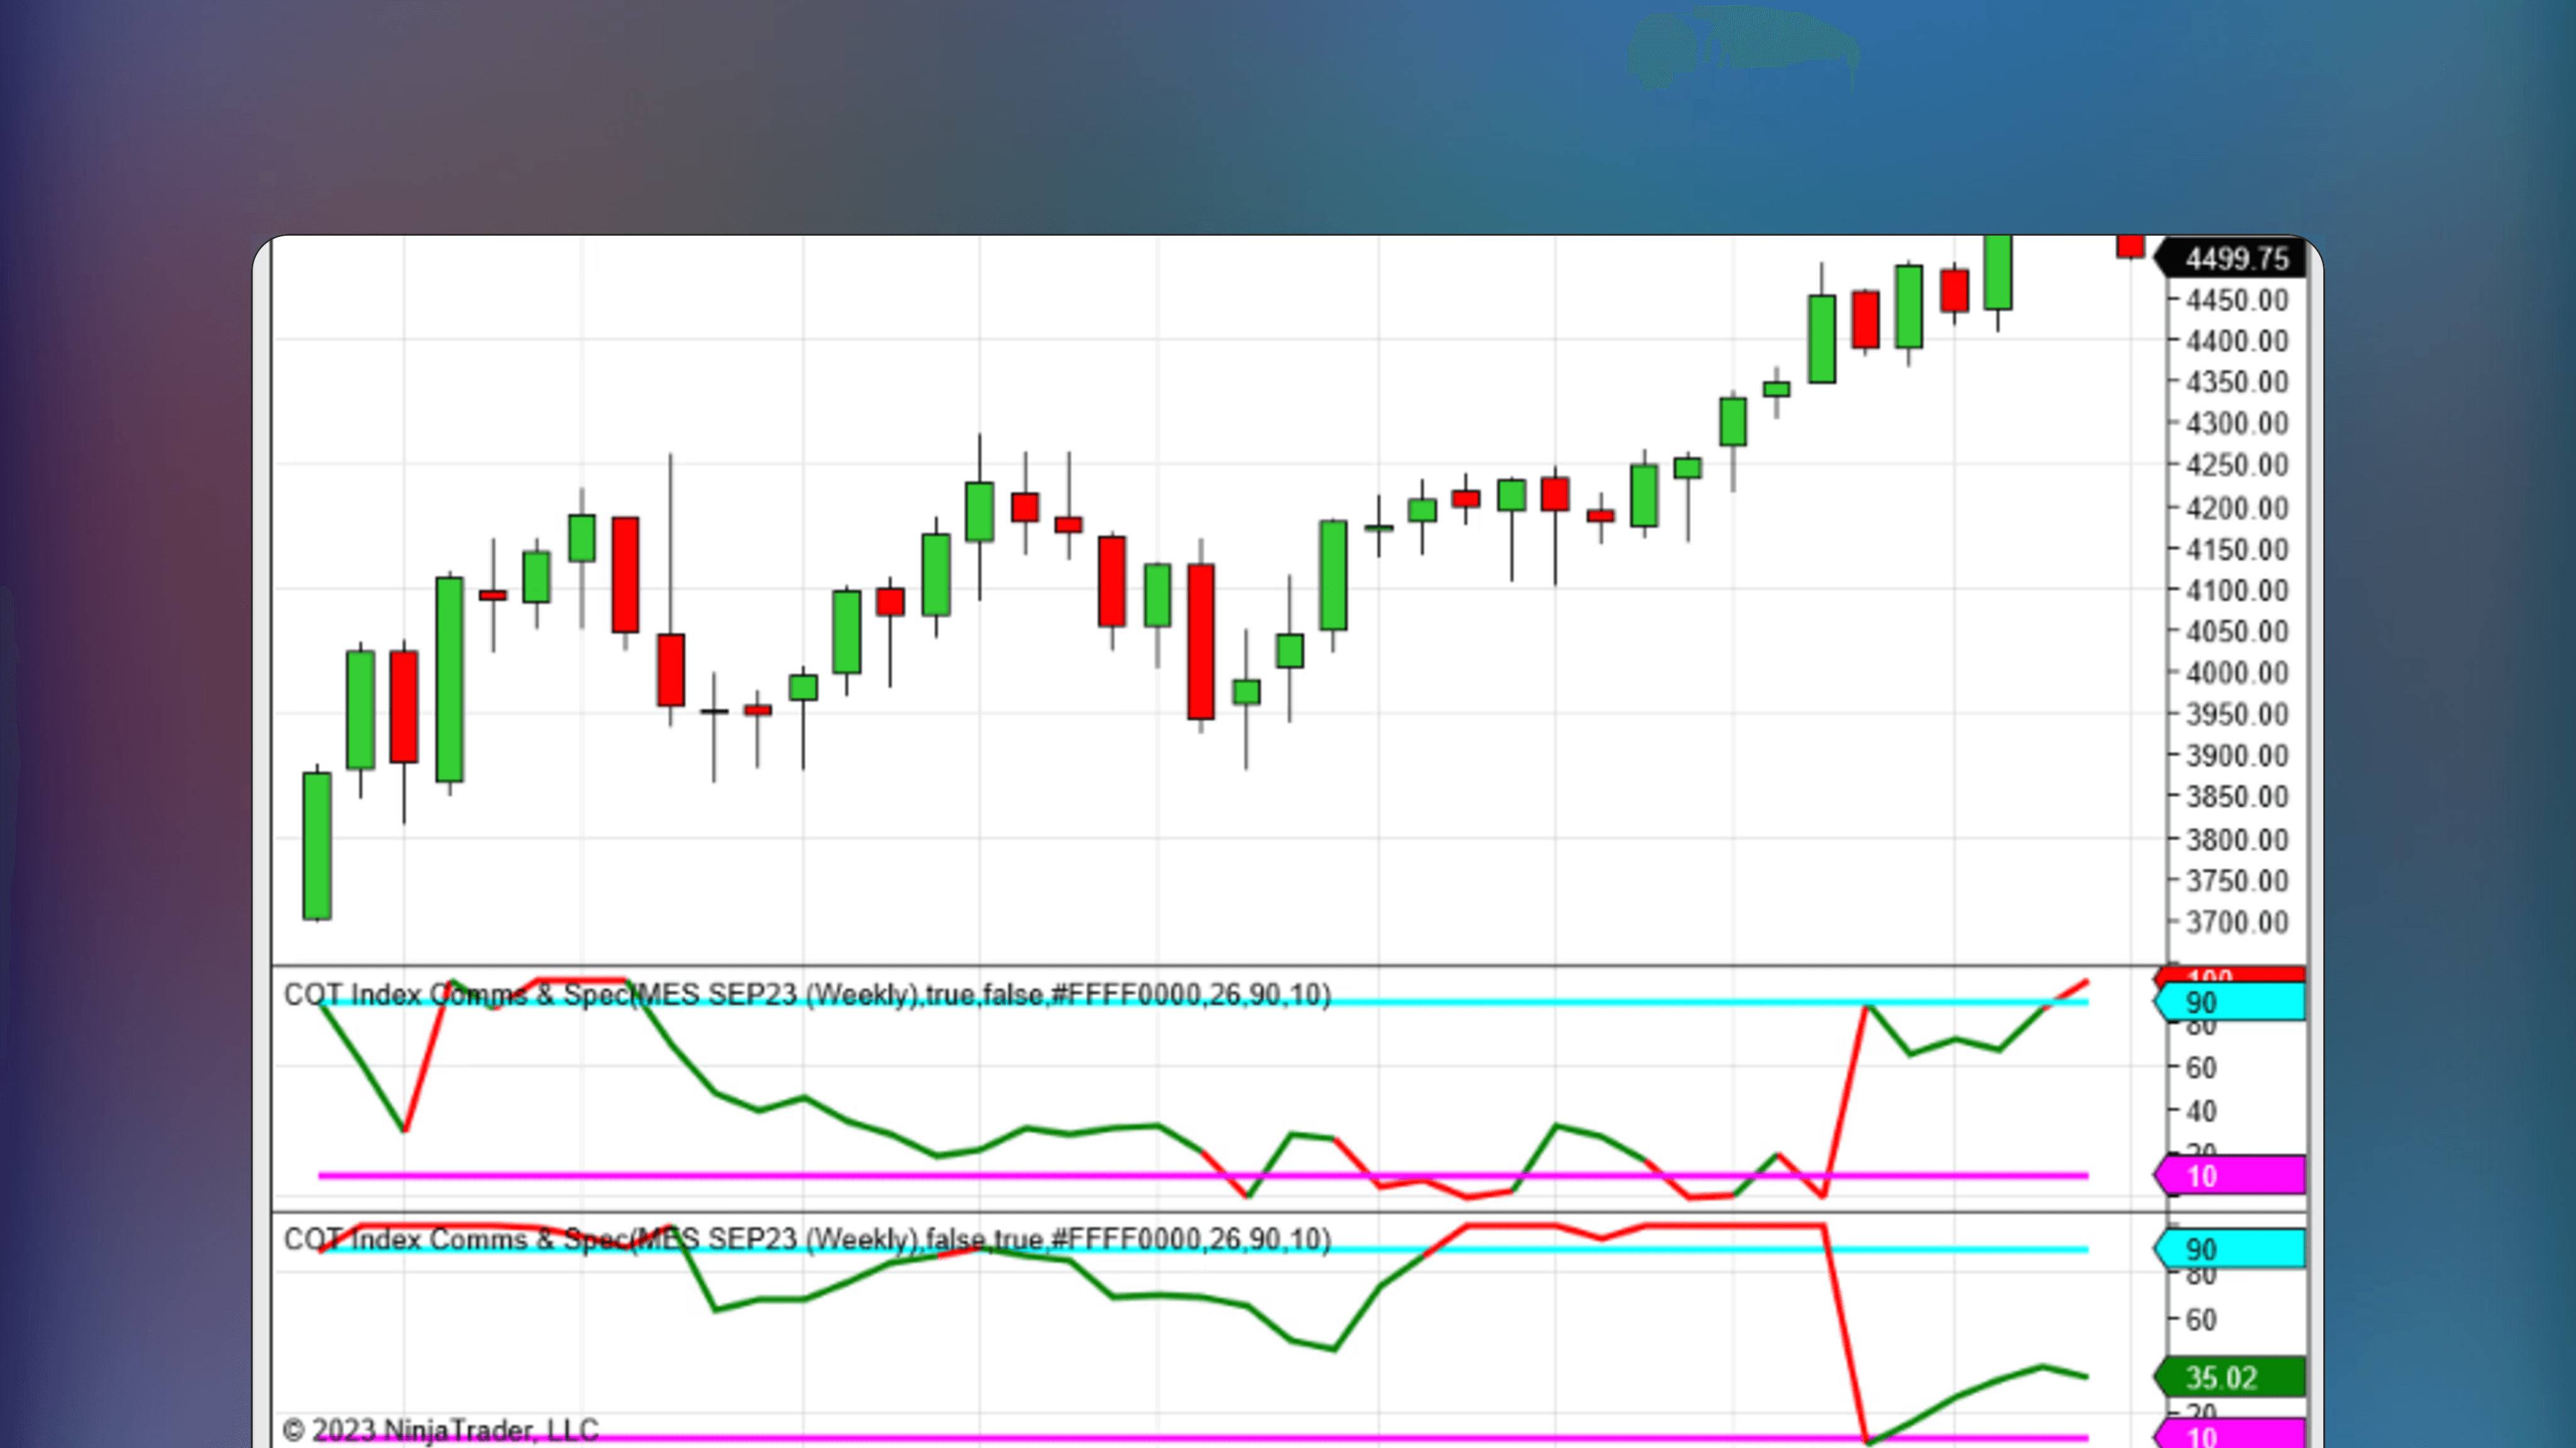
COT Index Comms & Spec NT8
🔑
🌐
✅
COT Index Comms & Spec NT8 is a NinjaTrader indicator that aggregates futures traders' positions using the COT index, providing data on positioning and sentiment.

🤖
by StevenL
Free
NinjaTrader Indicator
Futures Settlement Lines
🔑
🌐
Futures Settlement Lines is a NinjaTrader indicator that plots the last two futures contract settlement prices from the end of Regular Trading Hours, showing how current prices interact with these key closing levels.