


Monitor Global Sessions Visually
Different sessions have different characteristics. Asian sessions tend to range, London opens produce breakouts and New York brings the most volume.
Adjust Session Parameters
Adjust start and end times for each session to match broker server time. Colors, transparency and border styles are all configurable.
Trade Around Session Windows
Many strategies are session-specific. Visually separating sessions lets you study how your strategy performs in each window historically.
What are the typical start and end times for each session?
Asian session typically runs from 6 PM to 3 AM EST. London opens around 3 AM EST. New York opens at 8 AM EST. However, exact times vary by broker and instrument. The indicator lets you customize start and end times to match your data feed.
Why does the Asian session behave differently than London or New York?
Volume and participant type differ by session. Asian sessions often see lower volume and range-bound behavior. London brings European institutional activity and often produces breakouts. New York adds American participants and typically generates the highest volatility.
Can I backtest session-specific strategies using the colored boxes?
Yes. The visual separation makes it easy to scroll through historical data and see how your strategy performed during specific sessions. Compare win rates and average moves across sessions to identify which time windows suit your approach best.
⭐️
⭐️
⭐️
⭐️
⭐️


✍️
By Author
More by siroki


🔥
New Listings
Featured this week


🤖
Similar Listings
Traders also viewed
All

🤖
by NinjaTrader_AlanP

Free
NinjaTrader Indicator
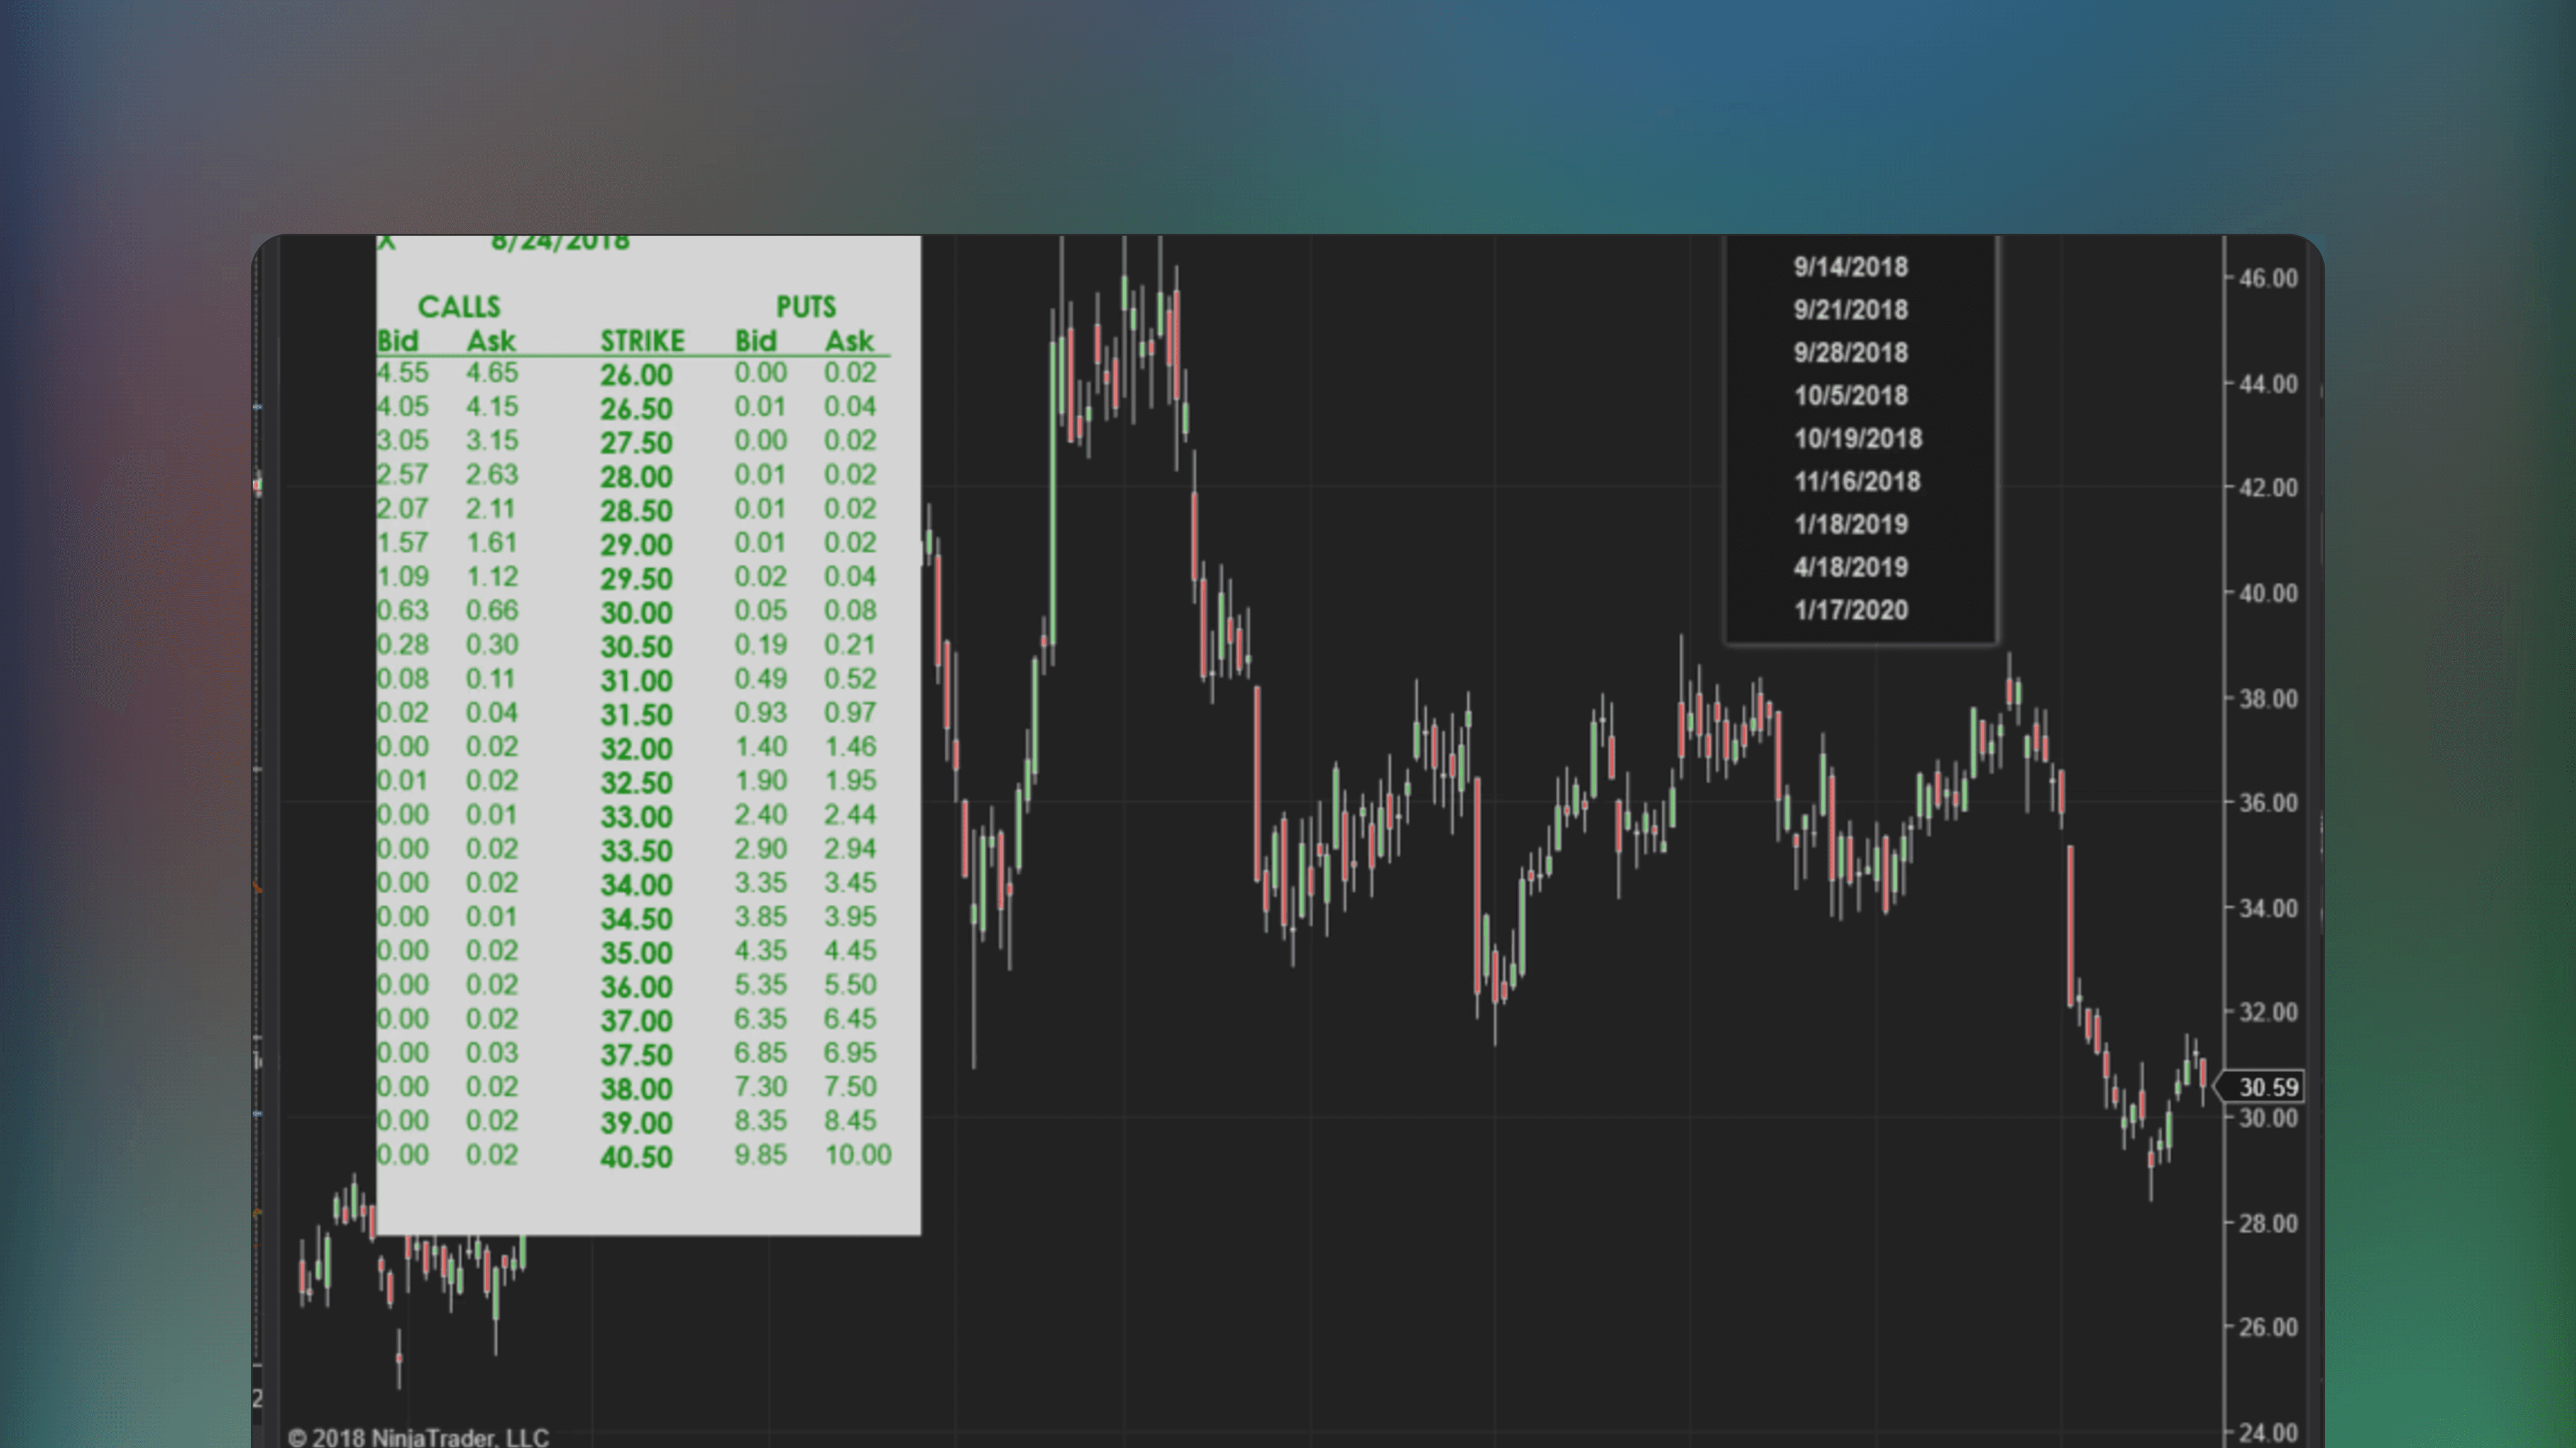
Options: Equity Options Chain Rendered on Chart Indicator
🔑
🌐
✅
🏅
Options: Equity Options Chain Rendered on Chart Indicator is a NinjaTrader indicator that integrates Yahoo’s options data on the chart directly. Pull up the options dashboard to aid your analysis whenever needed.
🤖
by NinjaTrader_AlanP
Free
NinjaTrader Indicator
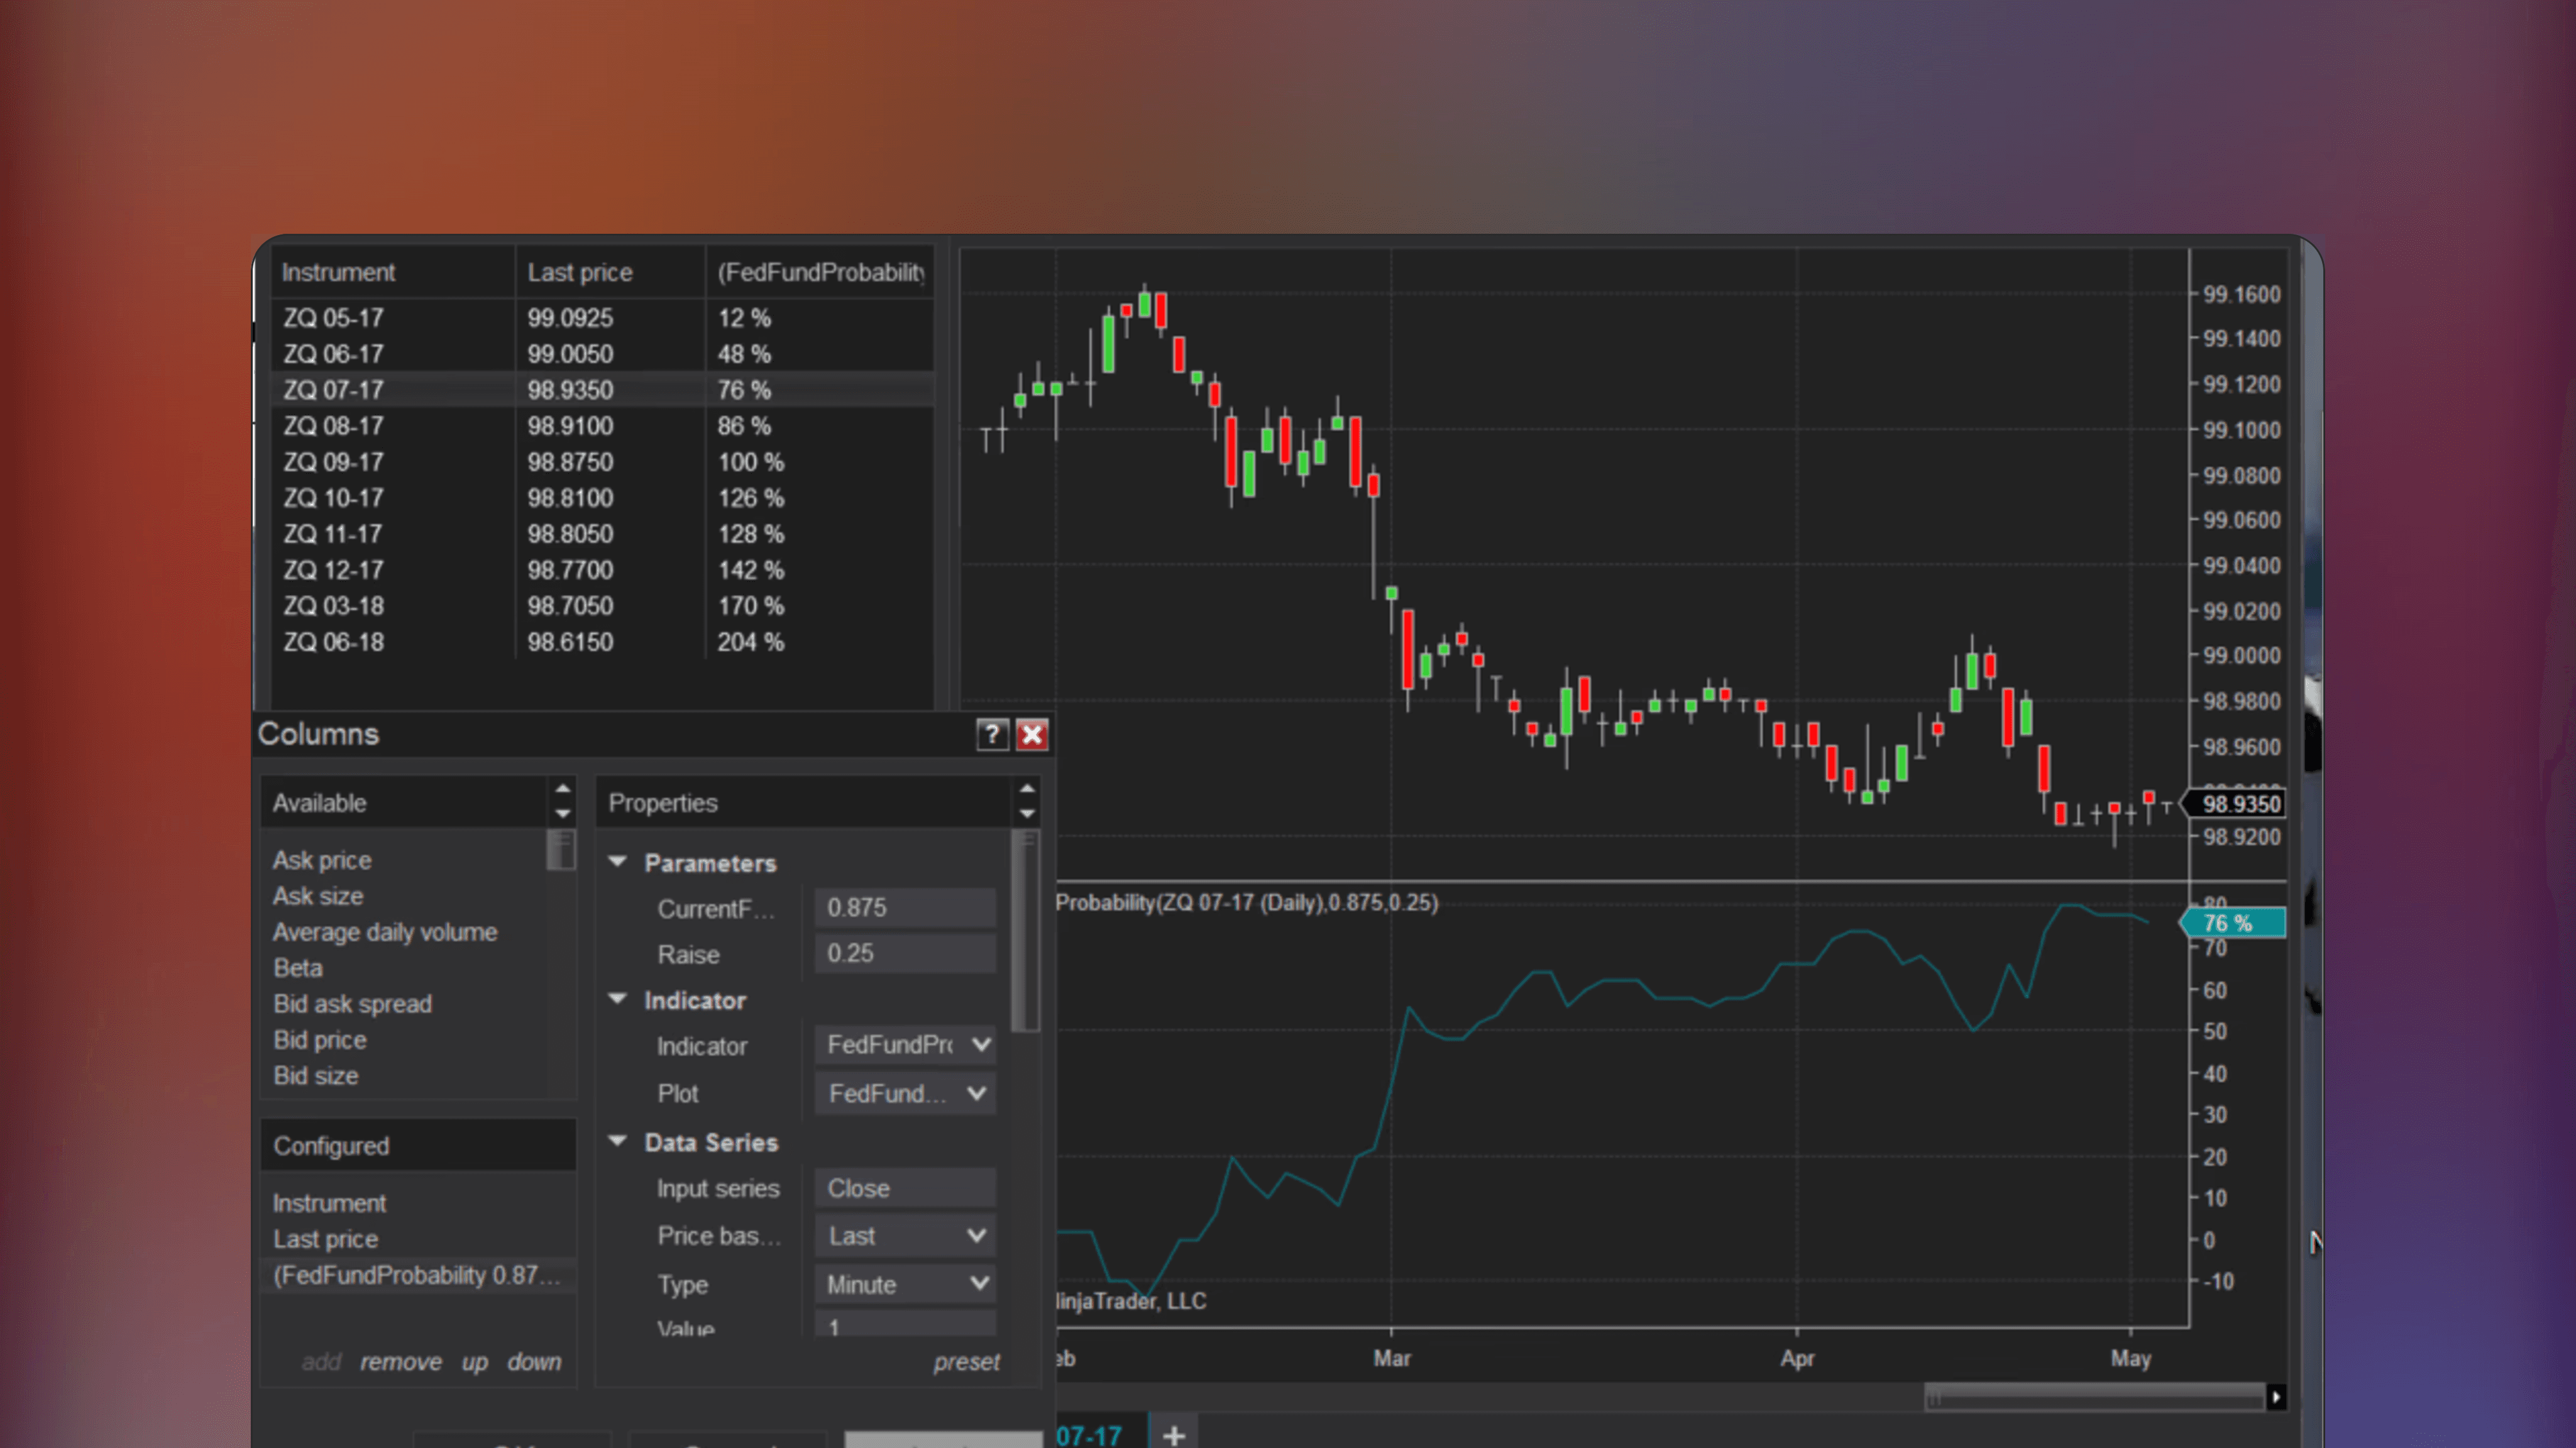
Fedfundprobability Indicator
🔑
🌐
✅
🏅
The Fedfundprobability Indicator is a NinjaTrader indicator that estimates the probability of specific FED interest rate hikes or cuts using FED futures contracts.

🤖
by NinjaTrader_Jim
Free
NinjaTrader Indicator
StockRatingSystem
🔑
🏅
StockRatingSystem is a NinjaTrader Indicator that ranks stocks using a mathematical formula based on Markos Katsanos' technical analysis methodology, as detailed in his June 2018 Stocks and Commodities article "A Technical Method for Rating Stocks".

🤖
by NinjaTrader_Jim
Free
NinjaTrader Indicator
Probability Distribution NT8
🔑
🏅
Probability Distribution NT8 is a NinjaTrader Indicator that calculates probability distributions for price data, based on statistical methods introduced by John F. Ehlers.

🤖
by NinjaTrader_AdamP
Free
NinjaTrader Indicator
Spread Indicator With Candlesticks
🔑
Spread Indicator With Candlesticks is a free NinjaTrader indicator that visualizes bid-ask spreads by plotting them as easy to read candlesticks on trading charts.
🤖
by NinjaTrader_Gaby
Free
NinjaTrader Indicator
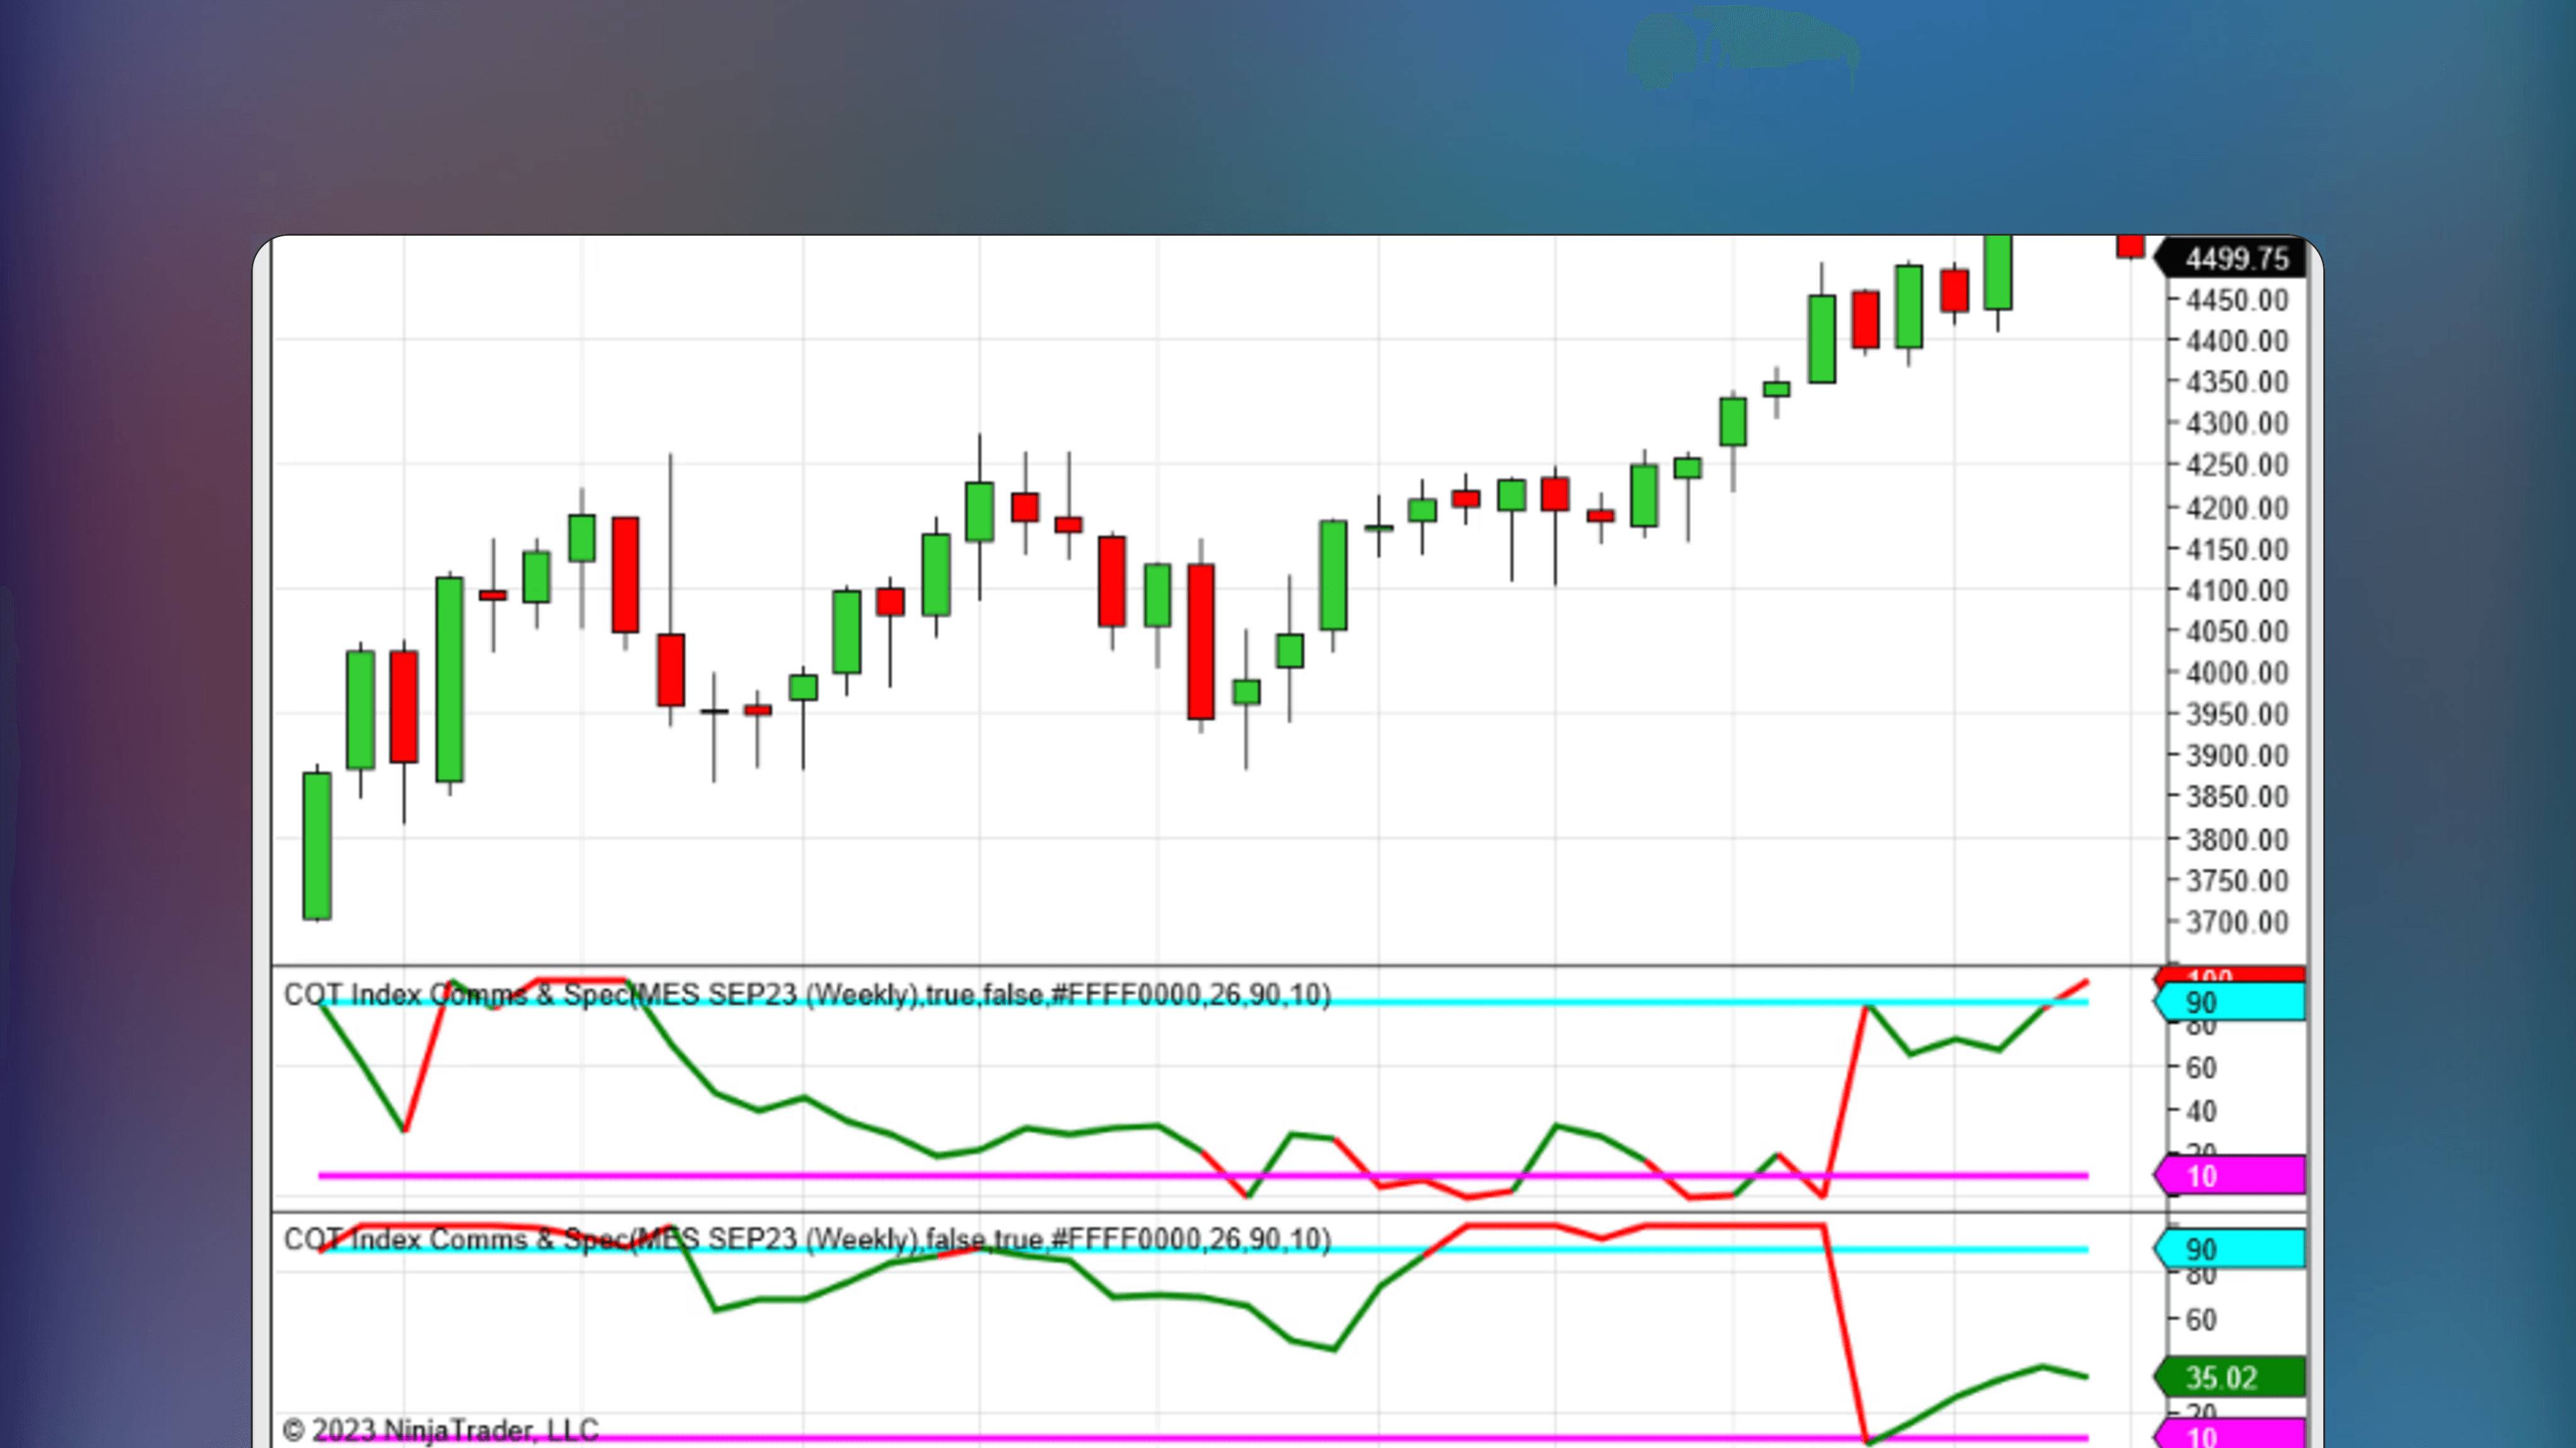
COT Index Comms & Spec NT8
🔑
🌐
✅
COT Index Comms & Spec NT8 is a NinjaTrader indicator that aggregates futures traders' positions using the COT index, providing data on positioning and sentiment.

🤖
by StevenL
Free
NinjaTrader Indicator
Futures Settlement Lines
🔑
🌐
Futures Settlement Lines is a NinjaTrader indicator that plots the last two futures contract settlement prices from the end of Regular Trading Hours, showing how current prices interact with these key closing levels.