


Read Liquidity Visually
Candlestick display of spreads shows liquidity conditions at a glance, with tight spreads indicating efficient markets and wide spreads signaling caution.
Detect Abnormal Spread Behavior
Sudden spread widening compared to recent history warns of thinning liquidity or increased uncertainty in the market.
Monitor Order Book Imbalances
Spread changes reflect shifts in buyer and seller competition, revealing when one side is dominating the order book.
What does widening spread indicate about market conditions?
Widening spreads indicate reduced liquidity, increased uncertainty or heightened volatility. This often occurs before major news, during off-hours or when large players exit. Wide spreads increase trading costs and may signal caution for new entries.
How do I use spread data for better entry timing?
Enter positions when spreads are narrow indicating good liquidity and lower execution costs. Avoid entries during spread spikes which suggest unfavorable conditions. Narrow spreads during directional moves confirm genuine participation rather than thin market noise.
Why does spread sometimes spike during fast market moves?
Rapid price moves create uncertainty for market makers who widen spreads to protect against adverse selection. Liquidity providers pull quotes during volatility. These spikes indicate difficult execution conditions where slippage risk is elevated.
⭐️
⭐️
⭐️
⭐️
⭐️


✍️
By Author
More by NinjaTrader_AdamP
🔥
New Listings
Featured this week


🤖
Similar Listings
Traders also viewed
All

🤖
by NinjaTrader_AlanP

Free
NinjaTrader Indicator
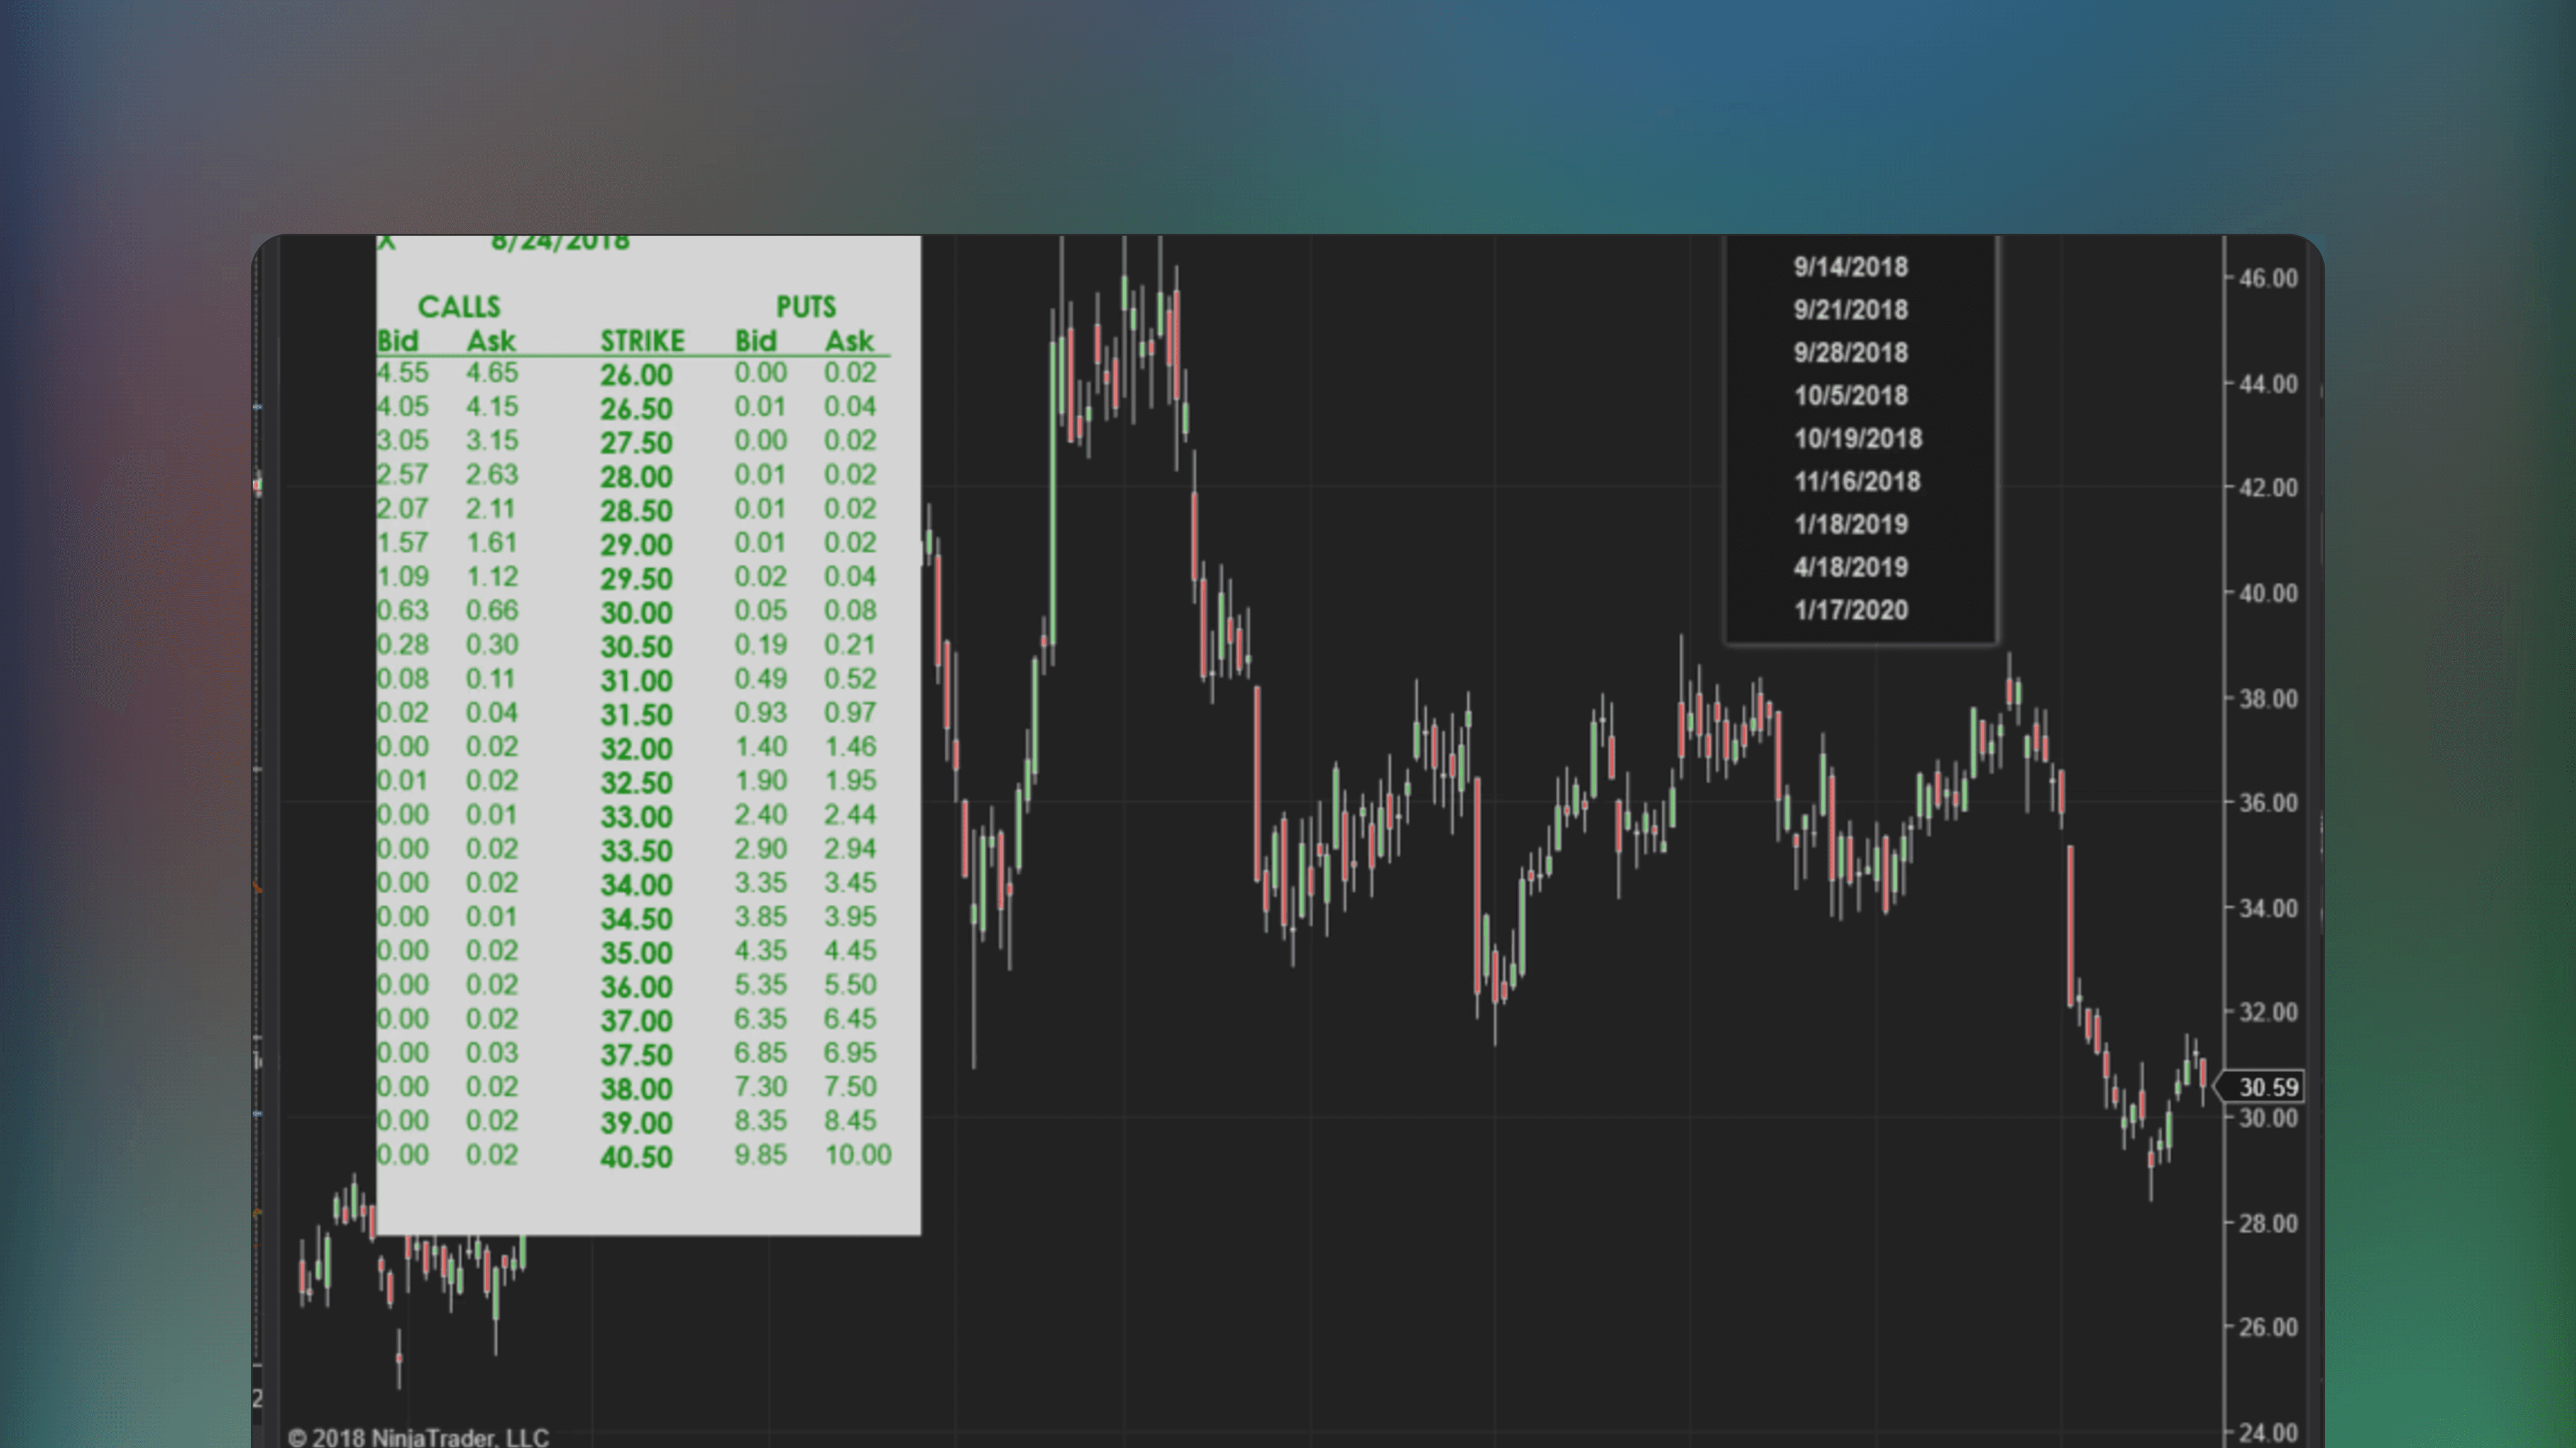
Options: Equity Options Chain Rendered on Chart Indicator
🔑
🌐
✅
🏅
Options: Equity Options Chain Rendered on Chart Indicator is a NinjaTrader indicator that integrates Yahoo’s options data on the chart directly. Pull up the options dashboard to aid your analysis whenever needed.
🤖
by NinjaTrader_AlanP
Free
NinjaTrader Indicator
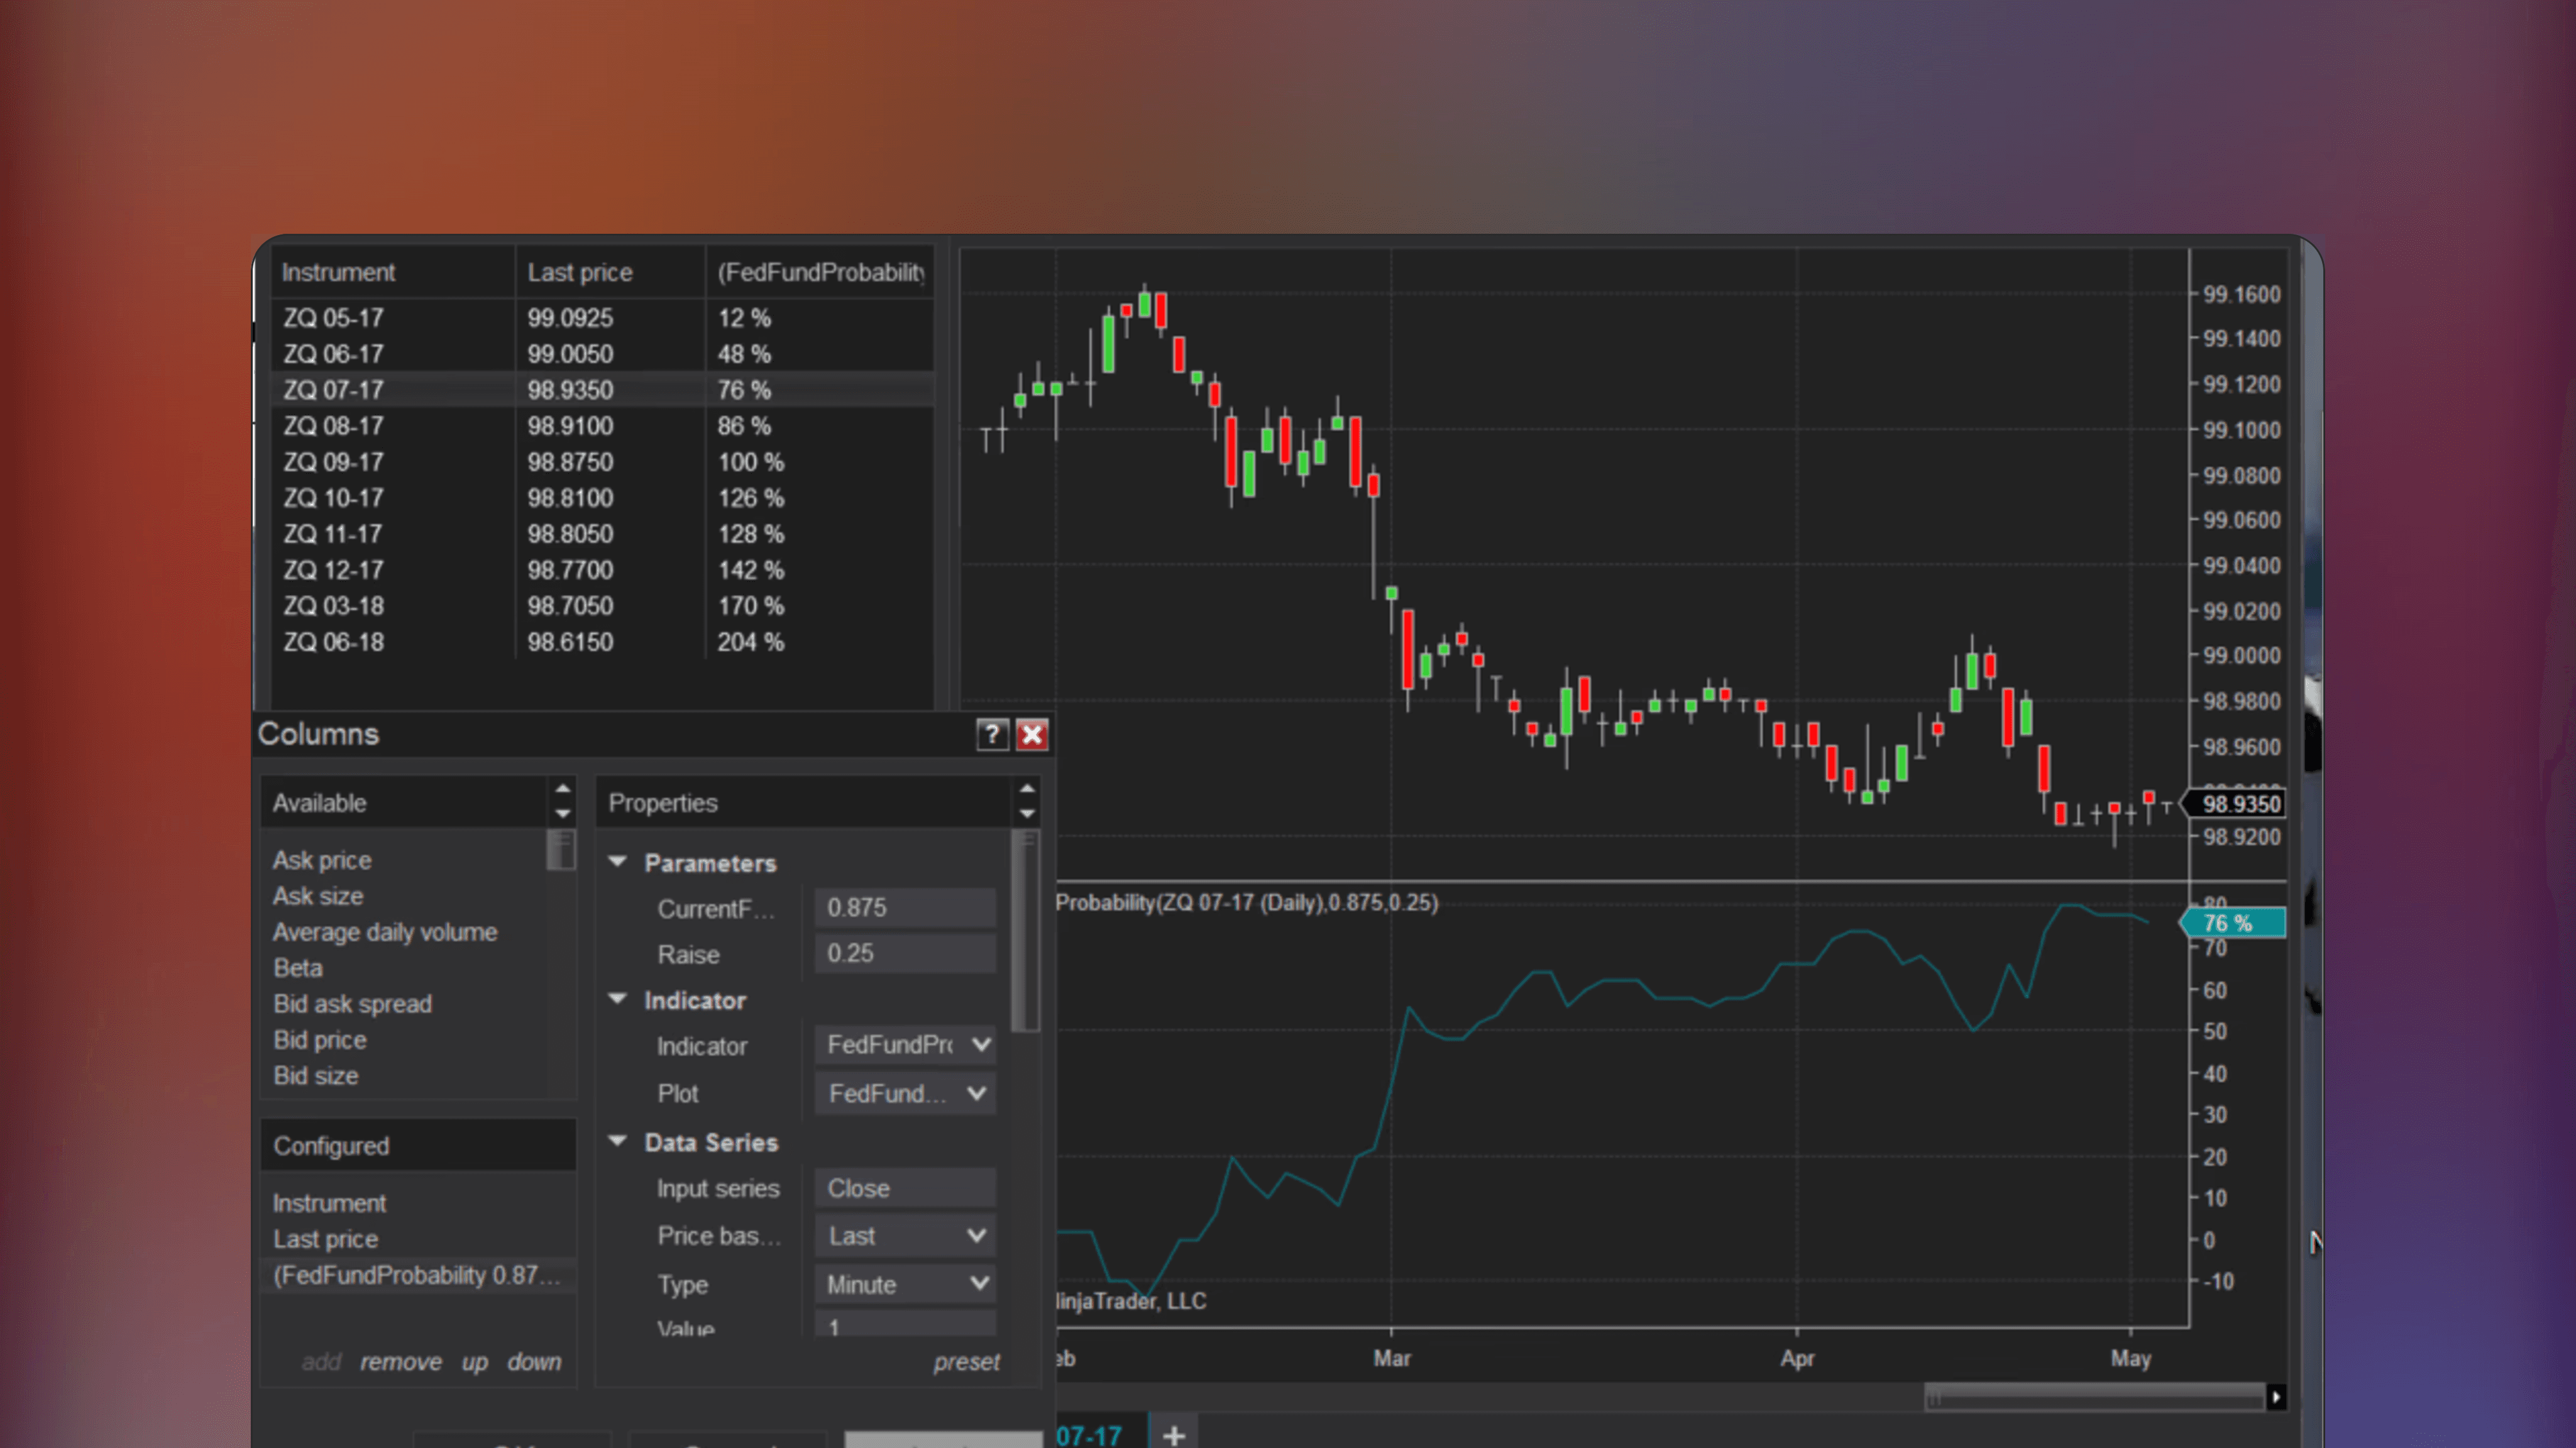
Fedfundprobability Indicator
🔑
🌐
✅
🏅
The Fedfundprobability Indicator is a NinjaTrader indicator that estimates the probability of specific FED interest rate hikes or cuts using FED futures contracts.

🤖
by NinjaTrader_Jim
Free
NinjaTrader Indicator
StockRatingSystem
🔑
🏅
StockRatingSystem is a NinjaTrader Indicator that ranks stocks using a mathematical formula based on Markos Katsanos' technical analysis methodology, as detailed in his June 2018 Stocks and Commodities article "A Technical Method for Rating Stocks".

🤖
by siroki
Free
NinjaTrader Indicator
Sessioncolors
🔑
🌐
✅
Sessioncolors is a NinjaTrader indicator that marks and customizes the start and end times of the Asia, London, and New York trading sessions on a price chart. Identify trading sessions using colored boxes with adjustable visuals for each.

🤖
by NinjaTrader_Jim
Free
NinjaTrader Indicator
Probability Distribution NT8
🔑
🏅
Probability Distribution NT8 is a NinjaTrader Indicator that calculates probability distributions for price data, based on statistical methods introduced by John F. Ehlers.
🤖
by NinjaTrader_Gaby
Free
NinjaTrader Indicator
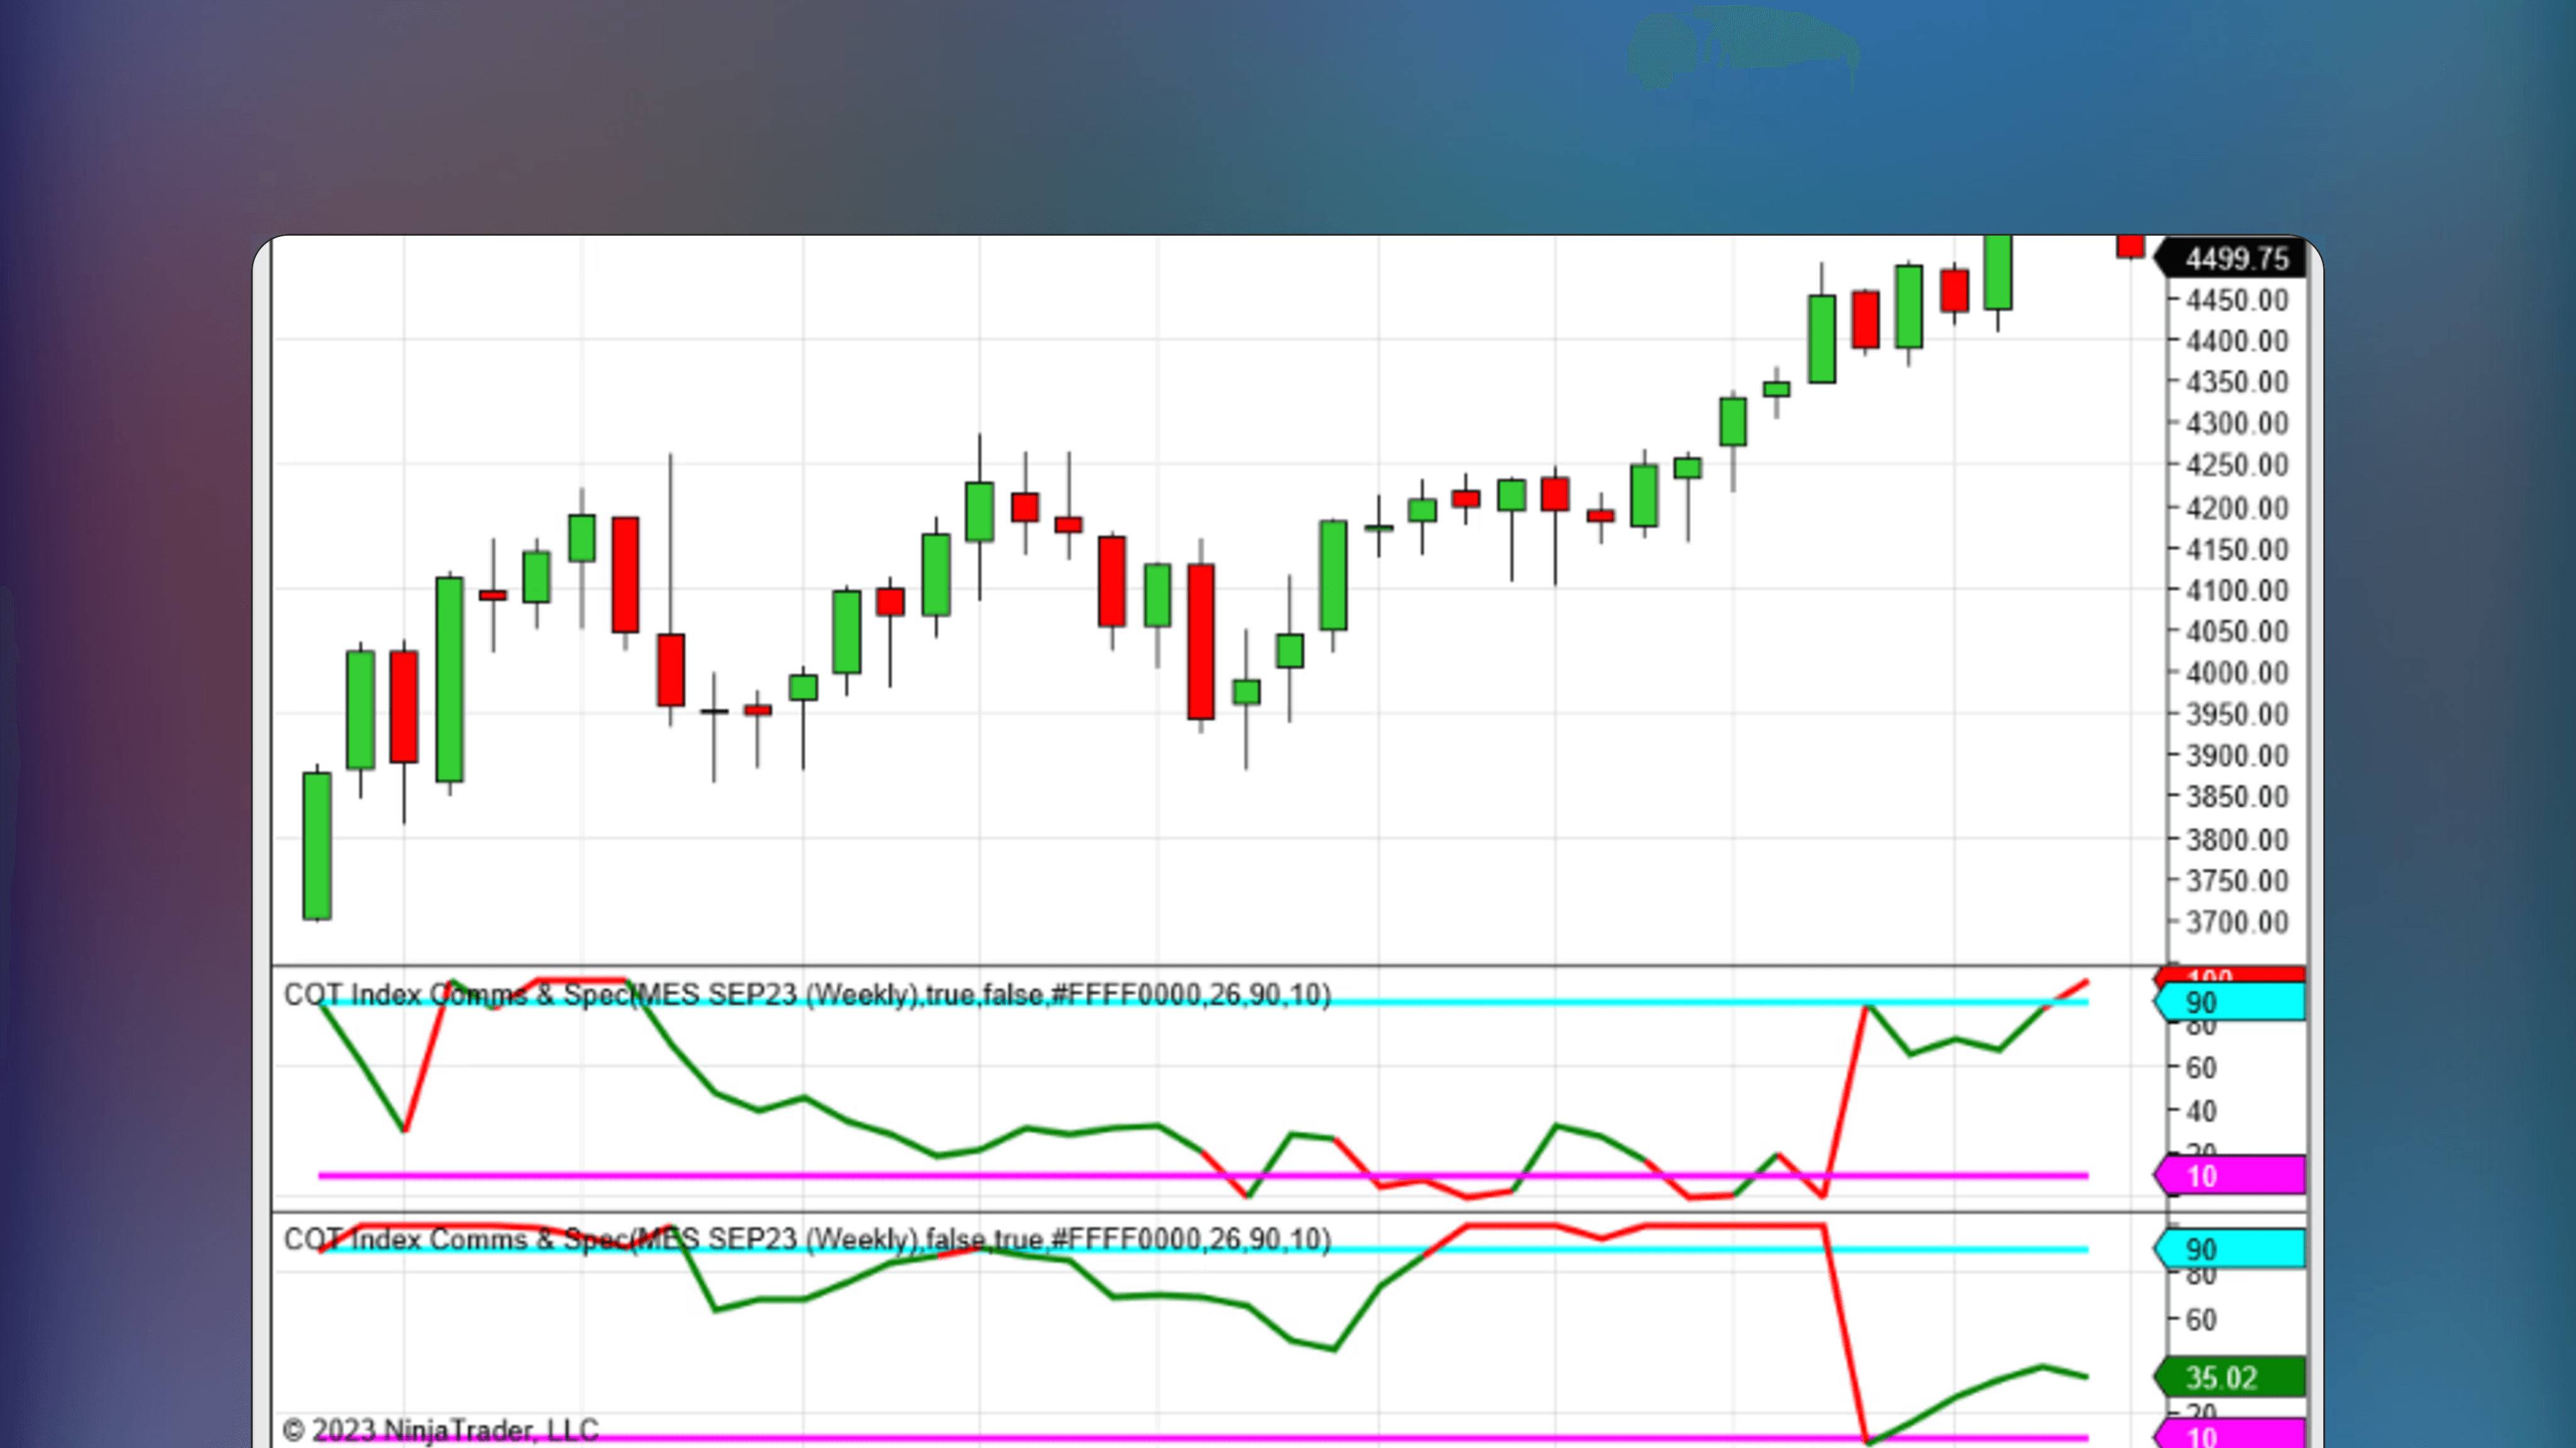
COT Index Comms & Spec NT8
🔑
🌐
✅
COT Index Comms & Spec NT8 is a NinjaTrader indicator that aggregates futures traders' positions using the COT index, providing data on positioning and sentiment.

🤖
by StevenL
Free
NinjaTrader Indicator
Futures Settlement Lines
🔑
🌐
Futures Settlement Lines is a NinjaTrader indicator that plots the last two futures contract settlement prices from the end of Regular Trading Hours, showing how current prices interact with these key closing levels.