


Read session directional flows at a glance
The histogram compares buying volume against selling volume for quick assessment of which side dominates the current session.
Simplify volume interpretation
Instead of analyzing raw volume bars, see the directional breakdown instantly. Buy-dominated or sell-dominated readings are clear.
Compare buyer and seller conviction
Watch for shifts in the buy/sell balance throughout the session. Early buy dominance often sets the directional tone for the day.
How does the indicator classify buy versus sell volume?
The indicator separates total session volume into directional categories, displaying them as a histogram. When buy volume significantly exceeds sell volume, the histogram shows bullish dominance. The reverse indicates bearish control.
What does balanced buy/sell volume suggest?
Balanced readings suggest equilibrium between buyers and sellers, often preceding a breakout. Early session buy dominance often sets the tone for the day while shifts throughout the session signal changing sentiment.
How do I spot distribution using volume composition?
If price rises while sell volume stays elevated, it warns of potential distribution where smart money sells into retail buying. This divergence between price direction and volume composition often precedes reversals.
⭐️
⭐️
⭐️
⭐️
⭐️


✍️
By Author
More by barabashkakvn


🔥
New Listings
Featured this week


🤖
Similar Listings
Traders also viewed
All


🤖
by baset84

Free
MetaTrader Indicator
Volume Profile
🔑
🌐
✅
Volume Profile is a MetaTrader indicator displaying transaction volume at various price levels within a selected timeframe using horizontal lines. Additionally, this indicator displays volume point of control (vPOC), but no value area.
🤖
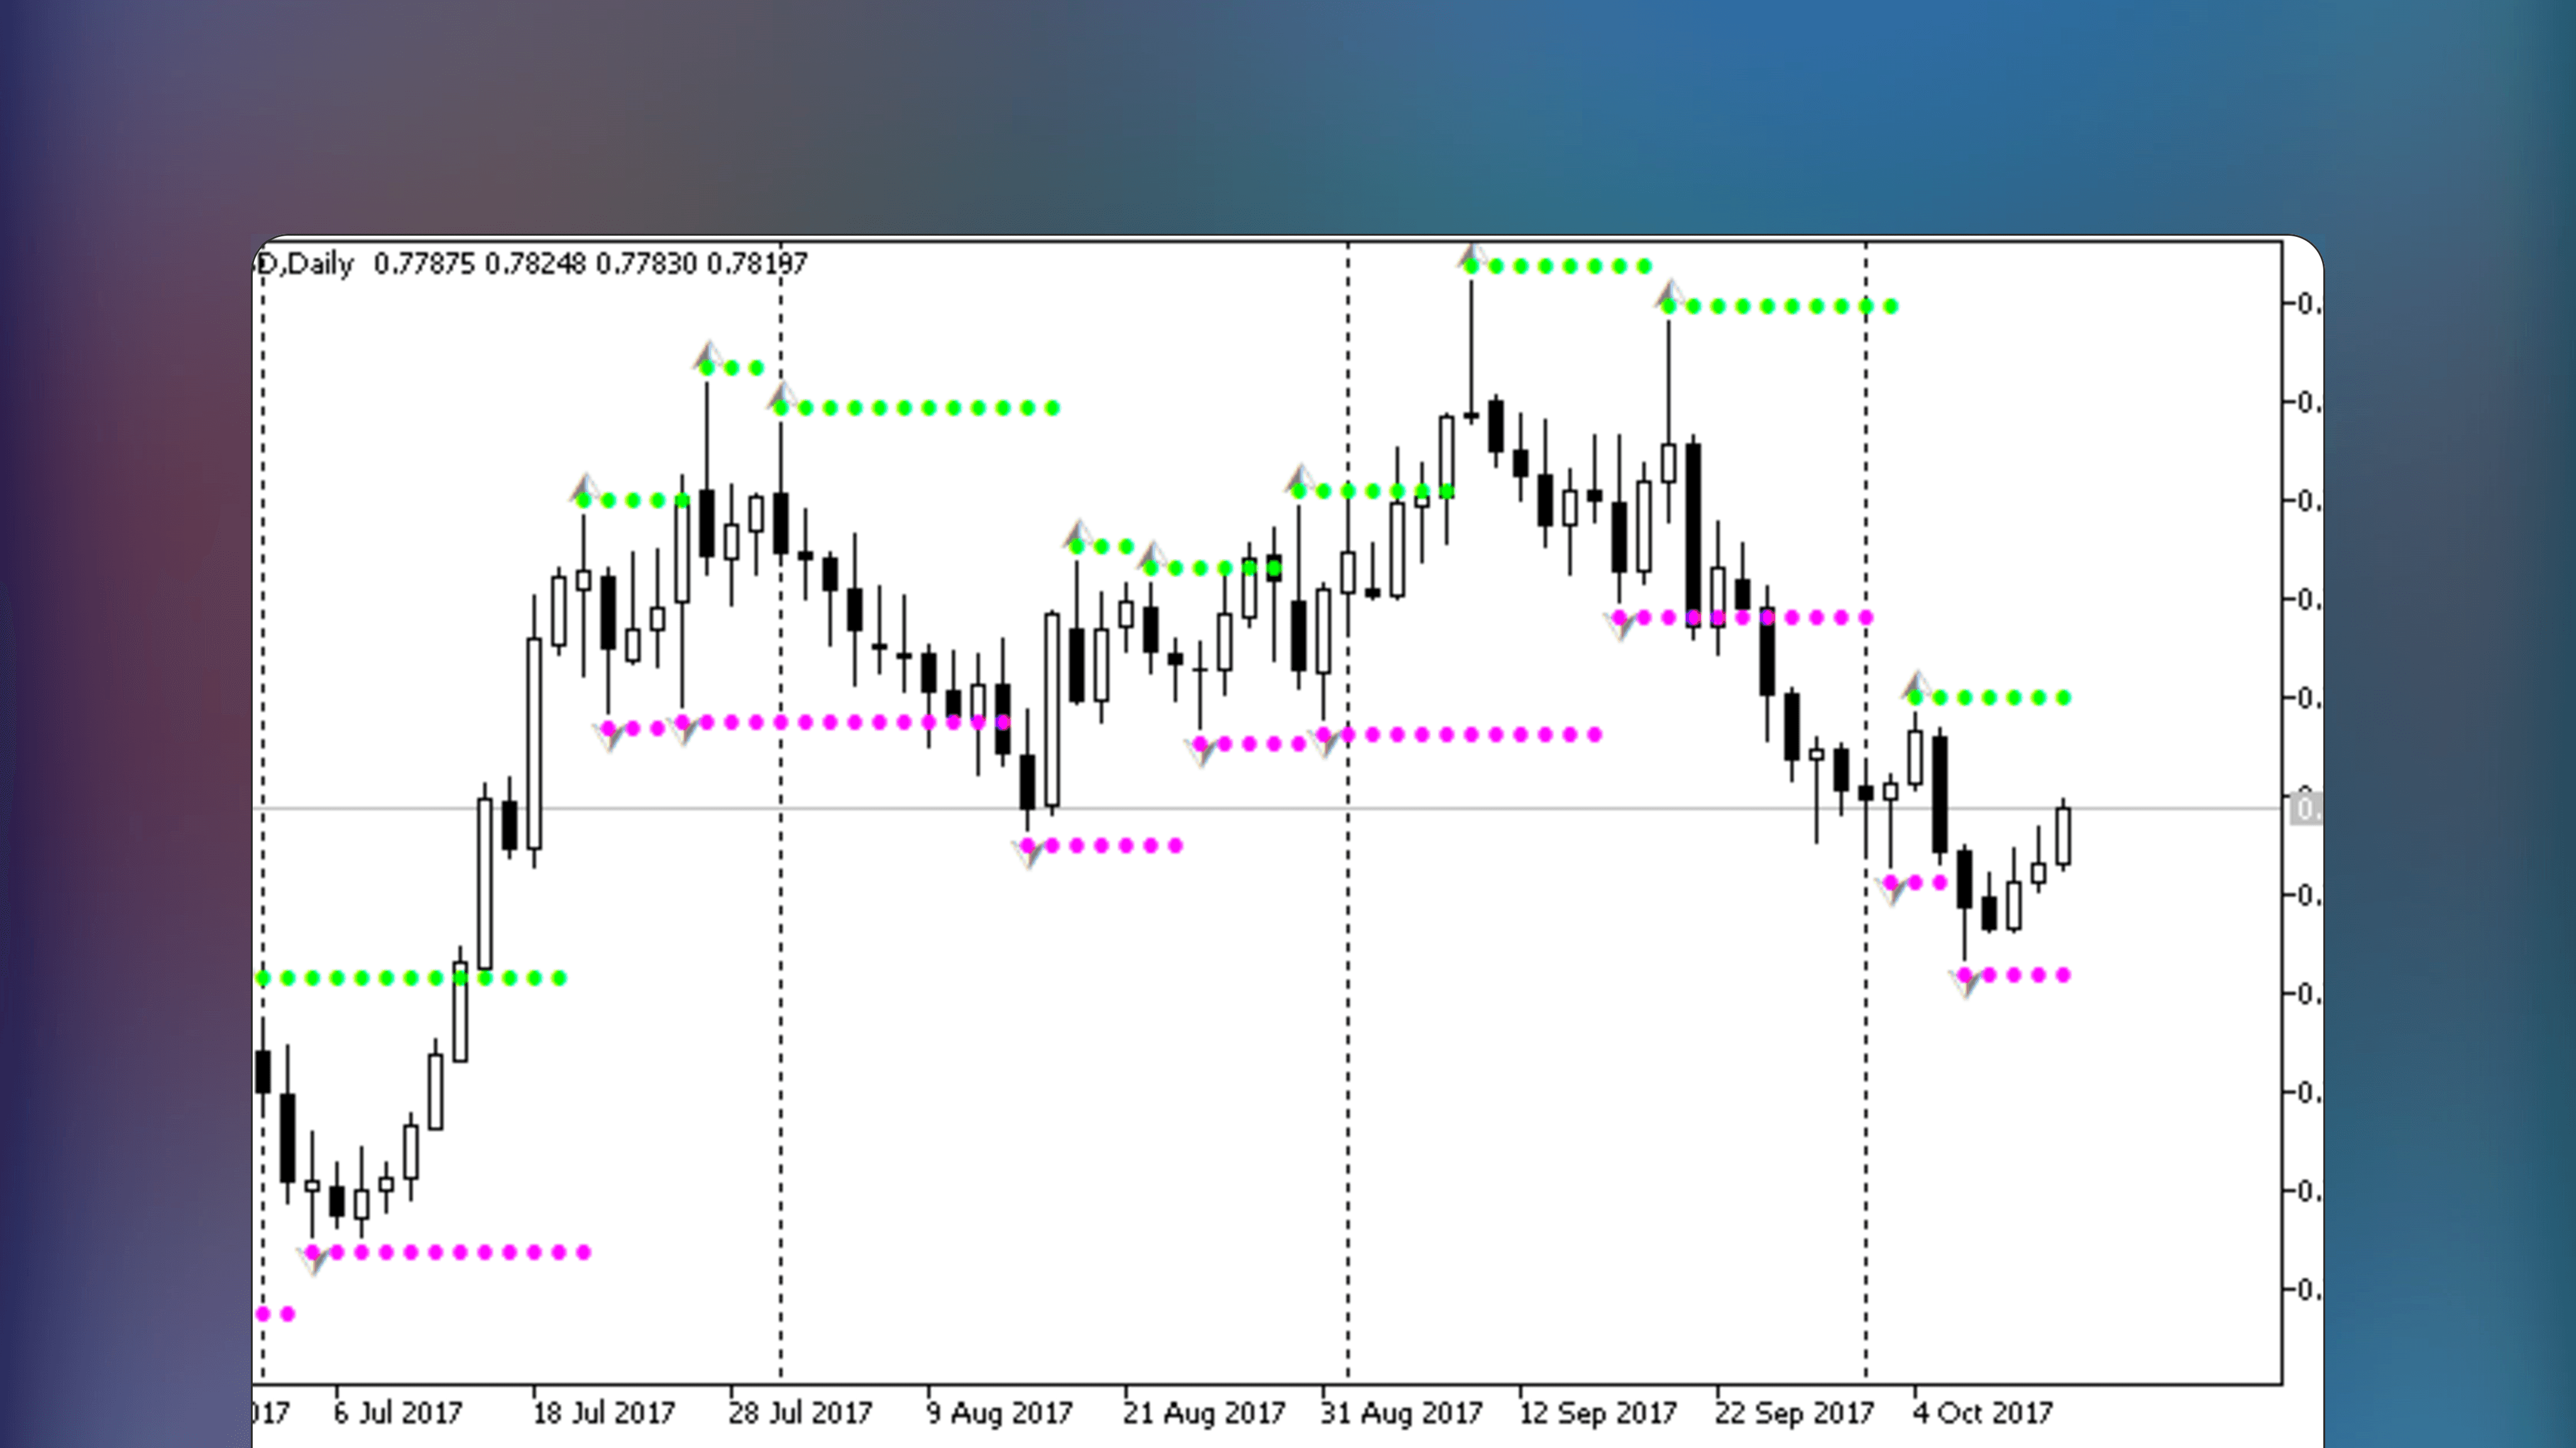
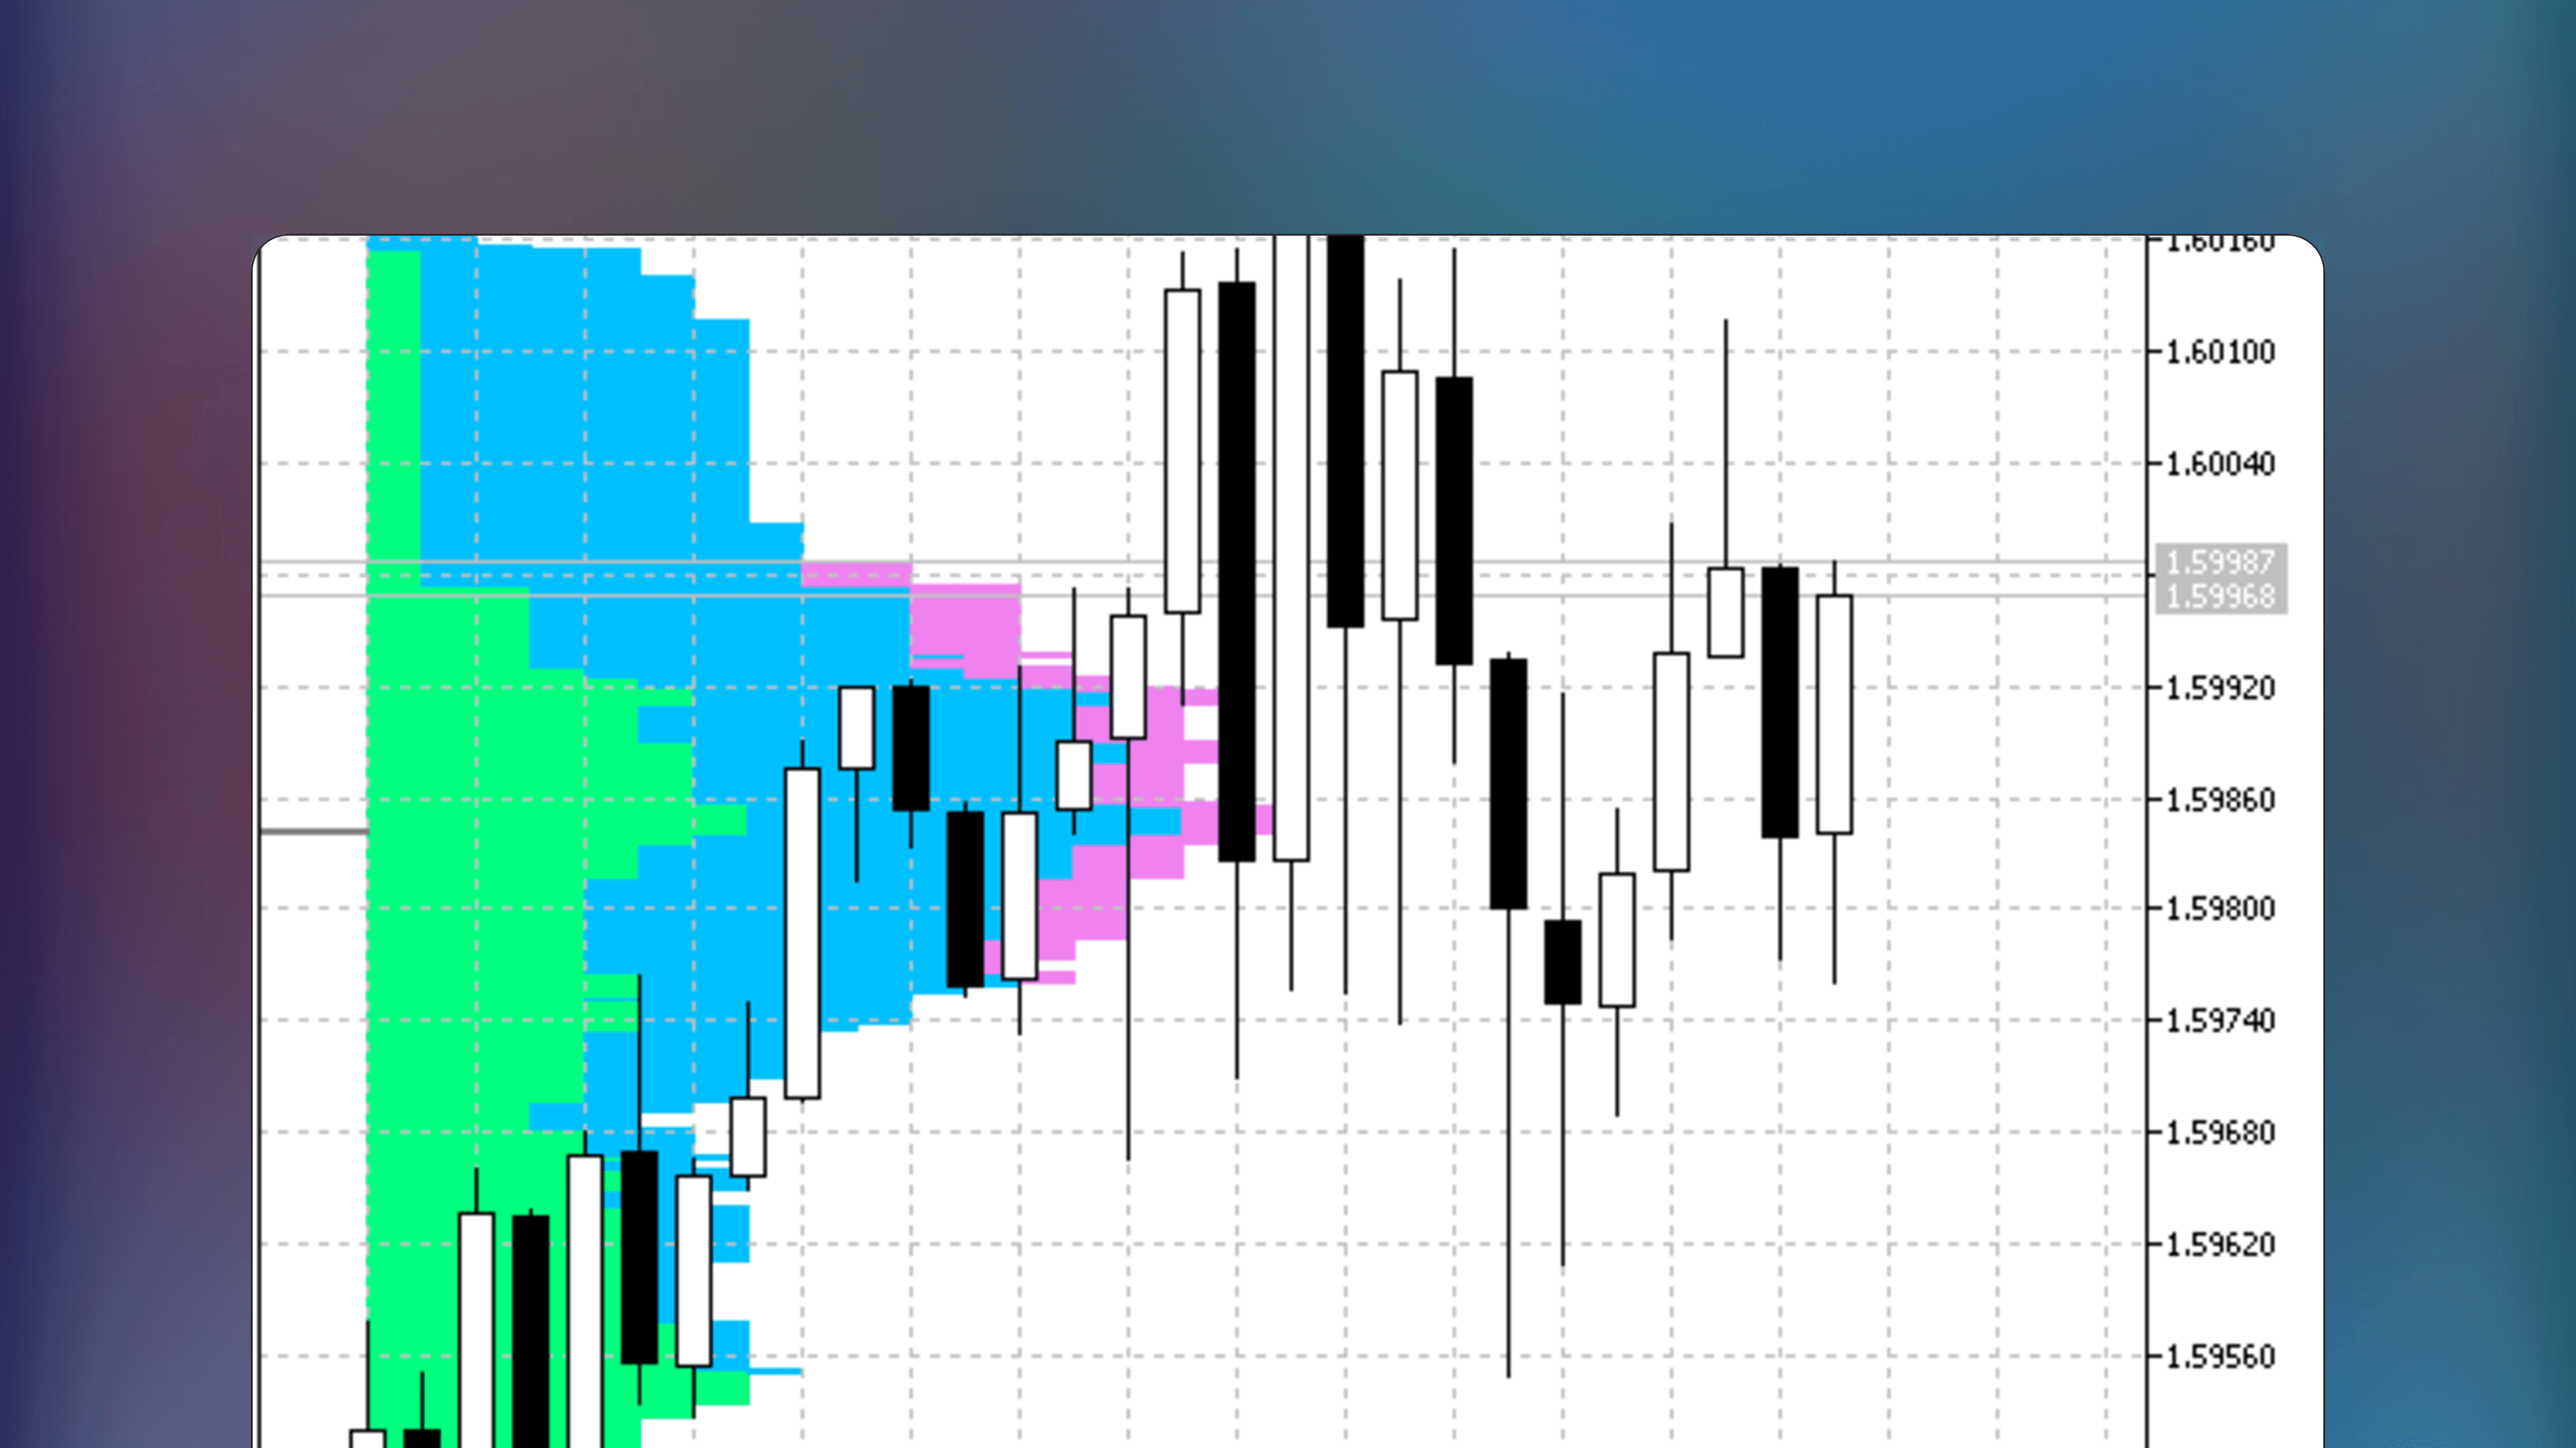
by Nikolay Kositsin
Free
MetaTrader Indicator
MarketProfile
🔑
🌐
✅
MarketProfile is a MetaTrader indicator that calculates the distribution of time at price for orderflow analysis. It displays statistical price distribution, control values and key price areas for daily trading sessions using color-coding. Compatible with multiple intraday timeframes according to author.

🤖
by joserrrm
Free
MetaTrader Indicator
VWAP Custom Position
🔑
🌐
✅
VWAP Custom Position is a MetaTrader indicator that calculates the Volume Weighted Average Price line with a user-defined, movable anchor point. Track trends and fair value dislocations using this VWAP indicator.

🤖
by dc2008
Free
MetaTrader Indicator
Histogram Bid and Ask prices
🔑
🌐
Histogram Bid and Ask prices is an Indicator for MetaTrader that plots a cumulative bid and ask price distributions and performs statistical analysis on High, Low, Open and Close prices. Optimized for smaller timeframes.

🤖
by fmic
Free
MetaTrader Indicator
Time Segmented Volume (TSV)
🔑
Time Segmented Volume (TSV) is a MetaTrader indicator that segments volume by time to reveal consistent buy or sell pressure. This indicator features customizable price selection, volume weighting options and displays both simple and exponential moving averages.

🤖
by mladen
Free
MetaTrader Indicator
Volume weighted awesome oscillator
🔑
🏅
Volume Weighted Awesome Oscillator is a free MetaTrader indicator that modifies Bill Williams’s Awesome Oscillator by using a volume-weighted moving average, combining price and volume analysis into one.

🤖
by scriptor
Free
MetaTrader Indicator
Volume_Accumulation
🔑
🌐
Volume_Accumulation is a MetaTrader Indicator that displays volume accumulation and distribution using a specialized formula. The indicator requires no inputs or settings, simply start using.
🤖
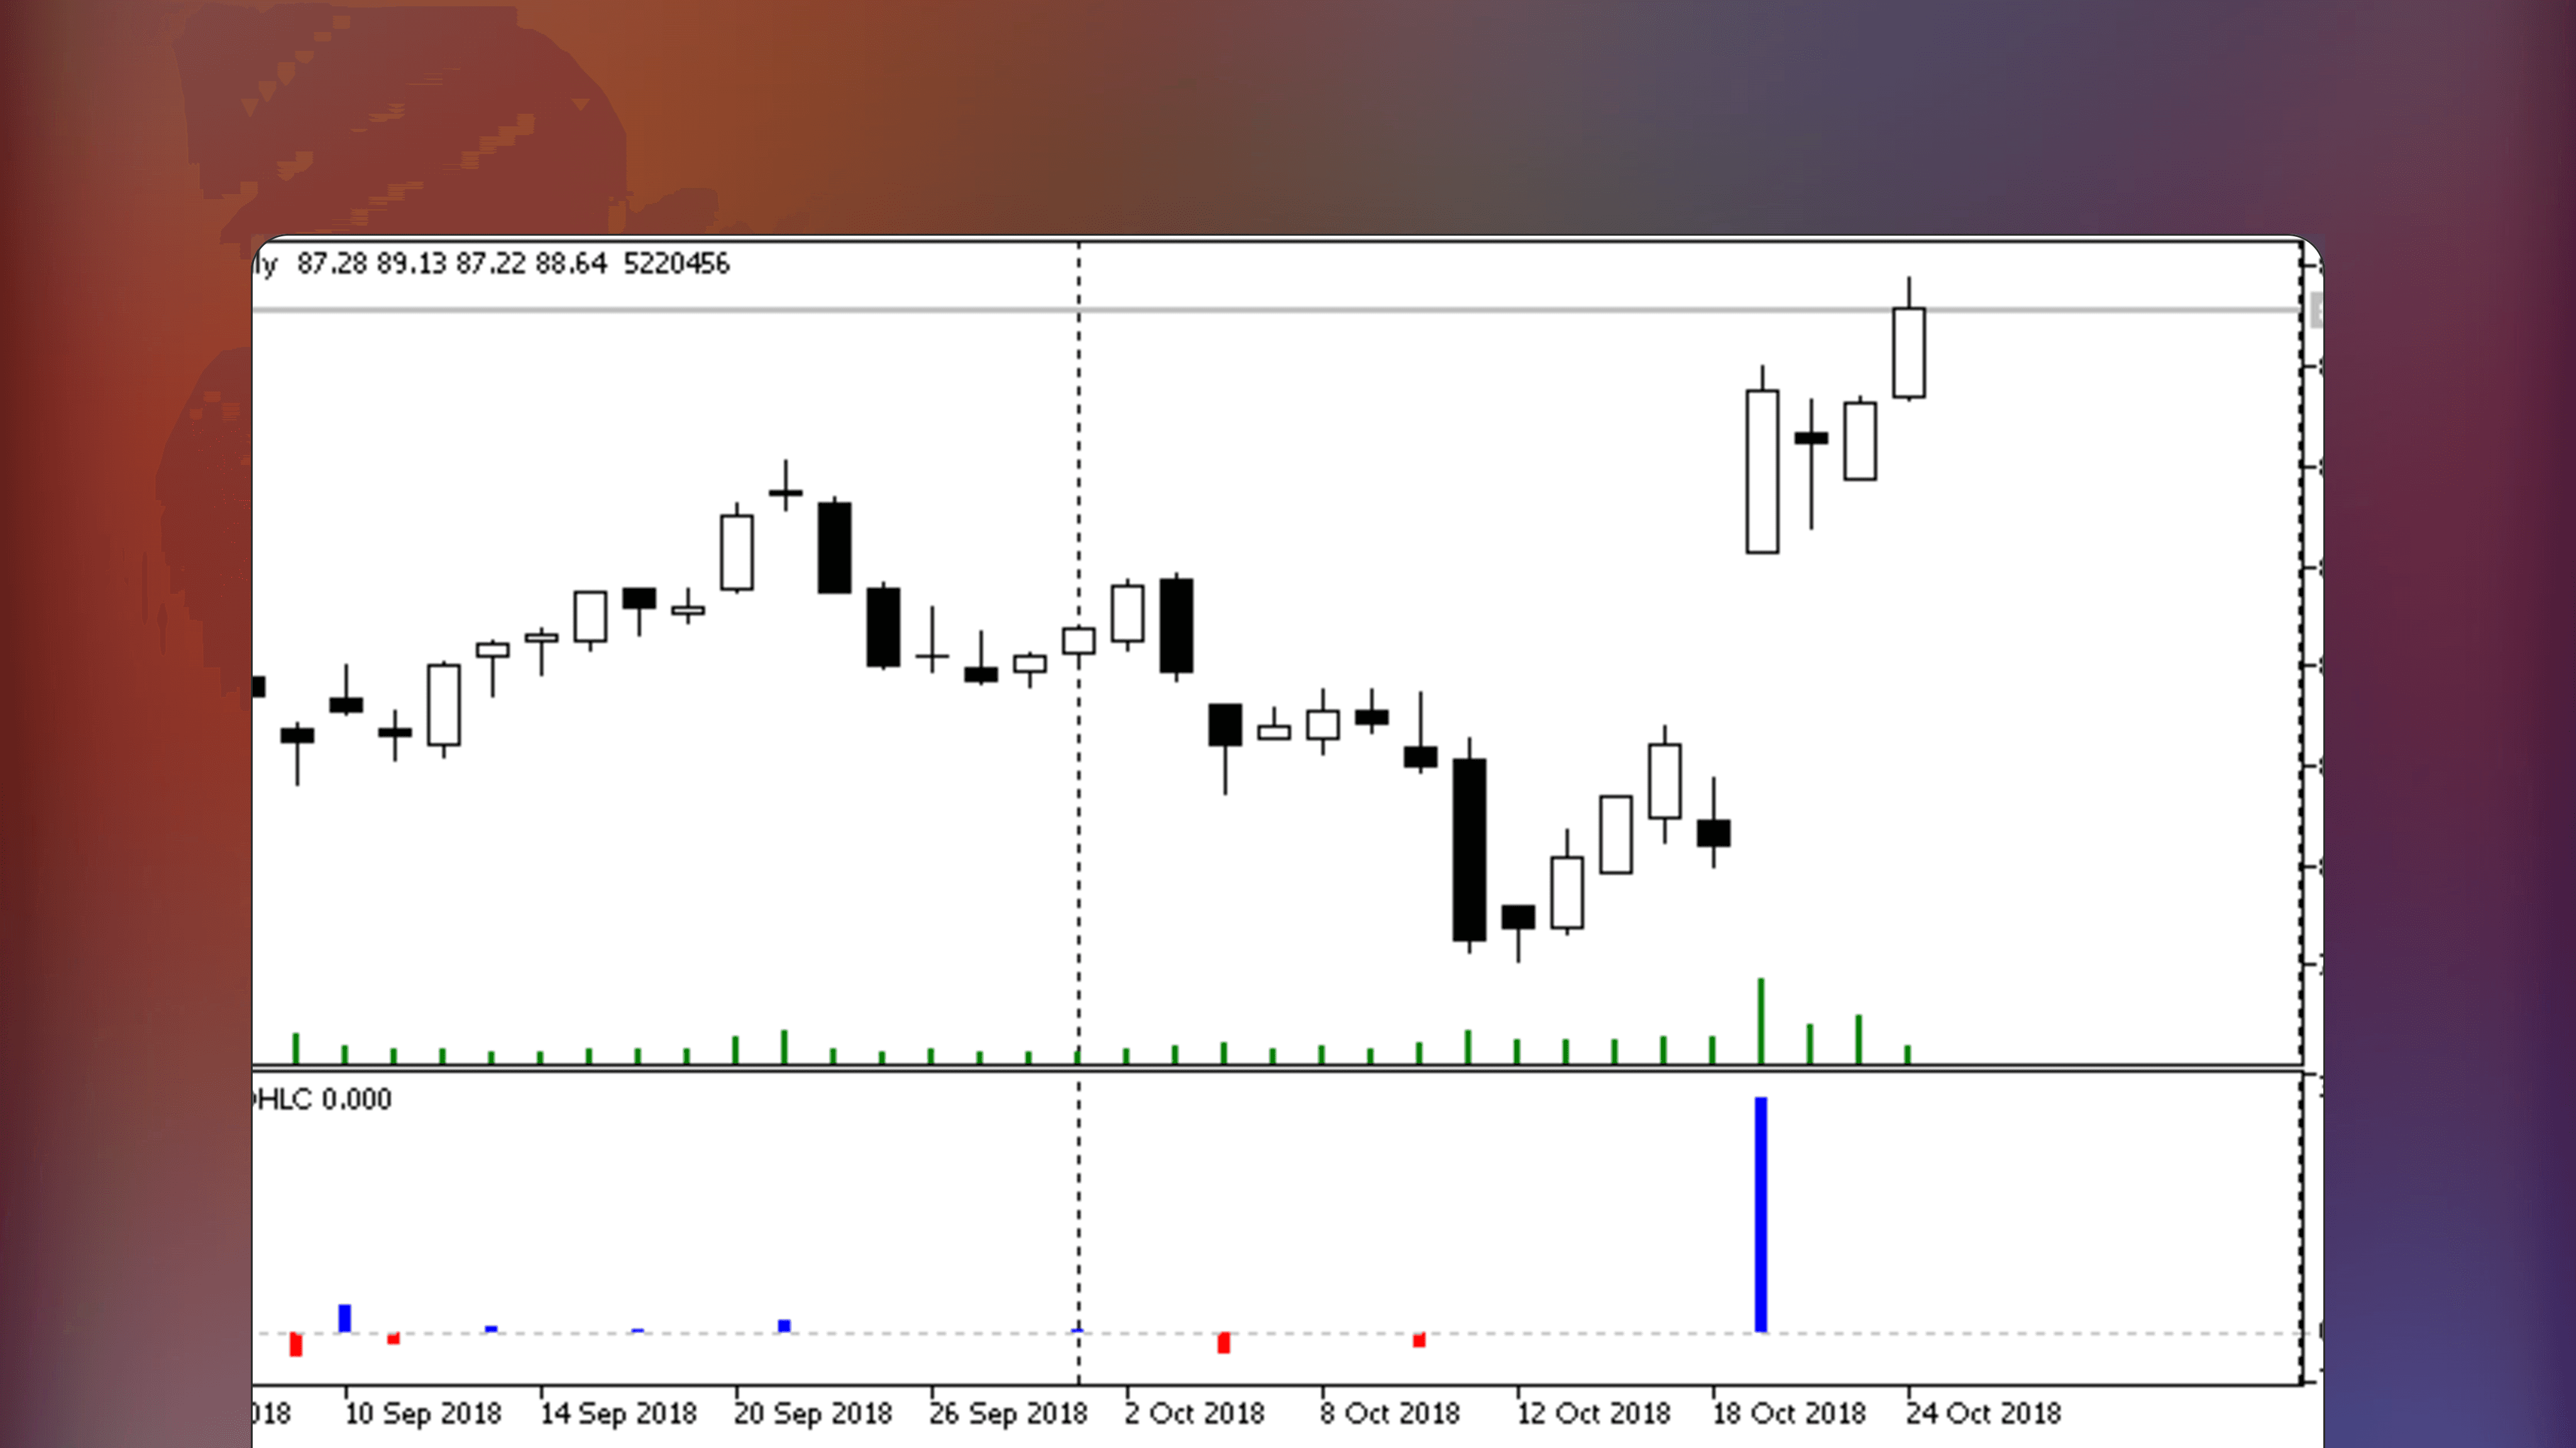
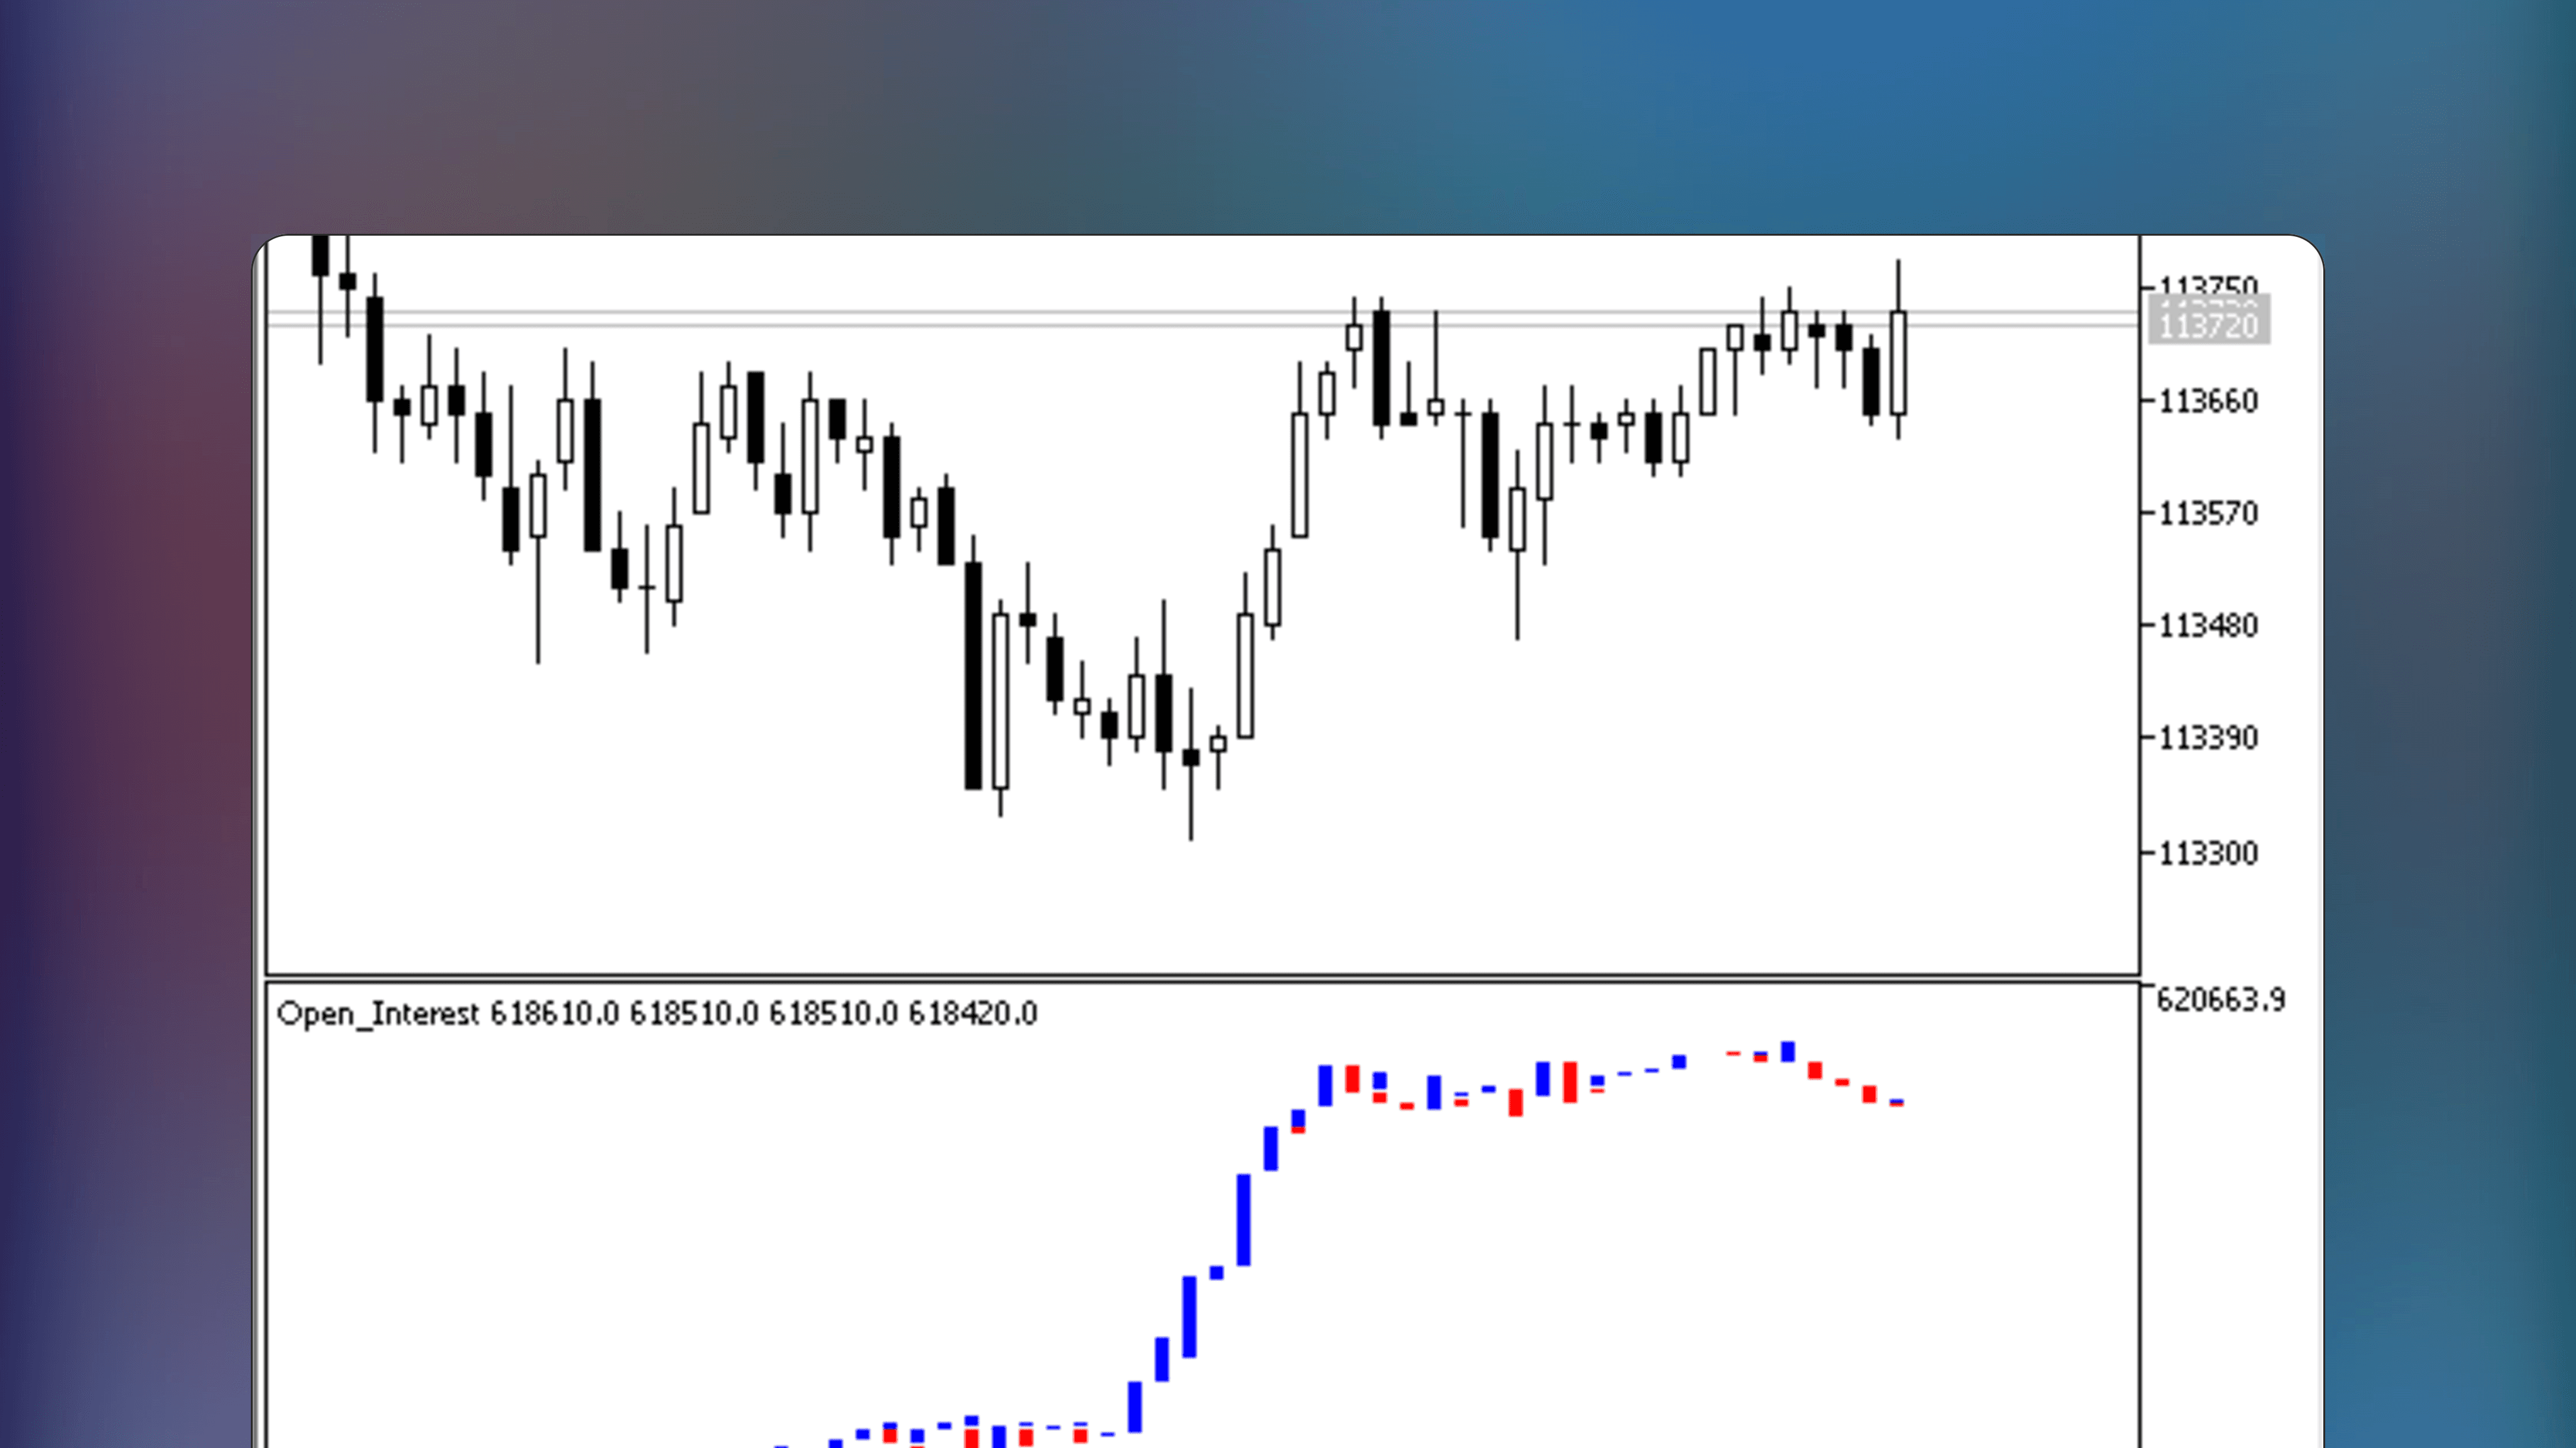
by barabashkakvn
Free
MetaTrader Indicator
Open Interest
🔑
🌐
✅
🏅
Open Interest is a MetaTrader indicator that monitors the net value of open positions using blue and red candle colors, corresponding to increases or decreases in open interest.