


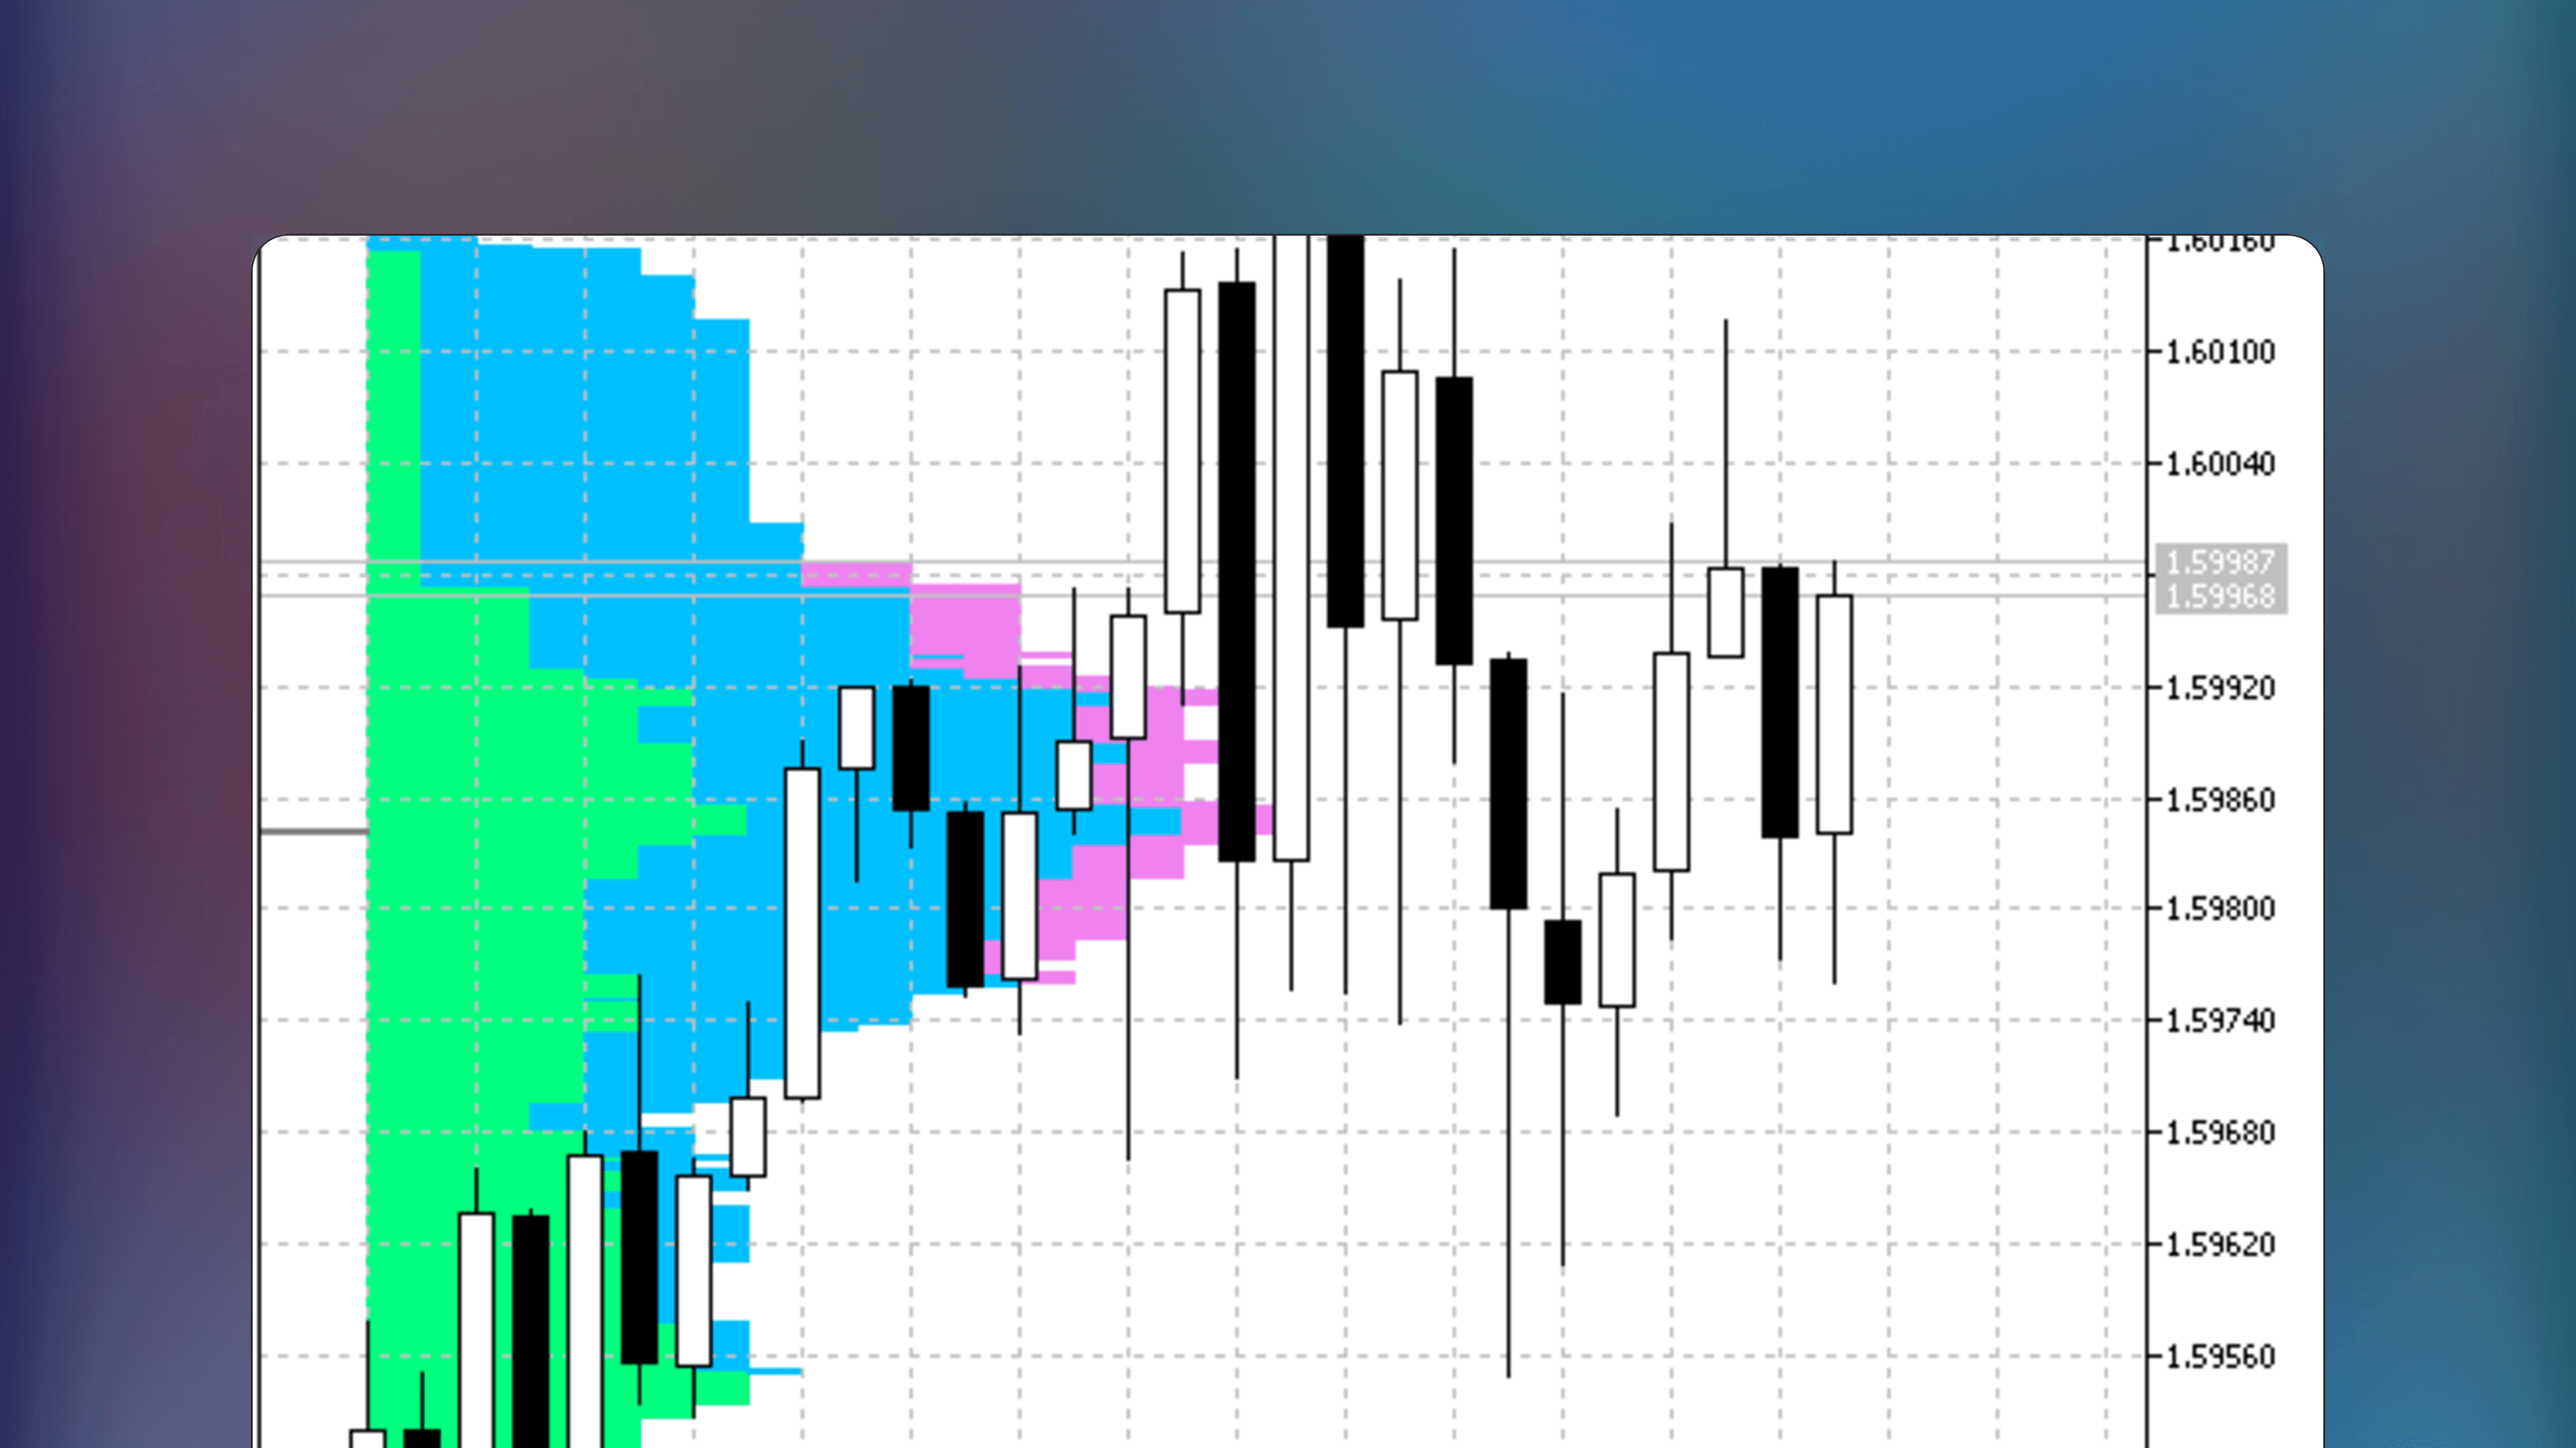
Find Key Levels Using Value Area and POC
The volume Point of Control marks where the most trading occurred. The Value Area contains roughly 70% of volume. Both serve as reference points for trade planning.
Read Auction Completion States
A balanced profile suggests a finished auction where price found acceptance. An imbalanced profile signals unfinished business that may draw price back.
Trade Using Auction Market Concepts
Price tends to revisit the POC because it represents peak agreement. Low-volume zones often get swept quickly while high-volume areas slow price down.
What does the Volume Point of Control tell me about price behavior?
The vPOC marks the price level with the highest traded volume in your selected range. Price often gravitates toward this level because it represents the point of greatest agreement between buyers and sellers during that period.
How do I choose the right range for my Volume Profile analysis?
Place two vertical lines at the start and end of the period you want to analyze. This could be a specific session, a consolidation zone, or a trending leg. Flexible range selection lets you study whatever price structure matters most to you.
Why do some price levels have almost no volume while others show heavy activity?
Low-volume areas are prices the market moved through quickly with minimal participation. These zones often get swept through fast when revisited. High-volume nodes attract price because many traders have positions anchored there.
⭐️
⭐️
⭐️
⭐️
⭐️


🔥
New Listings
Featured this week


🤖
Similar Listings
Traders also viewed
All

🤖
by Nikolay Kositsin

Free
MetaTrader Indicator
MarketProfile
🔑
🌐
✅
MarketProfile is a MetaTrader indicator that calculates the distribution of time at price for orderflow analysis. It displays statistical price distribution, control values and key price areas for daily trading sessions using color-coding. Compatible with multiple intraday timeframes according to author.

🤖
by joserrrm
Free
MetaTrader Indicator
VWAP Custom Position
🔑
🌐
✅
VWAP Custom Position is a MetaTrader indicator that calculates the Volume Weighted Average Price line with a user-defined, movable anchor point. Track trends and fair value dislocations using this VWAP indicator.

🤖
by dc2008
Free
MetaTrader Indicator
Histogram Bid and Ask prices
🔑
🌐
Histogram Bid and Ask prices is an Indicator for MetaTrader that plots a cumulative bid and ask price distributions and performs statistical analysis on High, Low, Open and Close prices. Optimized for smaller timeframes.

🤖
by fmic
Free
MetaTrader Indicator
Time Segmented Volume (TSV)
🔑
Time Segmented Volume (TSV) is a MetaTrader indicator that segments volume by time to reveal consistent buy or sell pressure. This indicator features customizable price selection, volume weighting options and displays both simple and exponential moving averages.

🤖
by mladen
Free
MetaTrader Indicator
Volume weighted awesome oscillator
🔑
🏅
Volume Weighted Awesome Oscillator is a free MetaTrader indicator that modifies Bill Williams’s Awesome Oscillator by using a volume-weighted moving average, combining price and volume analysis into one.

🤖
by scriptor
Free
MetaTrader Indicator
Volume_Accumulation
🔑
🌐
Volume_Accumulation is a MetaTrader Indicator that displays volume accumulation and distribution using a specialized formula. The indicator requires no inputs or settings, simply start using.

🤖
by barabashkakvn
Free
MetaTrader Indicator
Session Buy Sell Orders Volume
🔑
🌐
✅
🏅
Session Buy Sell Orders Volume is a free MetaTrader indicator that displays a histogram of total buy and sell order volumes for an easy identification of the dominant market side.
🤖
by barabashkakvn
Free
MetaTrader Indicator
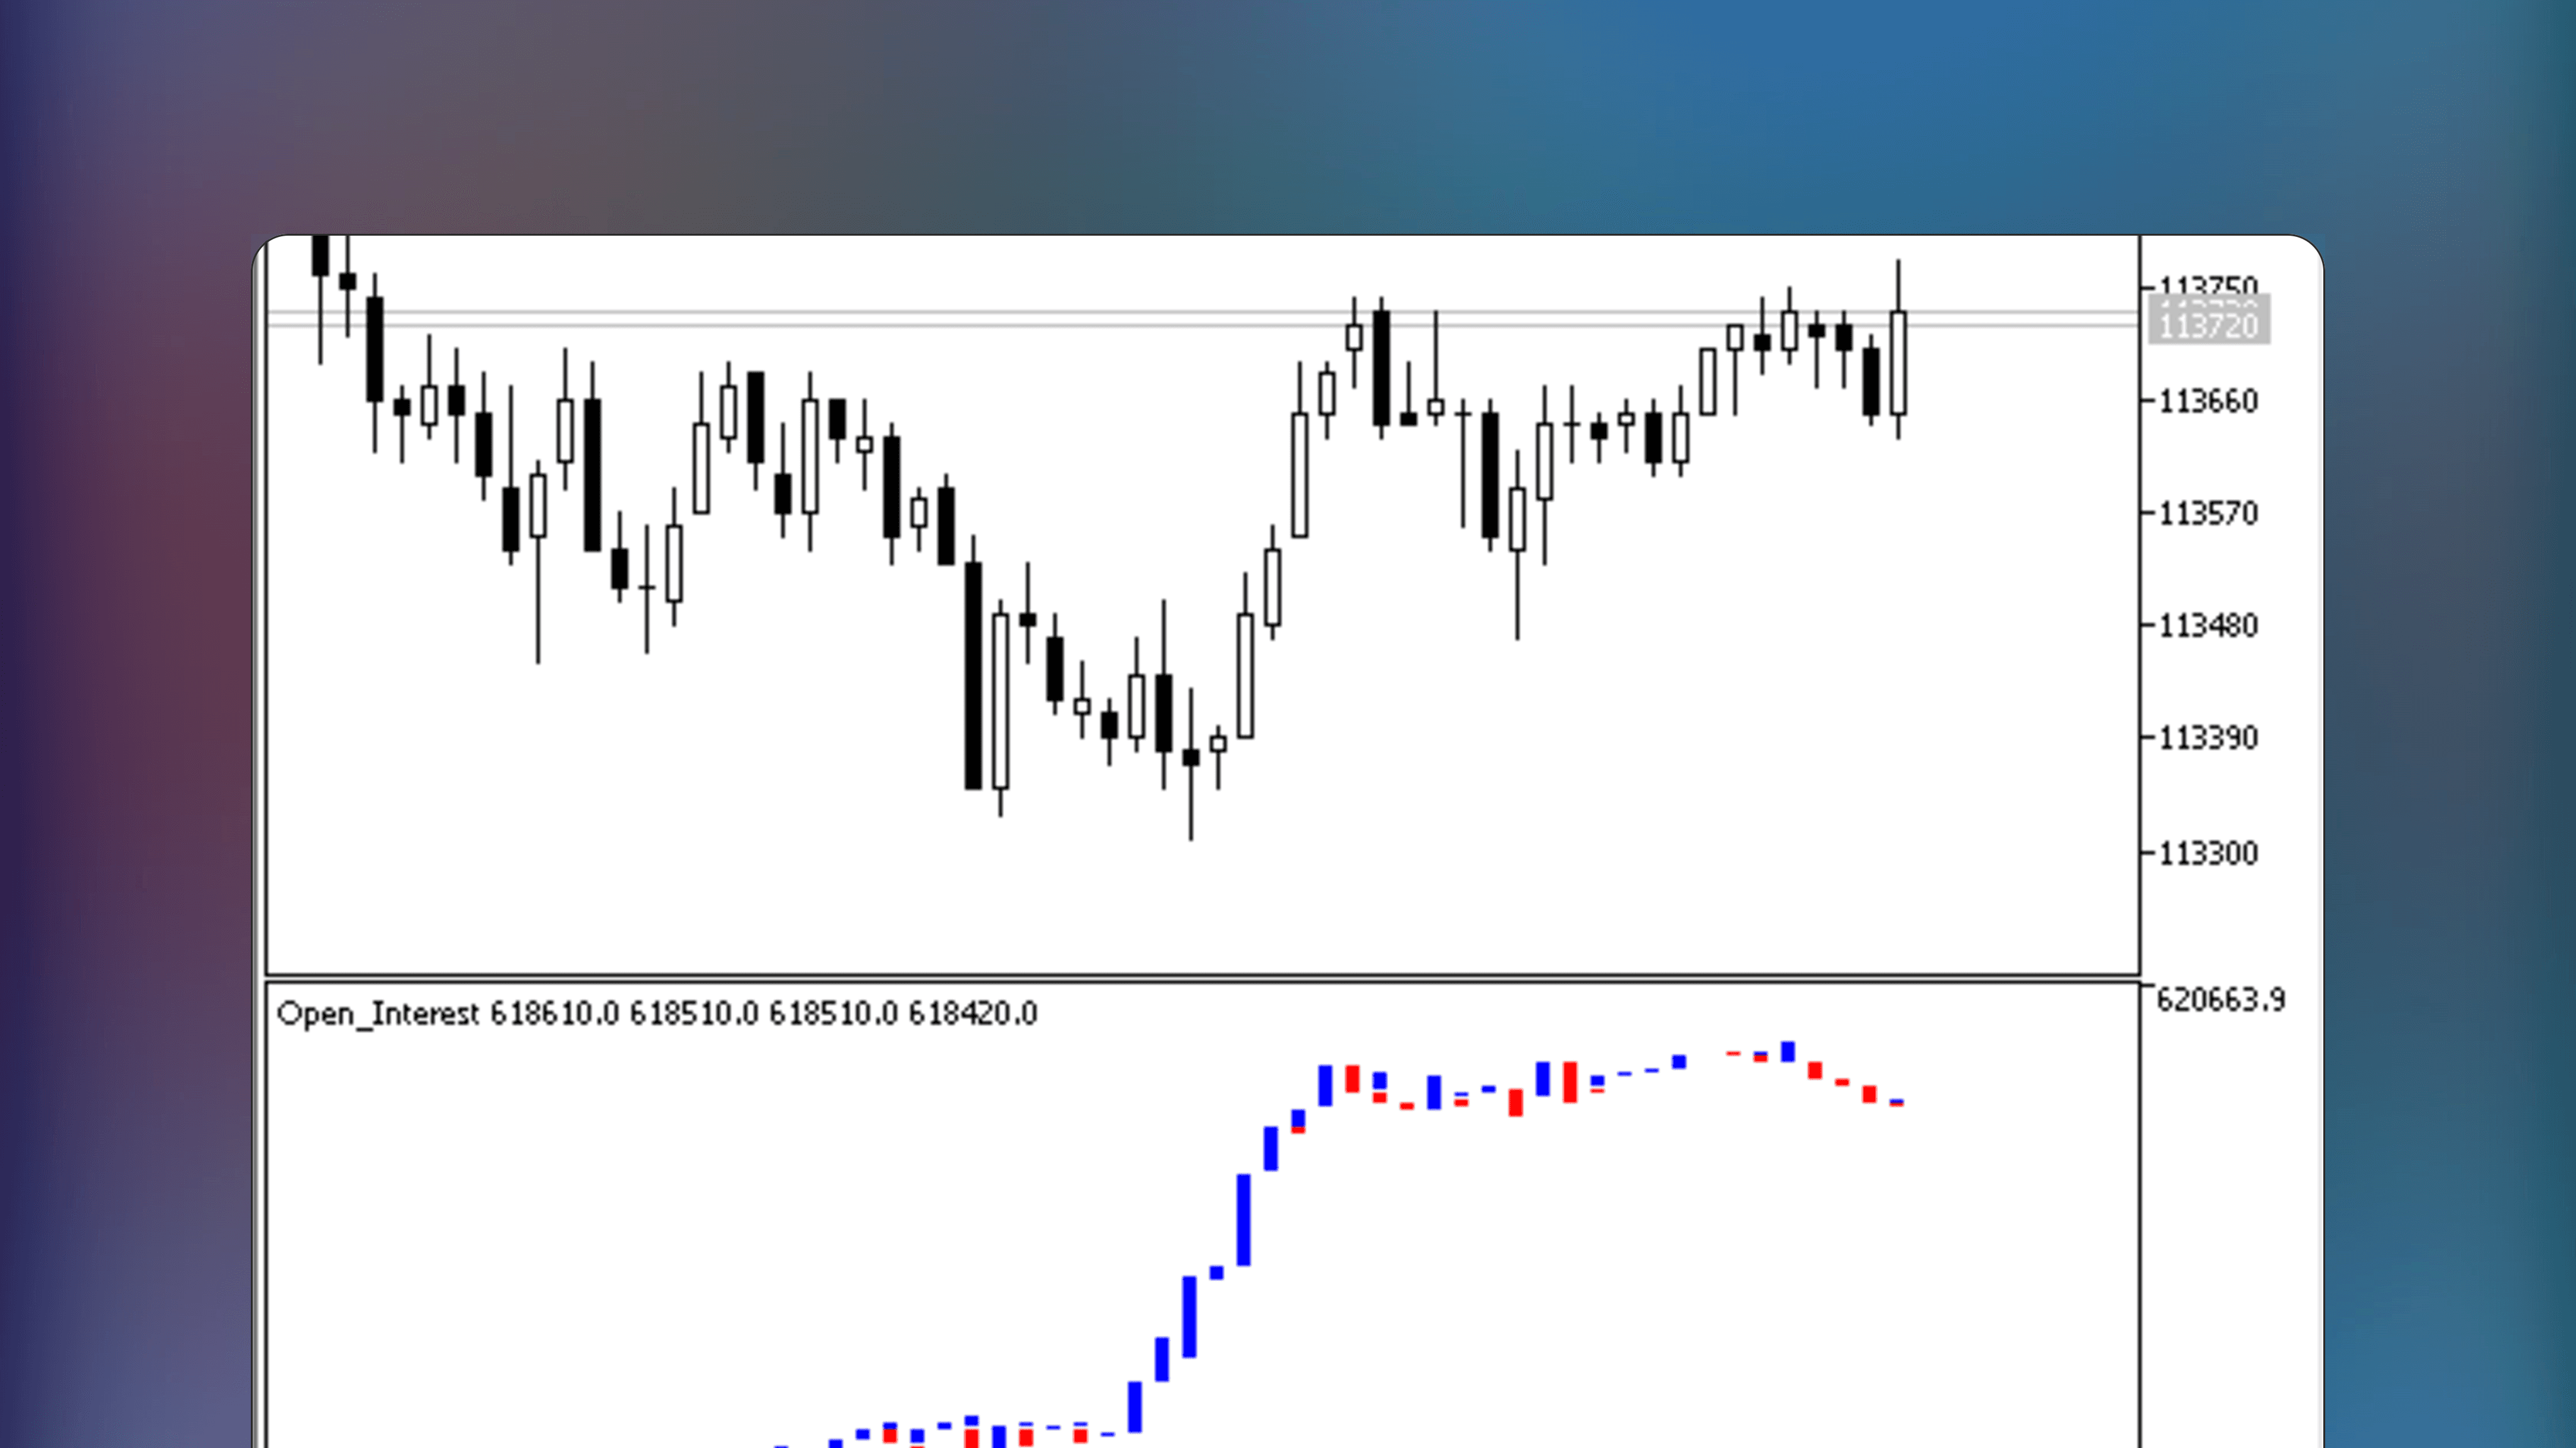
Open Interest
🔑
🌐
✅
🏅
Open Interest is a MetaTrader indicator that monitors the net value of open positions using blue and red candle colors, corresponding to increases or decreases in open interest.