From TradersList Editors

From TradersList Editors

Evaluate market sentiment and gauge potential price movements with this reliable volume indicator, highlighting open position changes.

Evaluate market sentiment and gauge potential price movements with this reliable volume indicator, highlighting open position changes.

MetaTrader Indicator

MetaTrader Indicator

Open Interest Indicator: Track Total Open Position Volume Changes for MetaTrader

Open Interest Indicator: Track Total Open Position Volume Changes for MetaTrader

MetaTrader trading chart displaying the Open Interest volume indicator with blue bars signifying growth and red bars indicating a decline in open interest

by barabashkakvn on MetaTrader

MetaTrader trading chart displaying the Open Interest volume indicator with blue bars signifying growth and red bars indicating a decline in open interest

by barabashkakvn on MetaTrader

🤖

🤖

Open Interest

Open Interest

Open Interest is a MetaTrader indicator that monitors the net value of open positions using blue and red candle colors, corresponding to increases or decreases in open interest.

Open Interest is a MetaTrader indicator that monitors the net value of open positions using blue and red candle colors, corresponding to increases or decreases in open interest.

Get on MetaTrader

This indicator is available on MetaTrader charting platform. Signing up for a free account and downloading MetaTrader software is required.

Get on MetaTrader

This indicator is available on MetaTrader charting platform. Signing up for a free account and downloading MetaTrader software is required.

🔑

Open Source

Listing has publically available source code that can be audited and modified as needed.

🔑

Open Source

Listing has publically available source code that can be audited and modified as needed.

💸

Free Access

All features of this listing are fully free to use with no pricing tiers. Simply start using.

💸

Free Access

All features of this listing are fully free to use with no pricing tiers. Simply start using.

🥇

Trusted Publisher

Publisher of this listing is well recognized in social channels and receives overwhelmingly positive feedback.

🥇

Trusted Publisher

Publisher of this listing is well recognized in social channels and receives overwhelmingly positive feedback.

Robust Theory

Concepts and theories mentioned in listing are based on generally approved and well established notions.

Robust Theory

Concepts and theories mentioned in listing are based on generally approved and well established notions.

🌐

Popular Topic

Concepts and theories mentioned in listing are popular topics in web search

🌐

Popular Topic

Concepts and theories mentioned in listing are popular topics in web search

Published by barabashkakvn on MetaTrader

Published by barabashkakvn on MetaTrader

Tracking Net Position Changes

Open interest represents the total number of outstanding derivative contracts that have not been settled. This indicator monitors changes in open interest and displays them as colored candles - blue when open interest increases and red when it decreases - giving traders a visual measure of market participation and commitment.

Rising Open Interest and Trend Strength

When price moves in one direction and open interest rises simultaneously, it confirms that new money is entering the market in support of the trend. A rally with increasing open interest signals fresh long positions being established, strengthening the bullish case. Declining open interest during a rally suggests short covering instead.

Falling Open Interest as a Warning

Decreasing open interest during a trend indicates that traders are closing positions rather than opening new ones. This liquidation pattern often precedes trend exhaustion. For example, if price keeps rising but open interest drops, the advance is losing participants and may be nearing a reversal point.

Combining With Price Action

The most reliable signals come from combining open interest direction with price direction. Bullish convergence occurs when both price and open interest rise together. Bearish divergence occurs when price rises but open interest falls. These combinations provide a deeper understanding of the conviction behind price movements.

Get insights into net value of open trades

Get insights into net value of open trades

Open Interest tracks changes in outstanding derivative contracts using color-coded candles. Blue indicates rising open interest while red shows declining interest, providing visual insight into whether new money is entering or exiting the market.

Open Interest tracks changes in outstanding derivative contracts using color-coded candles. Blue indicates rising open interest while red shows declining interest, providing visual insight into whether new money is entering or exiting the market.

Monitor market participation levels

Rising open interest during a price move confirms new positions are being established, suggesting conviction behind the trend.

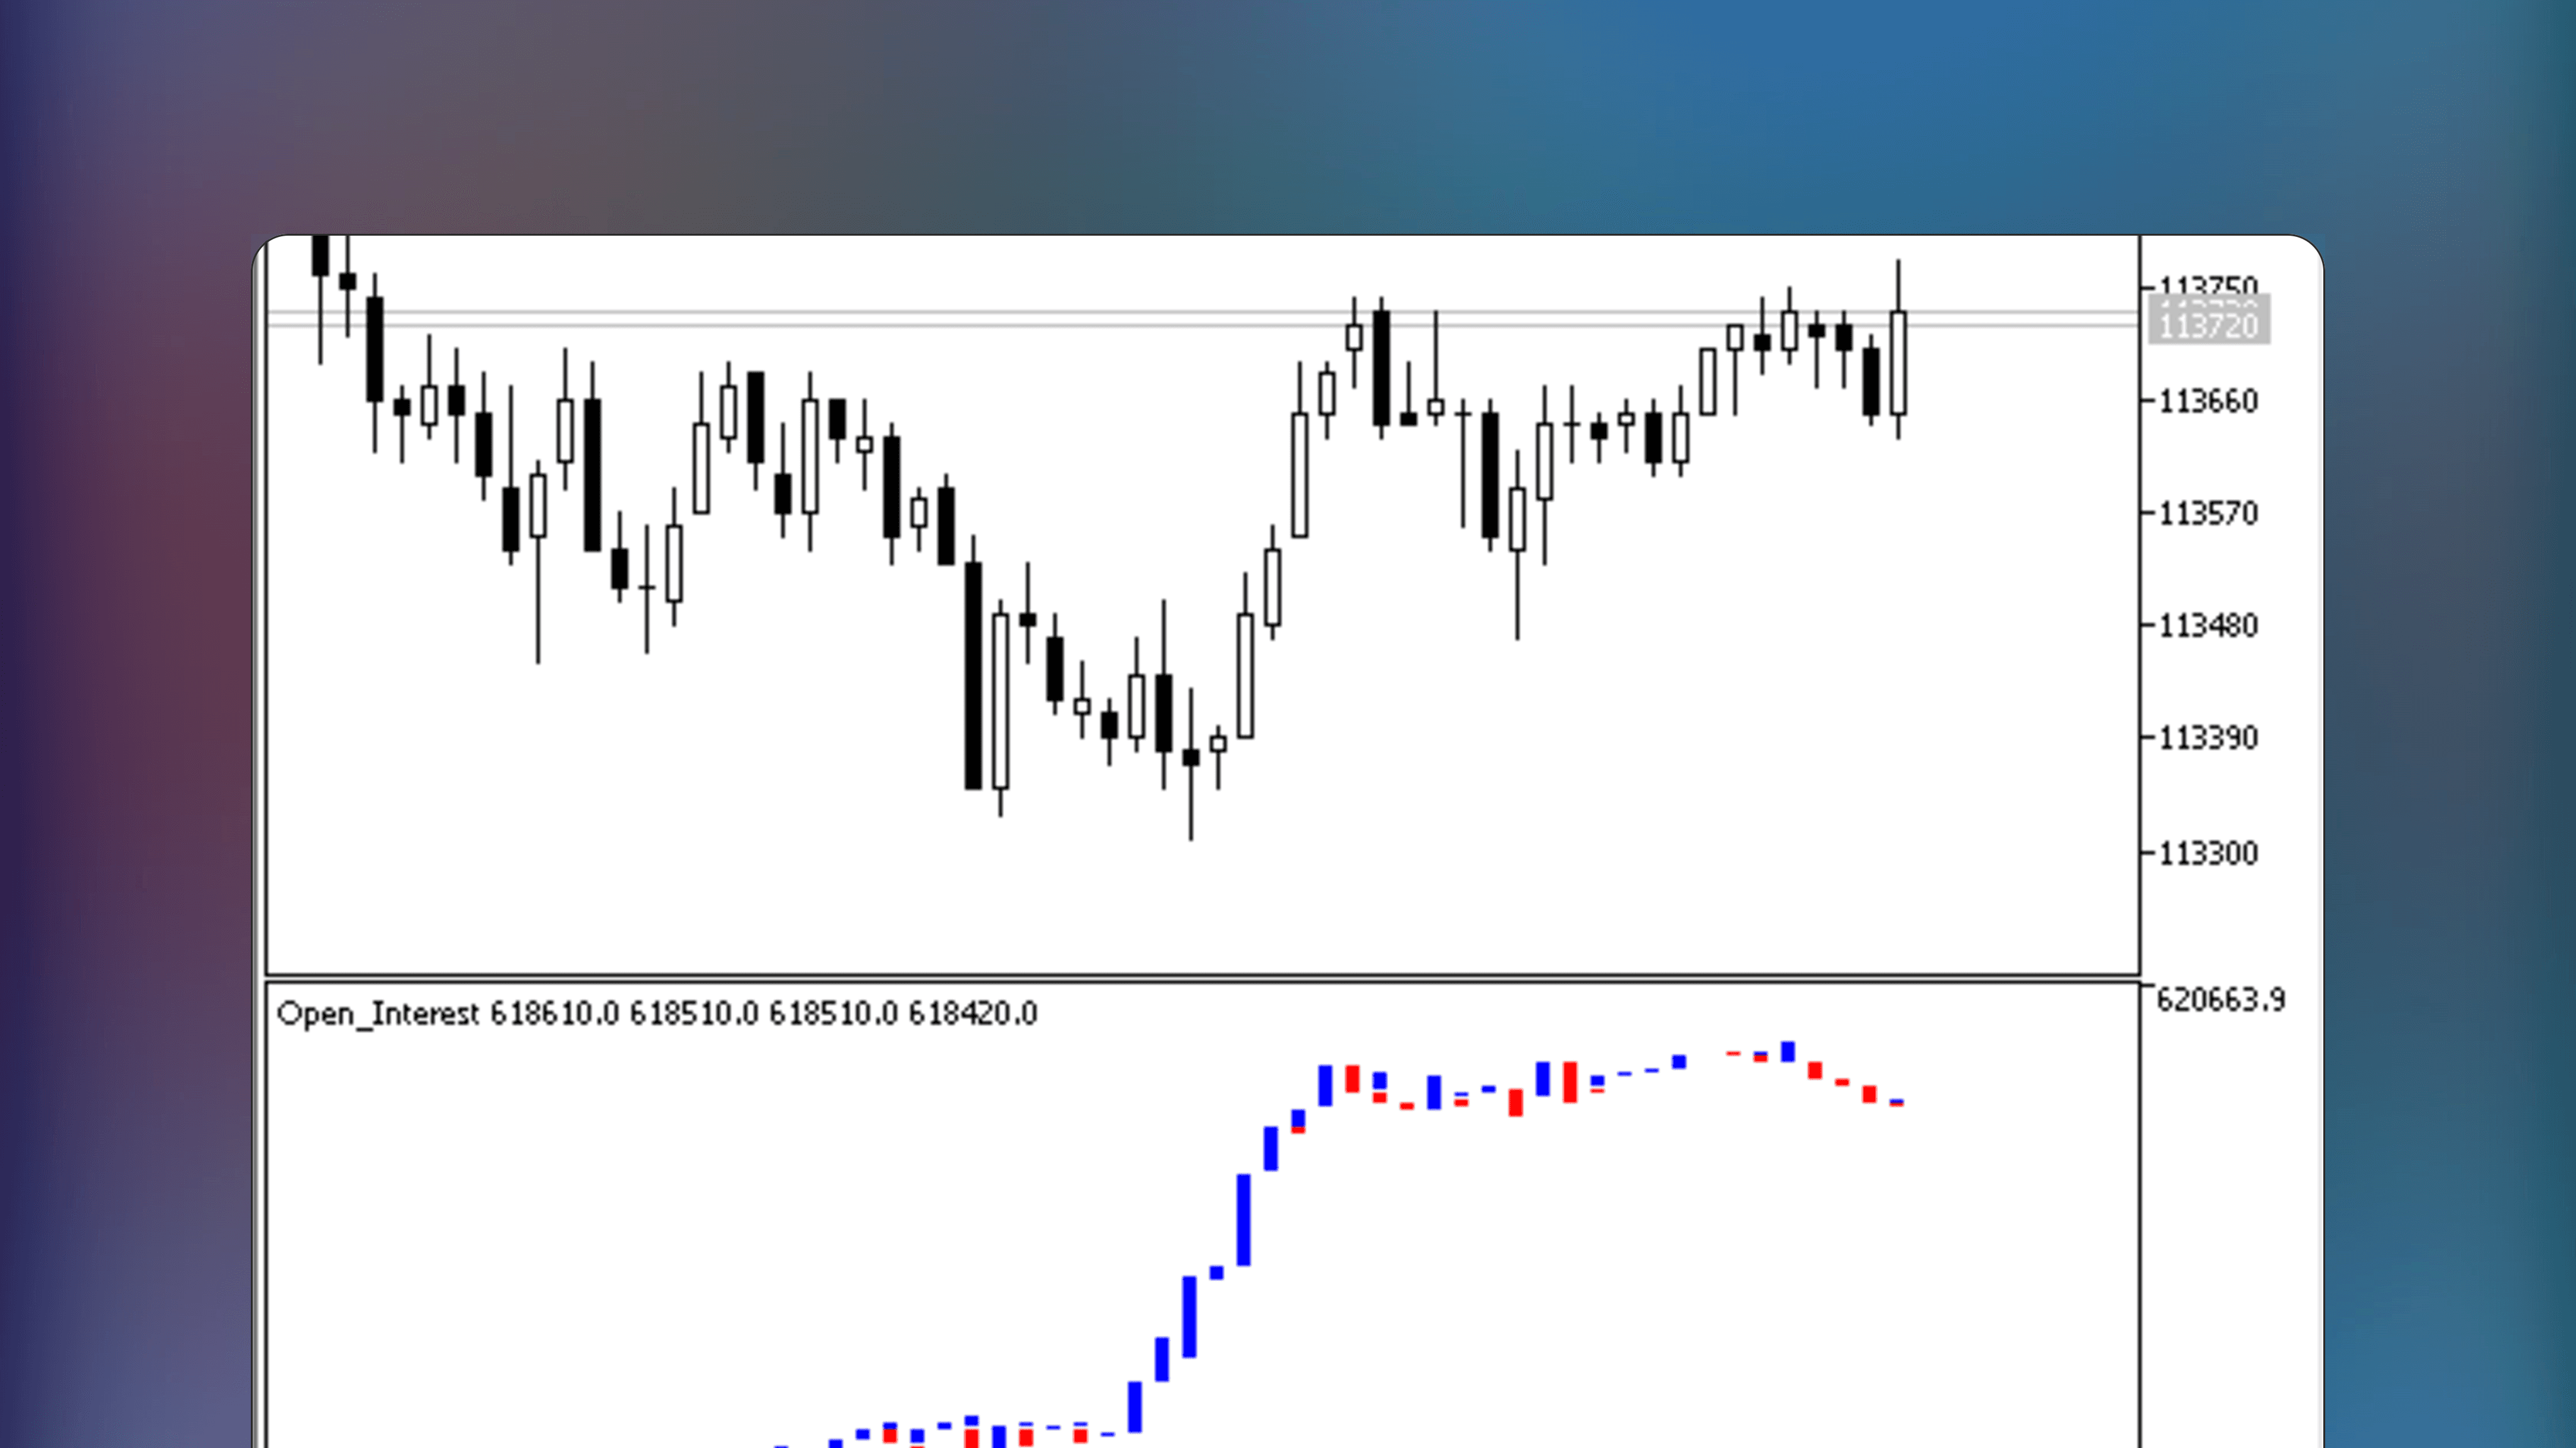
Distinguish new positions from closures

Blue candles show new contracts opening while red candles indicate existing positions closing. This reveals whether moves are fresh or liquidation-driven.

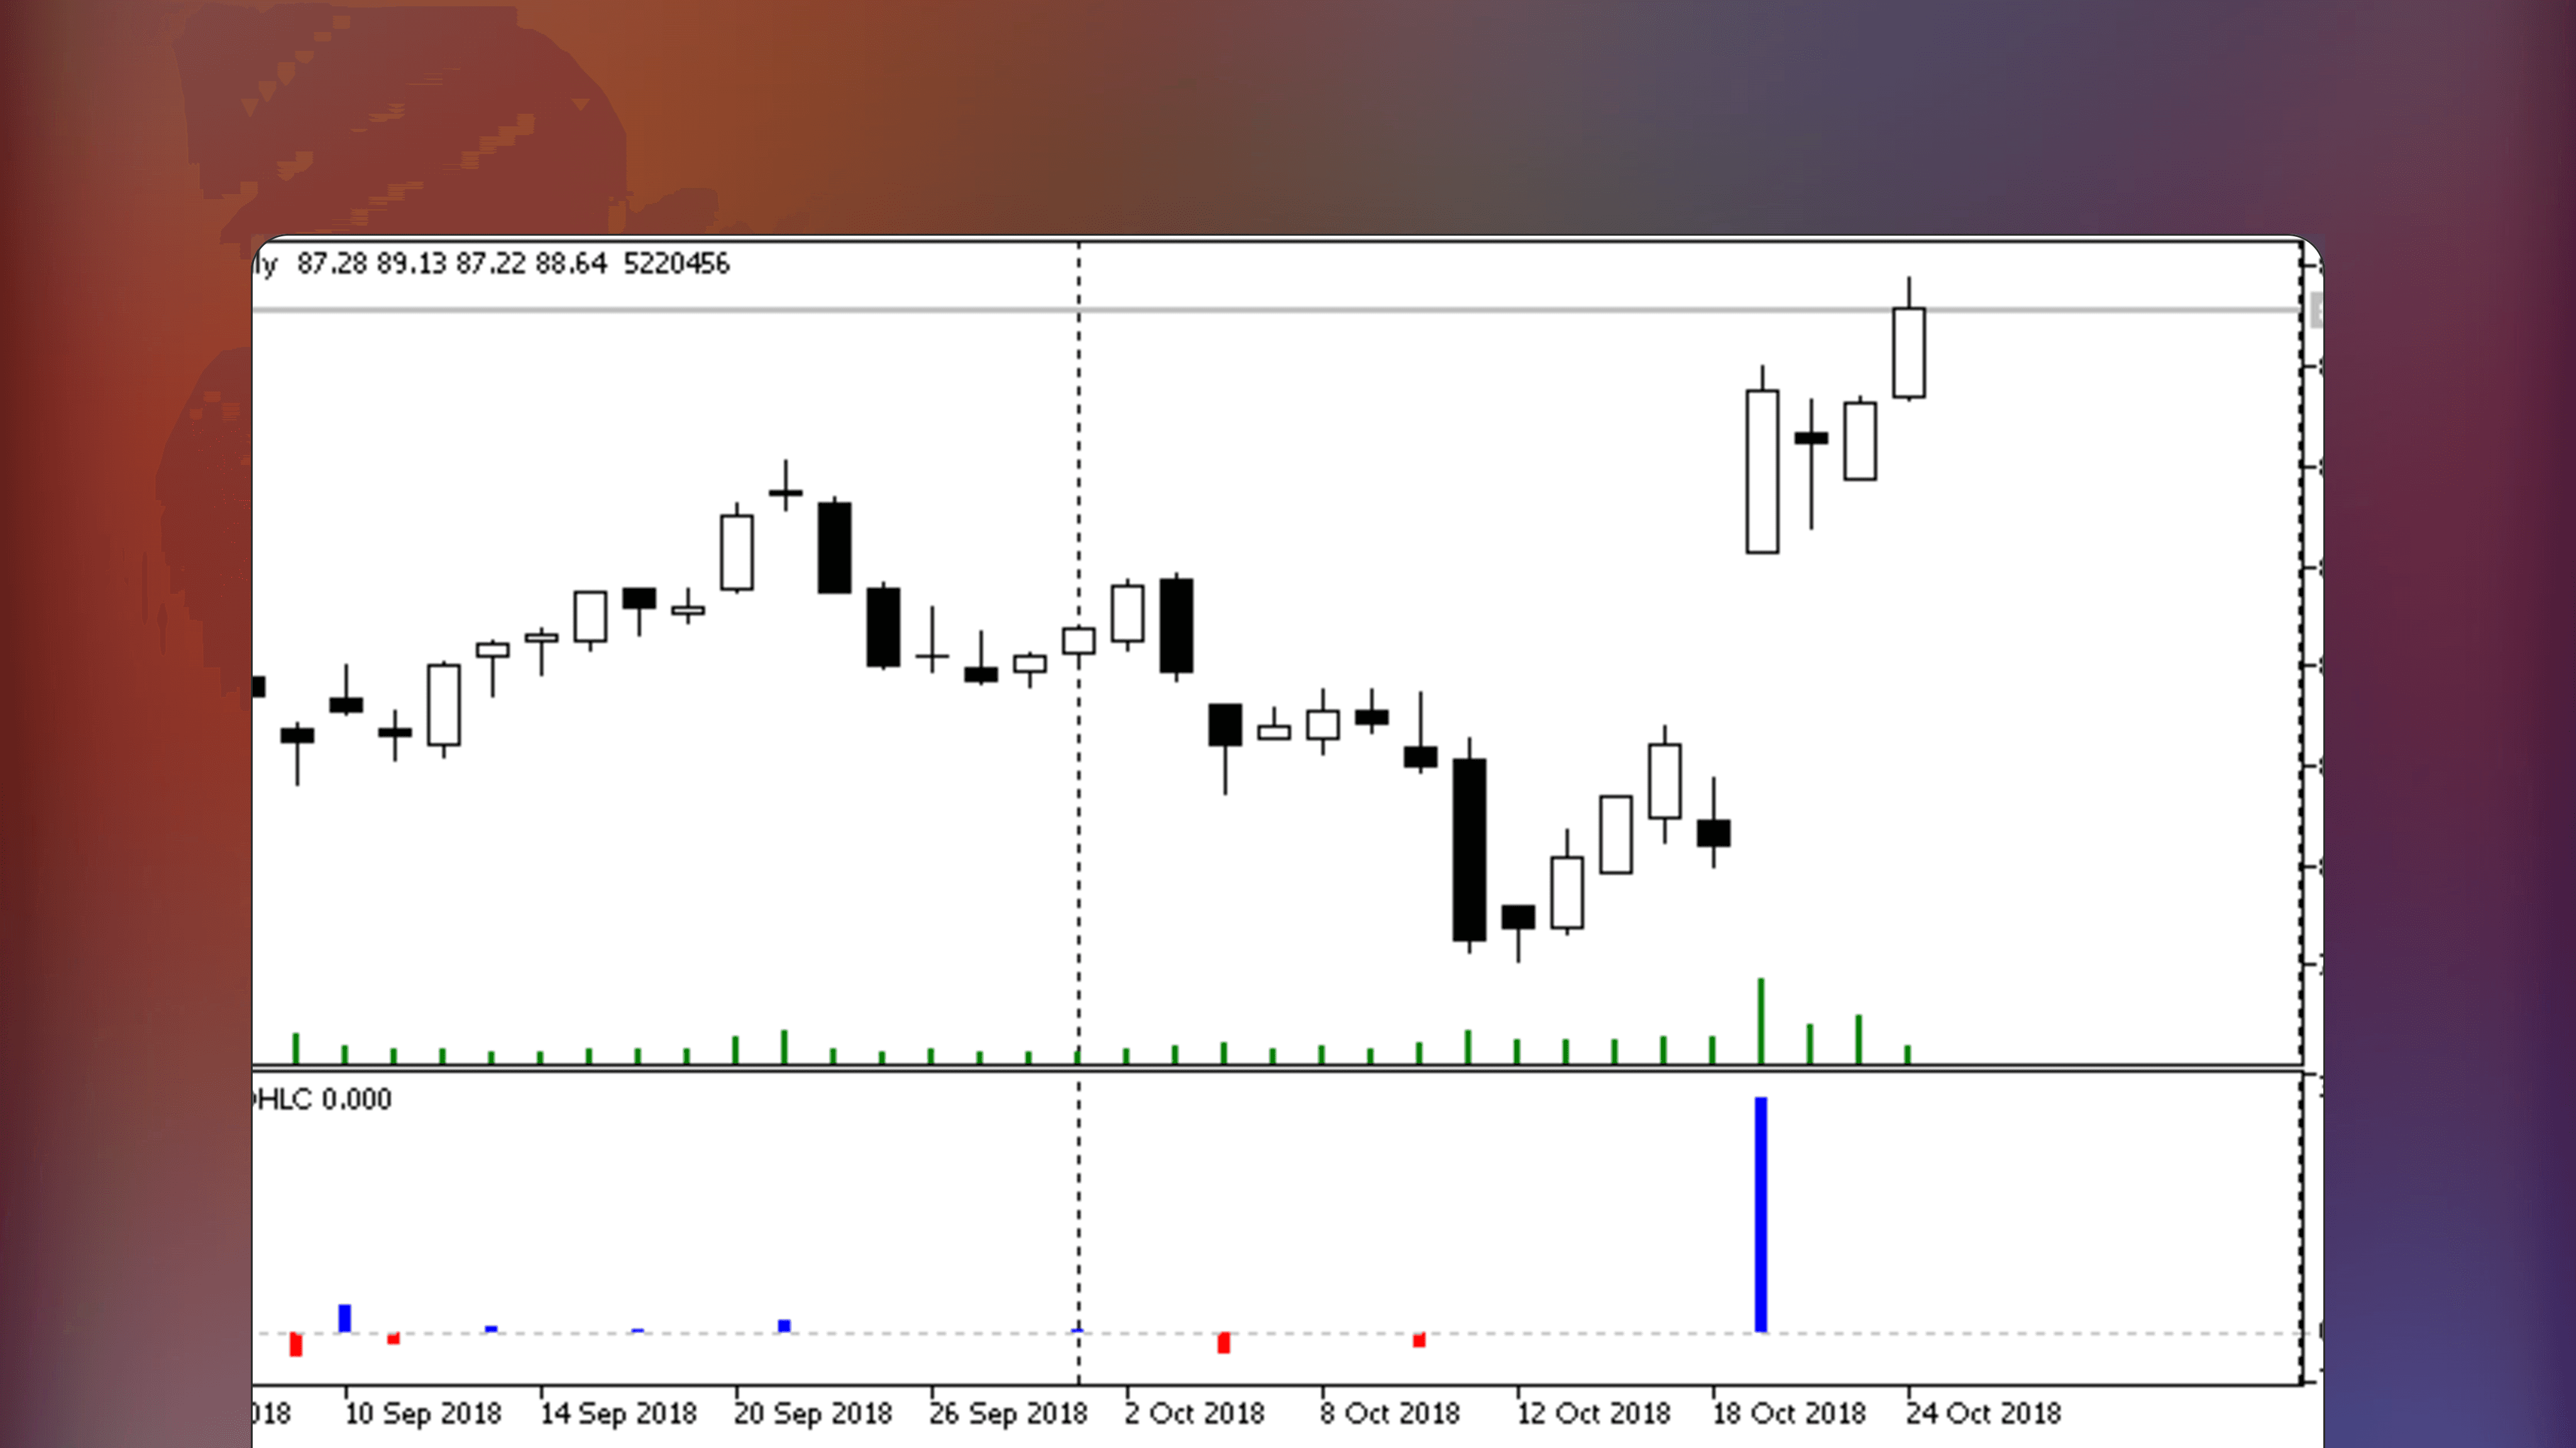
Spot potential forced liquidations

Sharp drops in open interest during rapid price moves often signal cascading liquidations. Position accordingly during high-OI unwinds.

Common Questions About Open Interest Analysis

Common Questions About Open Interest Analysis

Open interest tracks the total outstanding derivative contracts, revealing whether new money is entering or exiting the market. These questions address how to interpret changes in open interest alongside price action.

Open interest tracks the total outstanding derivative contracts, revealing whether new money is entering or exiting the market. These questions address how to interpret changes in open interest alongside price action.

What do blue and red candles indicate?

Blue candles appear when open interest increases, indicating new positions being established. Red candles appear when open interest decreases, showing positions being closed. This visual display makes participation changes immediately visible.

What does rising open interest during a trend confirm?

When price moves in one direction and open interest rises simultaneously, new money is entering in support of the trend. A rally with increasing open interest signals fresh long positions, strengthening the bullish case.

Why is falling open interest during a trend a warning?

Decreasing open interest indicates traders are closing positions rather than opening new ones. This liquidation pattern often precedes trend exhaustion. Rising price with falling open interest suggests the advance is losing participants.

🌐

🌐

Web sentiment

Web sentiment

Traders online feel mixed about Open Interest on MQL5; they appreciate its robust features and community support but express concerns over reliability and authenticity of reviews.

Traders online feel mixed about Open Interest on MQL5; they appreciate its robust features and community support but express concerns over reliability and authenticity of reviews.

Source: Online Discussion

Source: Online Discussion

Source: Online Discussion

✍️

✍️

TradersList Reviews (2)

TradersList Reviews (2)

TradersList Community has given this listing four stars, indicating a well trusted listing with great utility value. This listing is one of the better ones on TradersList.

TradersList Community has given this listing four stars, indicating a well trusted listing with great utility value. This listing is one of the better ones on TradersList.

⭐️

⭐️

⭐️

⭐️

⭐️

Source: TradersList Reviews

Source: TradersList Reviews

Bookmark

Saved here

🤖

Get Indicator

Find Indicator

Review

Review Indicator

✍️

⭐️

⭐️

⭐️

⭐️

⭐️

3

Comments

Read on Telegram

Find More

Similar Indicators

Listing by third party publisher. Not financial advice.

Risk Disclosure

Share Listing

🤖

🤖

Get Indicator

Get Indicator

Find Indicator

Find Indicator

✍️

Review

Review

Review Indicator

Review Indicator

⭐️

⭐️

⭐️

⭐️

⭐️

3

3

Comments

Comments

Read on Telegram

Read on Telegram

Saved here

Bookmark

Listing by third party publisher. Not financial advice.

Listing by third party publisher. Not financial advice.

Risk Disclosure

Risk Disclosure

Share

🤖

3

Get Notified

New Listings Weekly

🤖

3

Get Notified

New Listings Weekly

🤖

3

Get Notified

New Listings Weekly

🔥

New Listings

Featured this week

🤖

Similar Listings

Traders also viewed

All

MetaTrader price chart displaying the Volume Profile indicator with a horizontal histogram representing transaction volumes at specific price levels. Two vertical lines define the time range while horizontal bars of varying lengths indicate volume density.

🤖

by baset84

Free

MetaTrader Indicator

Volume Profile

🔑

🌐

Volume Profile is a MetaTrader indicator displaying transaction volume at various price levels within a selected timeframe using horizontal lines. Additionally, this indicator displays volume point of control (vPOC), but no value area.

MetaTrader chart showing the MarketProfile volume indicator with color-coded statistical time distribution blocks. Green indicates the Asian session blue indicates the European session and violet indicates the American session. The display highlights the Point of Control and Value Area on a price chart.

🤖

by Nikolay Kositsin

Free

MetaTrader Indicator

MarketProfile

🔑

🌐

MarketProfile is a MetaTrader indicator that calculates the distribution of time at price for orderflow analysis. It displays statistical price distribution, control values and key price areas for daily trading sessions using color-coding. Compatible with multiple intraday timeframes according to author.

MetaTrader price chart displaying the VWAP Custom Position indicator line anchored to a specific point marked by an arrow.

🤖

by joserrrm

Free

MetaTrader Indicator

VWAP Custom Position

🔑

🌐

VWAP Custom Position is a MetaTrader indicator that calculates the Volume Weighted Average Price line with a user-defined, movable anchor point. Track trends and fair value dislocations using this VWAP indicator.

MetaTrader chart displaying the Histogram Bid and Ask prices indicator showing a cumulative histogram representing the statistical distribution of Bid and Ask prices.

🤖

by dc2008

Free

MetaTrader Indicator

Histogram Bid and Ask prices

🔑

🌐

Histogram Bid and Ask prices is an Indicator for MetaTrader that plots a cumulative bid and ask price distributions and performs statistical analysis on High, Low, Open and Close prices. Optimized for smaller timeframes.

MetaTrader trading chart with the Time Segmented Volume indicator in a lower panel displaying positive and negative oscillating volume data and dual moving averages

🤖

by fmic

Free

MetaTrader Indicator

Time Segmented Volume (TSV)

🔑

Time Segmented Volume (TSV) is a MetaTrader indicator that segments volume by time to reveal consistent buy or sell pressure. This indicator features customizable price selection, volume weighting options and displays both simple and exponential moving averages.

MetaTrader chart displaying the Volume Weighted Awesome Oscillator in a panel below the price graph. The indicator shows histogram bars fluctuating around a zero line to visualize volume-weighted momentum.

🤖

by mladen

Free

MetaTrader Indicator

Volume weighted awesome oscillator

🔑

🏅

Volume Weighted Awesome Oscillator is a free MetaTrader indicator that modifies Bill Williams’s Awesome Oscillator by using a volume-weighted moving average, combining price and volume analysis into one.

MetaTrader price chart displaying the Volume Accumulation indicator in a sub-window with an oscillating line representing volume flow based on price closing positions.

🤖

by scriptor

Free

MetaTrader Indicator

Volume_Accumulation

🔑

🌐

Volume_Accumulation is a MetaTrader Indicator that displays volume accumulation and distribution using a specialized formula. The indicator requires no inputs or settings, simply start using.

MetaTrader price chart featuring the Session Buy Sell Orders Volume indicator displaying a histogram of minimum and maximum values for buy and sell order volumes

🤖

by barabashkakvn

Free

MetaTrader Indicator

Session Buy Sell Orders Volume

🔑

🌐

🏅

Session Buy Sell Orders Volume is a free MetaTrader indicator that displays a histogram of total buy and sell order volumes for an easy identification of the dominant market side.

Discover trading edge

Discover trading edge

Indicators, Platforms & Education

Indicators, Platforms & Education

Browse Listings

Browse Listings

or

Open Random

Open Random

TradersList

Discover trading edge

Follow

Disclaimer

Our goal is to achieve greater transparency, guidance and safety in trading and investing by providing means to discover, research and discuss trading/investing related sites/services.

Content provided on this site is not financial advice, meant for educational purposes only. TradersList does not endorse or guarantee any result for listed sites/services. Do your own research.

Read full disclaimer