

From TradersList Editors
From TradersList Editors
Enhance trading strategies by using this indicator to identify significant price gaps and uncover potential market opportunities.
Enhance trading strategies by using this indicator to identify significant price gaps and uncover potential market opportunities.


MetaTrader Indicator
MetaTrader Indicator
Gaps OHLC Indicator: Histogram Display of Price Gap Sizes Between Consecutive Bars
Gaps OHLC Indicator: Histogram Display of Price Gap Sizes Between Consecutive Bars
by barabashkakvn on MetaTrader
by barabashkakvn on MetaTrader
🤖
🤖
Gaps OHLC is a MetaTrader Indicator that illustrates price gap sizes on a histogram by comparing the current bar’s open with the previous bar’s low or high. Visualizes magnitude of price movements.
Gaps OHLC is a MetaTrader Indicator that illustrates price gap sizes on a histogram by comparing the current bar’s open with the previous bar’s low or high. Visualizes magnitude of price movements.
Get on MetaTrader
This indicator is available on MetaTrader charting platform. Signing up for a free account and downloading MetaTrader software is required.
Get on MetaTrader
This indicator is available on MetaTrader charting platform. Signing up for a free account and downloading MetaTrader software is required.
🔑
Open Source
Listing has publically available source code that can be audited and modified as needed.
🔑
Open Source
Listing has publically available source code that can be audited and modified as needed.
💸
Free Access
All features of this listing are fully free to use with no pricing tiers. Simply start using.
💸
Free Access
All features of this listing are fully free to use with no pricing tiers. Simply start using.
🥇
Trusted Publisher
Publisher of this listing is well recognized in social channels and receives overwhelmingly positive feedback.
🥇
Trusted Publisher
Publisher of this listing is well recognized in social channels and receives overwhelmingly positive feedback.
✅
Robust Theory
Concepts and theories mentioned in listing are based on generally approved and well established notions.
✅
Robust Theory
Concepts and theories mentioned in listing are based on generally approved and well established notions.
🌐
Popular Topic
Concepts and theories mentioned in listing are popular topics in web search
🌐
Popular Topic
Concepts and theories mentioned in listing are popular topics in web search
Published by barabashkakvn on MetaTrader
Published by barabashkakvn on MetaTrader
Measuring Price Gap Magnitude
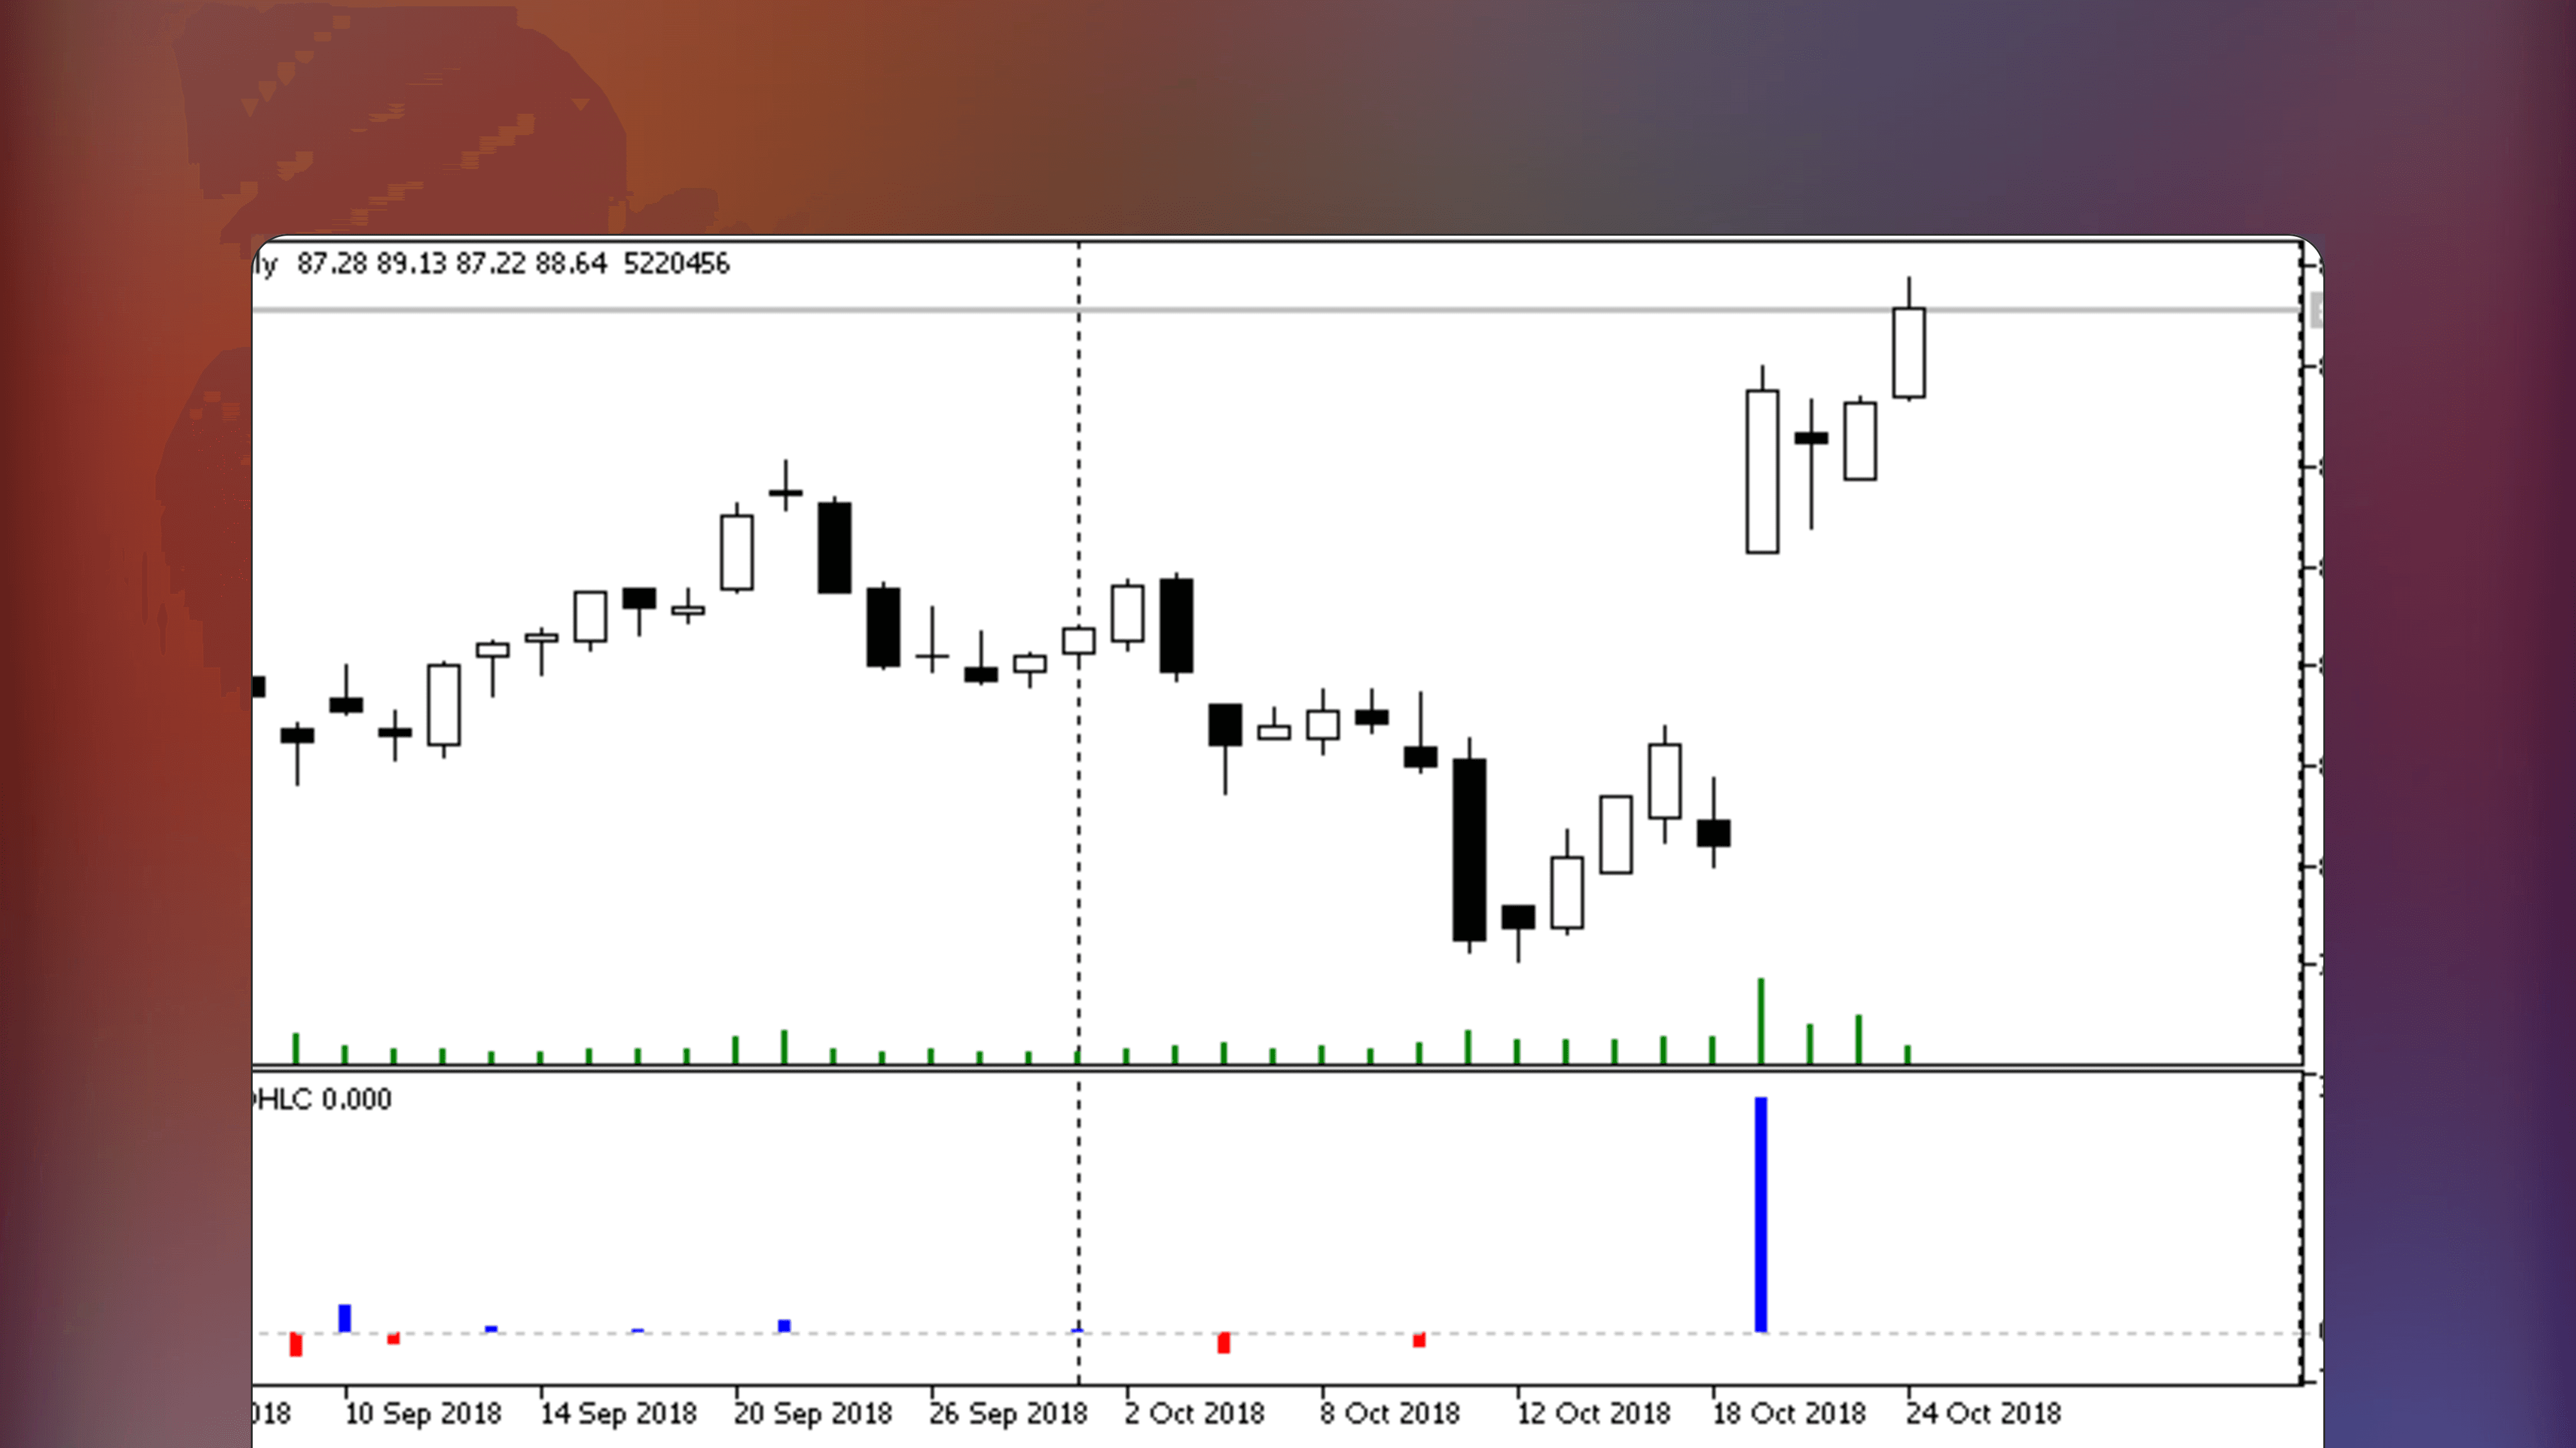
This indicator calculates and displays the size of price gaps by comparing each bar's open with the previous bar's high or low. When the current bar opens above the prior bar's high, it measures a gap up. When it opens below the prior bar's low, it measures a gap down. The results are displayed as a histogram for easy visual comparison.
Visual Histogram of Gap Activity
The histogram format makes it simple to compare gap sizes over time. Tall bars represent large gaps, while short bars indicate minor gaps. Clusters of large gaps suggest heightened volatility or significant news flow. A period of consistently small gaps indicates a quiet, range-bound market where breakout strategies may underperform.
Measuring Price Gap Magnitude
This indicator calculates and displays the size of price gaps by comparing each bar's open with the previous bar's high or low. When the current bar opens above the prior bar's high, it measures a gap up. When it opens below the prior bar's low, it measures a gap down. The results are displayed as a histogram for easy visual comparison.
Visual Histogram of Gap Activity
The histogram format makes it simple to compare gap sizes over time. Tall bars represent large gaps, while short bars indicate minor gaps. Clusters of large gaps suggest heightened volatility or significant news flow. A period of consistently small gaps indicates a quiet, range-bound market where breakout strategies may underperform.


Why Gaps Are Significant in Trading
Gaps represent overnight or between-session price changes where no trading occurred at the intermediate prices. They often signal strong sentiment shifts, earnings surprises or macroeconomic events. The "gap fill" tendency - where price returns to close the gap - is one of the most studied phenomena in technical analysis and forms the basis of many day trading strategies.
Using Gap Data for Strategy Development
By analyzing the histogram over time, traders can quantify gap behavior for a specific instrument. If 70% of gaps on a stock fill within the same session, a gap-fade strategy becomes statistically justified. If gaps rarely fill, it suggests the instrument trends strongly after gapping, favoring continuation trades in the gap direction.
Gap magnitude visualized
Gap magnitude visualized
This indicator calculates and displays the size of price gaps by comparing each bar's open with the previous bar's high or low. Results appear as a histogram, making gap sizes easy to compare over time and revealing periods of heightened volatility or quiet consolidation.
This indicator calculates and displays the size of price gaps by comparing each bar's open with the previous bar's high or low. Results appear as a histogram, making gap sizes easy to compare over time and revealing periods of heightened volatility or quiet consolidation.
Quantify Gap Size Objectively
Tall histogram bars represent large gaps while short bars indicate minor gaps. Clusters of large gaps suggest heightened volatility or significant news flow.
Spot Unusual Gap Activity
Gaps represent overnight sentiment shifts where no trading occurred at intermediate prices. Unusually large gaps signal strong reactions worth analyzing further.
Evaluate Gap Fill Probability
Analyzing gap behavior over time reveals whether an instrument tends to fill gaps or trend after gapping. This data informs gap-fade or continuation strategies.
Common Questions About Gap Analysis
Common Questions About Gap Analysis
Measuring and visualizing gap sizes reveals volatility patterns and trading opportunities. Here are common questions about gap-based analysis.
Measuring and visualizing gap sizes reveals volatility patterns and trading opportunities. Here are common questions about gap-based analysis.
What does the gap histogram tell me about market conditions?
Tall bars represent large gaps signaling heightened volatility or significant news. Clusters of large gaps suggest active market conditions. Consistently small gaps indicate quiet, range-bound markets where breakout strategies may underperform.
Do most gaps fill during the same session?
Studies suggest many gaps fill intraday, but behavior varies by instrument. Analyze the histogram over time to quantify your specific instrument's gap-fill tendency. Some instruments consistently fill gaps while others trend after gapping.
How do I trade gaps using this indicator?
If historical data shows 70% of gaps fill same-session, a gap-fade strategy becomes statistically justified. If gaps rarely fill, consider continuation trades in the gap direction. Let the data guide your strategy selection.
🌐
🌐
Web sentiment
Web sentiment
Web traders have mixed feelings about Gaps OHLC; some value its strategy tools, while frustrations arise over interface and reliability issues.
Web traders have mixed feelings about Gaps OHLC; some value its strategy tools, while frustrations arise over interface and reliability issues.
Source: Online Discussion
Source: Online Discussion
Source: Online Discussion
✍️
✍️
TradersList Reviews (3)
TradersList Reviews (3)
TradersList Community has given this listing three stars, indicating decent trust and value for traders' toolkit. Make sure you understand functionality before using.
TradersList Community has given this listing three stars, indicating decent trust and value for traders' toolkit. Make sure you understand functionality before using.
⭐️
⭐️
⭐️
⭐️
⭐️
Source: TradersList Reviews
Source: TradersList Reviews


Bookmark
Saved here
🤖
Get Indicator
Find Indicator
Review
Review Indicator
✍️
⭐️
⭐️
⭐️
⭐️
⭐️
3
Comments
Read on Telegram
Listing by third party publisher. Not financial advice.
Risk Disclosure


Share Listing
🤖
🤖
Get Indicator
Get Indicator
Find Indicator
Find Indicator
✍️
Review
Review
Review Indicator
Review Indicator
⭐️
⭐️
⭐️
⭐️
⭐️
Saved here
Bookmark
Listing by third party publisher. Not financial advice.
Listing by third party publisher. Not financial advice.
Risk Disclosure
Risk Disclosure
Share
🤖
3


🤖
3
🤖
3
✍️
By Author
More by barabashkakvn

🤖
by barabashkakvn

Free
MetaTrader Indicator
Engulfing Pattern Plus One
🔑
Engulfing Pattern Plus One is a free MetaTrader indicator that detects strong engulfing patterns by looking for bars engulfing previous two based on high and low prices. Visualized using arrows and rectangles on the chart.
🤖
by barabashkakvn
Free
MetaTrader Indicator
Resistance & Support
🔑
🌐
🏅
Resistance & Support is a free MetaTrader indicator that dynamically draws support and resistance lines based on fractal detection.

🤖
by barabashkakvn

Free
MetaTrader Indicator
Session Buy Sell Orders Volume
🔑
🌐
✅
🏅
Session Buy Sell Orders Volume is a free MetaTrader indicator that displays a histogram of total buy and sell order volumes for an easy identification of the dominant market side.
Load More
🤖
by barabashkakvn
Free
MetaTrader Indicator
Engulfing Pattern Plus One
🔑
Engulfing Pattern Plus One is a free MetaTrader indicator that detects strong engulfing patterns by looking for bars engulfing previous two based on high and low prices. Visualized using arrows and rectangles on the chart.
🤖
by barabashkakvn
Free
MetaTrader Indicator
Resistance & Support
🔑
🌐
🏅
Resistance & Support is a free MetaTrader indicator that dynamically draws support and resistance lines based on fractal detection.
Load More
🔥
New Listings
Featured this week

🤖
by allanster

Free
TradingView Indicator
Growing or Waning Patterns [Alerts]
New
🔑
🌐
Growing or Waning Patterns [Alerts] is a TradingView indicator that detects reversal signals based on three candle body patterns. The patterns are classified as increasing or decreasing depending on bullish and bearish states. Additional features include alerts and trend filter.

📟
Free*
Trade Analytics Platform
TRDR.IO
New
🌐
✅
🏅
TRDR.IO is a crypto orderflow platform providing various tools visualizing crypto exchange order book activity. See bid-ask imbalances, buy and sell demand as well as order book depth in real-time with intuitive visual overlays. Additional features include alerts and scanning crypto markets for orderflow events.

🤖
by LeviathanCapital
Free
TradingView Indicator
Swing Levels and Liquidity - By Leviathan
New
🔑
🌐
✅
Swing Levels and Liquidity is a TradingView Indicator that displays swing high and low levels with volume traded at the pivots. Once formed, these levels likely retain liquidity that traders can expect to produce support and resistance in price when swept.
🤖
by allanster
Free
TradingView Indicator
Growing or Waning Patterns [Alerts]
New
🔑
🌐
Growing or Waning Patterns [Alerts] is a TradingView indicator that detects reversal signals based on three candle body patterns. The patterns are classified as increasing or decreasing depending on bullish and bearish states. Additional features include alerts and trend filter.
📟
Free*
Trade Analytics Platform
TRDR.IO
New
🌐
✅
🏅
TRDR.IO is a crypto orderflow platform providing various tools visualizing crypto exchange order book activity. See bid-ask imbalances, buy and sell demand as well as order book depth in real-time with intuitive visual overlays. Additional features include alerts and scanning crypto markets for orderflow events.
Load More
🤖
Similar Listings
Traders also viewed
All


🤖
by rajeshnait
Free
MetaTrader Indicator
Fair Value Gap
🔑
🌐
✅
Fair Value Gap is an Indicator for MetaTrader that detects price imbalances using a pattern consisting of three candles, highlighting strong disagreement between buyers and sellers.

🤖
by behzad
Free
MetaTrader Indicator
Shved Supply and Demand
🔑
🌐
Shved Supply and Demand is a MetaTrader indicator that uses fractals and the ATR to automatically identify and categorize support and resistance zones. It features history mode, multi-timeframe display, mobile notifications and distinction between zone strength like weak, verified, and proven.

🤖
by andorofo
Free
MetaTrader Indicator
Harmonic Pattern Finder V3
🔑
🌐
Harmonic Pattern Finder V3 is a MetaTrader indicator that automatically identifies harmonic patterns using Fibonacci ratios and pattern matching algorithms. It offers customizable displays to reduce screen clutter, interactive pattern highlighting with detailed analytics, unified zigzag selection, statistical performance tracking and a refactored codebase for easy integration with other indicators.

🤖
by mladen
Free
MetaTrader Indicator
Squeeze - on chart
🔑
🌐
🏅
Squeeze - on chart is a MetaTrader indicator that color-codes candles or bars with potential on-going long or short squeezes, based on standard deviations.

🤖
by fxborg
Free
MetaTrader Indicator
Price Heatmap
🔑
Price Heatmap is a free MetaTrader indicator that visualizes price movements using heatmap style visuals to convey where, when and how long an asset spent time at various price levels. In essence, this is a rolling, dynamic market profile.

🤖
by scriptor
Free
MetaTrader Indicator
Patterns
🔑
🌐
🏅
Patterns is a MetaTrader indicator that automatically identifies thirty popular candlestick patterns on price charts. With 38 adjustable settings, it allows customization of pattern displaying, tooltips and detection criteria.

🤖
by scriptor
Free
MetaTrader Indicator
Tarzan
🔑
🌐
🏅
Tarzan is a MetaTrader Indicator that visualizes RSI changes that align with price action, using simple color-coded bars and signal arrows. Multiple customziation options, like smoothed RSI and adjustable channels.

🤖
by scriptor
Free
MetaTrader Indicator
Extreme_TMA_line_indicator
🔑
🏅
Extreme_TMA_line_indicator is a MetaTrader Indicator that calculates price bands to identify extremes using TMA and ATR, defined by an user specified multiplier. This indicator also draws a central line that changes color based on trend direction.

🤖
by scriptor
Free
MetaTrader Indicator
Market_Sessions
🔑
🌐
✅
Market_Sessions is a MetaTrader Indicator that displays New York, London, Tokyo and Sydney trading sessions on price charts. This indicator offers customizable settings for session times, colors, labels and lines. Usable on 1 hour timeframe or lower.

🤖
by godzilla
Free
MetaTrader Indicator
KI_signals
🔑
KI_signals is a MetaTrader indicator that generates signals using the XMACD histogram by detecting changes in histogram and signal line directions and their intersections, displayed as colored candlesticks.

🤖
by godzilla
Free
MetaTrader Indicator
TrendValue_HTF
🔑
🏅
TrendValue_HTF is a free MetaTrader indicator that analyzes market trends based on the concept of Supertrend, with support for multi-timeframe calculations.

🤖
by scriptor
Free
MetaTrader Indicator
Thrust_Bar
🔑
🌐
🏅
Thrust_Bar is a MetaTrader indicator that identifies significant price movements using ATR for identifying sudden shifts that can cause a persistent trend change. Variety of customization options from selecting ATR period, multipliers and alert options.

🤖
by godzilla
Free
MetaTrader Indicator
St_LRegr
🔑
🌐
🏅
St_LRegr is a MetaTrader Indicator that expands the standard linear regression channel by adding support and resistance lines. Easy to integrate into other indicators.

🤖
by rone
Free
MetaTrader Indicator
Disparity Index
🔑
Disparity Index is a MetaTrader Indicator that dynamically defines overbought and oversold levels using average price changes and applying candlestick reversal models to identify market reversals and trends.

🤖
by godzilla
Free
MetaTrader Indicator
Gann_Multi_Trend
🔑
Gann_Multi_Trend is a free MetaTrader Indicator that analyzes micro, middle and main market trends using Gann's theories.

🤖
by godzilla
Free
MetaTrader Indicator
MFIdivCandle
🔑
MFIdivCandle is a free MetaTrader indicator by RickD that uses the Money Flow Index oscillator to color candles as overbought, oversold, or neutral, providing distinct colors for each market condition.

🤖
by mladen
Free
MetaTrader Indicator
Weighted deviation bands
🔑
✅
🏅
Weighted Deviation Bands is a free MetaTrader indicator that enhances traditional Bollinger Bands by using a linear weighted average and weighted deviation, providing a better adaptability for most recent price data.

🤖
by mladen
Free
MetaTrader Indicator
Elder Auto Envelopes V2
🔑
🌐
🏅
Elder Auto Envelopes V2 is a MetaTrader indicator that draws price action channels using standard deviation. It automatically sizes channel lines according to a moving average with additional features like profit targets.

🤖
by likare
Free
MetaTrader Indicator
MACD Candles Alert
🔑
🌐
MACD Candles Alert is a MetaTrader Indicator that displays momentum changes by altering candle colors based on the MACD metric, transforming MACD into simple visual cues and alerts for changes in the values.

🤖
by 3rjfx
Free
MetaTrader Indicator
DayPivotPoint MT5
🔑
🌐
DayPivotPoint MT5 is a MetaTrader indicator that identifies key price levels for a trading day using pivot points and standard open, high, low and closing prices. Additionally, the indicator provides signals and alerts for major price interacting with the levels.

🤖
by scriptor
Free
MetaTrader Indicator
GapFinder
🔑
✅
🏅
GapFinder is a MetaTrader Indicator that identifies and displays trading gaps between the high and low of consecutive bars using arrows. Offers a range of customization options, such as minimum gap size and display modes.

🤖
by godzilla
Free
MetaTrader Indicator
Super_Signals_Channel
🔑
🌐
🏅
Super_Signals_Channel is a MetaTrader indicator by Nick Bilak that uses a redrawing price action channel with adjustable look-up periods to highlight extreme price levels where retracements might take place.

🤖
by mladen
Free
MetaTrader Indicator
Intraday Channel Breakout
🔑
🌐
🏅
Intraday Channel Breakout is a MetaTrader indicator that detects intraday channel breakouts by monitoring user-defined channel limits.

🤖
by godzilla
Free
MetaTrader Indicator
SilverTrend
🔑
🌐
🏅
SilverTrend is a MetaTrader indicator that uses color-coded candlesticks to identify trend cycles based on multiple price action patterns. Additionally, users can opt in for alerts, emails and push notifications for trend shifts detected by this indicator.

🤖
by scriptor
Free
MetaTrader Indicator
Breakout
🔑
🌐
🏅
Breakout is a MetaTrader indicator that displays high and low ranges for navigating breakouts within specific time intervals. The indicator dynamically recalculates levels whenever price enters the period zone based on user defined settings.

🤖
by pipcrop
Free
MetaTrader Indicator
Strong Historical Levels
🔑
🌐
Strong Historical Levels is a free MetaTrader indicator that identifies key historical support and resistance levels by analyzing candlestick patterns. It uses K-means clustering algorithm to group significant price movements and displays these levels on charts.

🤖
by mladen
Free
MetaTrader Indicator
Hurst Exponent - optimized version
🔑
🌐
🏅
The Hurst Exponent – optimized version is a free MetaTrader indicator that uses an optimized Hurst exponent to detect trend shifts early with greater adaptability to most recent price data and less lag.

🤖
by godzilla
Free
MetaTrader Indicator
Support_and_Resistance_HTF
🔑
🌐
🏅
Support_and_Resistance_HTF is a MetaTrader indicator that identifies support and resistance levels from multiple timeframes automatically.
🤖
by barabashkakvn
Free
MetaTrader Indicator
Engulfing Pattern Plus One
🔑
Engulfing Pattern Plus One is a free MetaTrader indicator that detects strong engulfing patterns by looking for bars engulfing previous two based on high and low prices. Visualized using arrows and rectangles on the chart.

🤖
by dominik_egert
Free
MetaTrader Indicator
Extended Heikin Ashi Indicator
🔑
🌐
The Extended Heikin Ashi Indicator is a free MetaTrader indicator that uses the Heikin Ashi technique to smooth standard candlesticks, reducing noise and making trend detection easier.
🤖
by rajeshnait
Free
MetaTrader Indicator
Fair Value Gap
🔑
🌐
✅
Fair Value Gap is an Indicator for MetaTrader that detects price imbalances using a pattern consisting of three candles, highlighting strong disagreement between buyers and sellers.
🤖
by behzad
Free
MetaTrader Indicator
Shved Supply and Demand
🔑
🌐
Shved Supply and Demand is a MetaTrader indicator that uses fractals and the ATR to automatically identify and categorize support and resistance zones. It features history mode, multi-timeframe display, mobile notifications and distinction between zone strength like weak, verified, and proven.
🤖
by andorofo
Free
MetaTrader Indicator
Harmonic Pattern Finder V3
🔑
🌐
Harmonic Pattern Finder V3 is a MetaTrader indicator that automatically identifies harmonic patterns using Fibonacci ratios and pattern matching algorithms. It offers customizable displays to reduce screen clutter, interactive pattern highlighting with detailed analytics, unified zigzag selection, statistical performance tracking and a refactored codebase for easy integration with other indicators.
🤖
by mladen
Free
MetaTrader Indicator
Squeeze - on chart
🔑
🌐
🏅
Squeeze - on chart is a MetaTrader indicator that color-codes candles or bars with potential on-going long or short squeezes, based on standard deviations.
🤖
by fxborg
Free
MetaTrader Indicator
Price Heatmap
🔑
Price Heatmap is a free MetaTrader indicator that visualizes price movements using heatmap style visuals to convey where, when and how long an asset spent time at various price levels. In essence, this is a rolling, dynamic market profile.
🤖
by scriptor
Free
MetaTrader Indicator
Patterns
🔑
🌐
🏅
Patterns is a MetaTrader indicator that automatically identifies thirty popular candlestick patterns on price charts. With 38 adjustable settings, it allows customization of pattern displaying, tooltips and detection criteria.
🤖
by scriptor
Free
MetaTrader Indicator
Tarzan
🔑
🌐
🏅
Tarzan is a MetaTrader Indicator that visualizes RSI changes that align with price action, using simple color-coded bars and signal arrows. Multiple customziation options, like smoothed RSI and adjustable channels.
🤖
by scriptor
Free
MetaTrader Indicator
Extreme_TMA_line_indicator
🔑
🏅
Extreme_TMA_line_indicator is a MetaTrader Indicator that calculates price bands to identify extremes using TMA and ATR, defined by an user specified multiplier. This indicator also draws a central line that changes color based on trend direction.
🤖
by scriptor
Free
MetaTrader Indicator
Market_Sessions
🔑
🌐
✅
Market_Sessions is a MetaTrader Indicator that displays New York, London, Tokyo and Sydney trading sessions on price charts. This indicator offers customizable settings for session times, colors, labels and lines. Usable on 1 hour timeframe or lower.
🤖
by godzilla
Free
MetaTrader Indicator
KI_signals
🔑
KI_signals is a MetaTrader indicator that generates signals using the XMACD histogram by detecting changes in histogram and signal line directions and their intersections, displayed as colored candlesticks.
🤖
by godzilla
Free
MetaTrader Indicator
TrendValue_HTF
🔑
🏅
TrendValue_HTF is a free MetaTrader indicator that analyzes market trends based on the concept of Supertrend, with support for multi-timeframe calculations.
🤖
by scriptor
Free
MetaTrader Indicator
Thrust_Bar
🔑
🌐
🏅
Thrust_Bar is a MetaTrader indicator that identifies significant price movements using ATR for identifying sudden shifts that can cause a persistent trend change. Variety of customization options from selecting ATR period, multipliers and alert options.
🤖
by godzilla
Free
MetaTrader Indicator
St_LRegr
🔑
🌐
🏅
St_LRegr is a MetaTrader Indicator that expands the standard linear regression channel by adding support and resistance lines. Easy to integrate into other indicators.
🤖
by rone
Free
MetaTrader Indicator
Disparity Index
🔑
Disparity Index is a MetaTrader Indicator that dynamically defines overbought and oversold levels using average price changes and applying candlestick reversal models to identify market reversals and trends.
🤖
by godzilla
Free
MetaTrader Indicator
Gann_Multi_Trend
🔑
Gann_Multi_Trend is a free MetaTrader Indicator that analyzes micro, middle and main market trends using Gann's theories.
🤖
by godzilla
Free
MetaTrader Indicator
MFIdivCandle
🔑
MFIdivCandle is a free MetaTrader indicator by RickD that uses the Money Flow Index oscillator to color candles as overbought, oversold, or neutral, providing distinct colors for each market condition.
🤖
by mladen
Free
MetaTrader Indicator
Weighted deviation bands
🔑
✅
🏅
Weighted Deviation Bands is a free MetaTrader indicator that enhances traditional Bollinger Bands by using a linear weighted average and weighted deviation, providing a better adaptability for most recent price data.
🤖
by mladen
Free
MetaTrader Indicator
Elder Auto Envelopes V2
🔑
🌐
🏅
Elder Auto Envelopes V2 is a MetaTrader indicator that draws price action channels using standard deviation. It automatically sizes channel lines according to a moving average with additional features like profit targets.
🤖
by likare
Free
MetaTrader Indicator
MACD Candles Alert
🔑
🌐
MACD Candles Alert is a MetaTrader Indicator that displays momentum changes by altering candle colors based on the MACD metric, transforming MACD into simple visual cues and alerts for changes in the values.
🤖
by 3rjfx
Free
MetaTrader Indicator
DayPivotPoint MT5
🔑
🌐
DayPivotPoint MT5 is a MetaTrader indicator that identifies key price levels for a trading day using pivot points and standard open, high, low and closing prices. Additionally, the indicator provides signals and alerts for major price interacting with the levels.
🤖
by rajeshnait
Free
MetaTrader Indicator
Fair Value Gap
🔑
🌐
✅
Fair Value Gap is an Indicator for MetaTrader that detects price imbalances using a pattern consisting of three candles, highlighting strong disagreement between buyers and sellers.
🤖
by behzad
Free
MetaTrader Indicator
Shved Supply and Demand
🔑
🌐
Shved Supply and Demand is a MetaTrader indicator that uses fractals and the ATR to automatically identify and categorize support and resistance zones. It features history mode, multi-timeframe display, mobile notifications and distinction between zone strength like weak, verified, and proven.
🤖
by andorofo
Free
MetaTrader Indicator
Harmonic Pattern Finder V3
🔑
🌐
Harmonic Pattern Finder V3 is a MetaTrader indicator that automatically identifies harmonic patterns using Fibonacci ratios and pattern matching algorithms. It offers customizable displays to reduce screen clutter, interactive pattern highlighting with detailed analytics, unified zigzag selection, statistical performance tracking and a refactored codebase for easy integration with other indicators.
🤖
by mladen
Free
MetaTrader Indicator
Squeeze - on chart
🔑
🌐
🏅
Squeeze - on chart is a MetaTrader indicator that color-codes candles or bars with potential on-going long or short squeezes, based on standard deviations.
🤖
by fxborg
Free
MetaTrader Indicator
Price Heatmap
🔑
Price Heatmap is a free MetaTrader indicator that visualizes price movements using heatmap style visuals to convey where, when and how long an asset spent time at various price levels. In essence, this is a rolling, dynamic market profile.
🤖
by scriptor
Free
MetaTrader Indicator
Patterns
🔑
🌐
🏅
Patterns is a MetaTrader indicator that automatically identifies thirty popular candlestick patterns on price charts. With 38 adjustable settings, it allows customization of pattern displaying, tooltips and detection criteria.
🤖
by scriptor
Free
MetaTrader Indicator
Tarzan
🔑
🌐
🏅
Tarzan is a MetaTrader Indicator that visualizes RSI changes that align with price action, using simple color-coded bars and signal arrows. Multiple customziation options, like smoothed RSI and adjustable channels.
🤖
by scriptor
Free
MetaTrader Indicator
Extreme_TMA_line_indicator
🔑
🏅
Extreme_TMA_line_indicator is a MetaTrader Indicator that calculates price bands to identify extremes using TMA and ATR, defined by an user specified multiplier. This indicator also draws a central line that changes color based on trend direction.
🤖
by scriptor
Free
MetaTrader Indicator
Market_Sessions
🔑
🌐
✅
Market_Sessions is a MetaTrader Indicator that displays New York, London, Tokyo and Sydney trading sessions on price charts. This indicator offers customizable settings for session times, colors, labels and lines. Usable on 1 hour timeframe or lower.
🤖
by godzilla
Free
MetaTrader Indicator
KI_signals
🔑
KI_signals is a MetaTrader indicator that generates signals using the XMACD histogram by detecting changes in histogram and signal line directions and their intersections, displayed as colored candlesticks.
Discover trading edge
Discover trading edge
Indicators, Platforms & Education
Indicators, Platforms & Education
TradersList
Discover trading edge
Join Telegram
Weekly listings
Join Telegram
Disclaimer
Our goal is to achieve greater transparency, guidance and safety in trading and investing by providing means to discover, research and discuss trading/investing related sites/services.
Content provided on this site is not financial advice, meant for educational purposes only. TradersList does not endorse or guarantee any result for listed sites/services. Do your own research.
Read full disclaimer
TradersList
Discover trading edge
Join Telegram
Disclaimer
Our goal is to achieve greater transparency, guidance and safety in trading and investing by providing means to discover, research and discuss trading/investing related sites/services.
Content provided on this site is not financial advice, meant for educational purposes only. TradersList does not endorse or guarantee any result for listed sites/services. Do your own research.
Read full disclaimer