


Define Direction from VWAP Position
Price trading above anchored VWAP means most participants from that event are profitable. Below means they are underwater, influencing sentiment.
Track Trends from Key Events
Anchor to a major gap, breakout candle or reversal bar. The resulting line shows average cost basis for everyone who traded since that event.
Spot Deviations from Fair Value
Anchored VWAP lines frequently act as support during uptrends and resistance during downtrends. Falling below puts breakout buyers at a loss.
What events make good anchor points for VWAP?
Significant events like earnings gaps, breakout candles, major reversal bars or swing highs and lows work well as anchors. The VWAP from that point shows the average cost basis for everyone who traded since that event. Recent pivotal moments provide more relevant reference levels.
Why does price often respect anchored VWAP as support or resistance?
Price above the anchored VWAP means most participants since that event are profitable. They have less reason to sell and may add to positions. Price below puts those participants underwater, creating selling pressure. This psychology makes the level a natural inflection point.
How many anchored VWAPs should I have on a chart?
Less is more. Having too many lines creates confusion and conflicting signals. Focus on two or three significant anchor points like the move start, a recent major pivot and current session open. Remove anchors that are no longer relevant to current price action.
⭐️
⭐️
⭐️
⭐️
⭐️


🔥
New Listings
Featured this week


🤖
Similar Listings
Traders also viewed
All


🤖
by baset84

Free
MetaTrader Indicator
Volume Profile
🔑
🌐
✅
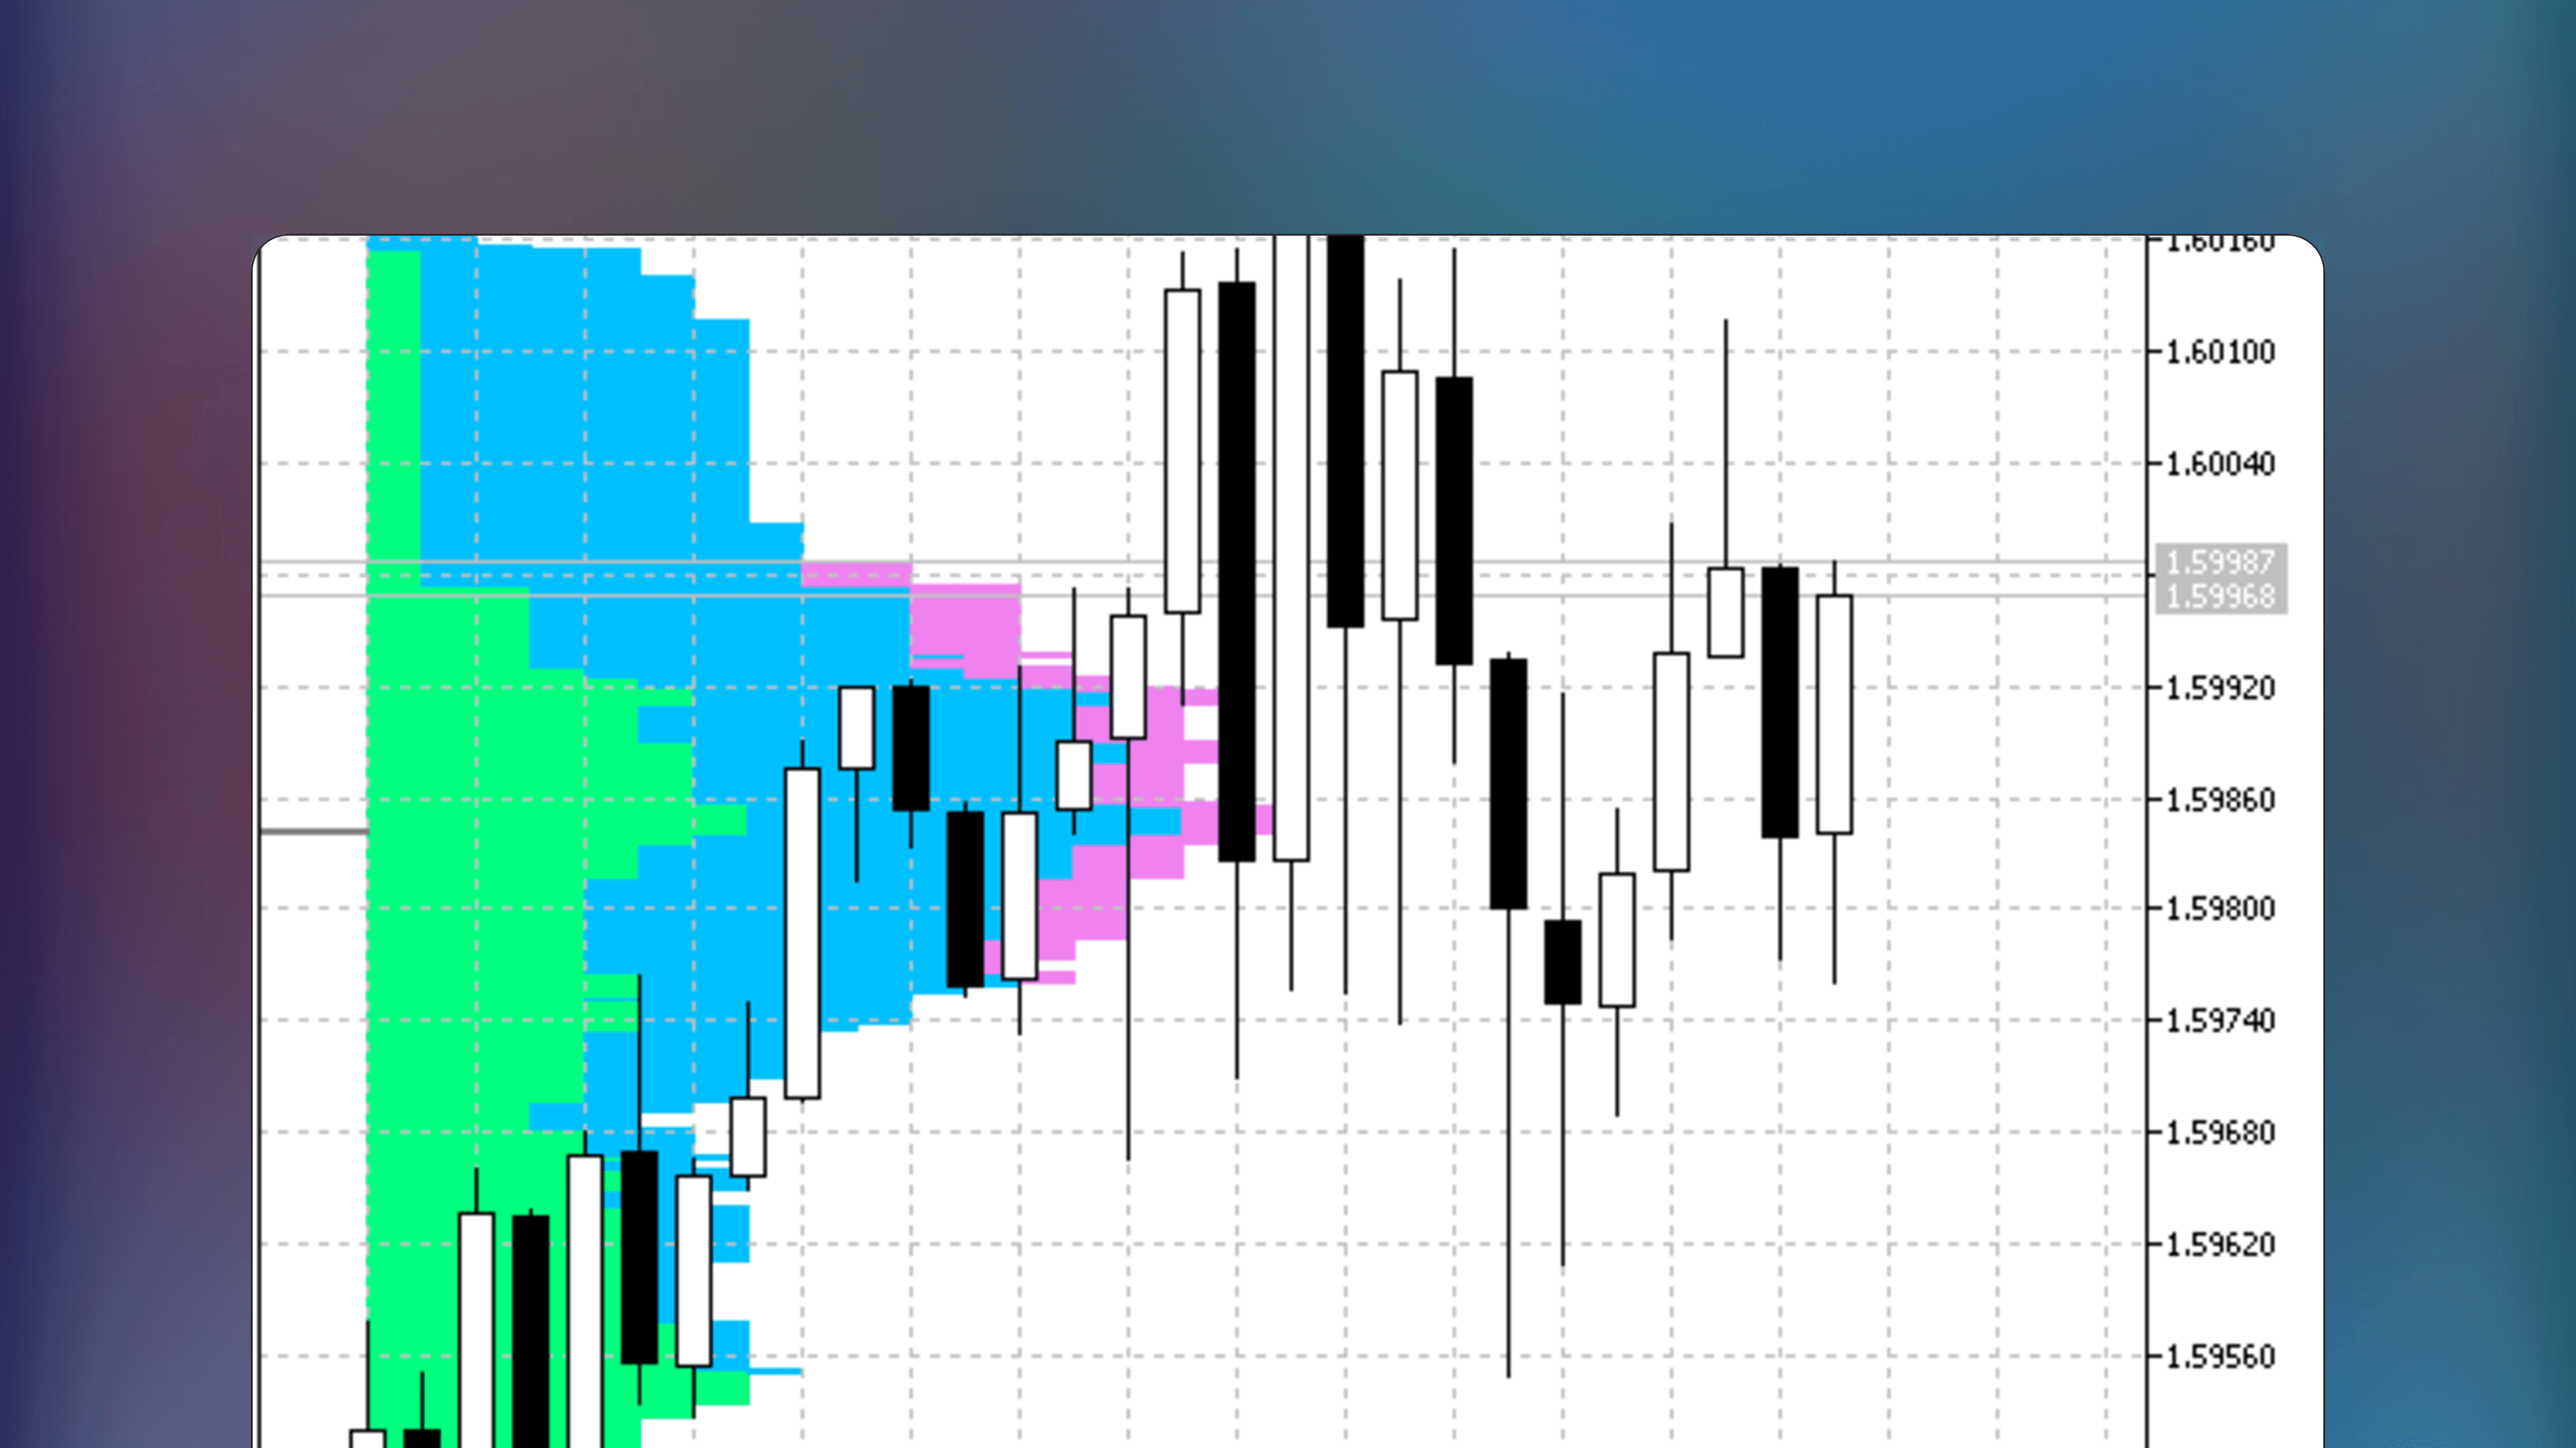
Volume Profile is a MetaTrader indicator displaying transaction volume at various price levels within a selected timeframe using horizontal lines. Additionally, this indicator displays volume point of control (vPOC), but no value area.
🤖
by Nikolay Kositsin
Free
MetaTrader Indicator
MarketProfile
🔑
🌐
✅
MarketProfile is a MetaTrader indicator that calculates the distribution of time at price for orderflow analysis. It displays statistical price distribution, control values and key price areas for daily trading sessions using color-coding. Compatible with multiple intraday timeframes according to author.

🤖
by dc2008
Free
MetaTrader Indicator
Histogram Bid and Ask prices
🔑
🌐
Histogram Bid and Ask prices is an Indicator for MetaTrader that plots a cumulative bid and ask price distributions and performs statistical analysis on High, Low, Open and Close prices. Optimized for smaller timeframes.

🤖
by fmic
Free
MetaTrader Indicator
Time Segmented Volume (TSV)
🔑
Time Segmented Volume (TSV) is a MetaTrader indicator that segments volume by time to reveal consistent buy or sell pressure. This indicator features customizable price selection, volume weighting options and displays both simple and exponential moving averages.

🤖
by mladen
Free
MetaTrader Indicator
Volume weighted awesome oscillator
🔑
🏅
Volume Weighted Awesome Oscillator is a free MetaTrader indicator that modifies Bill Williams’s Awesome Oscillator by using a volume-weighted moving average, combining price and volume analysis into one.

🤖
by scriptor
Free
MetaTrader Indicator
Volume_Accumulation
🔑
🌐
Volume_Accumulation is a MetaTrader Indicator that displays volume accumulation and distribution using a specialized formula. The indicator requires no inputs or settings, simply start using.

🤖
by barabashkakvn
Free
MetaTrader Indicator
Session Buy Sell Orders Volume
🔑
🌐
✅
🏅
Session Buy Sell Orders Volume is a free MetaTrader indicator that displays a histogram of total buy and sell order volumes for an easy identification of the dominant market side.
🤖
by barabashkakvn
Free
MetaTrader Indicator
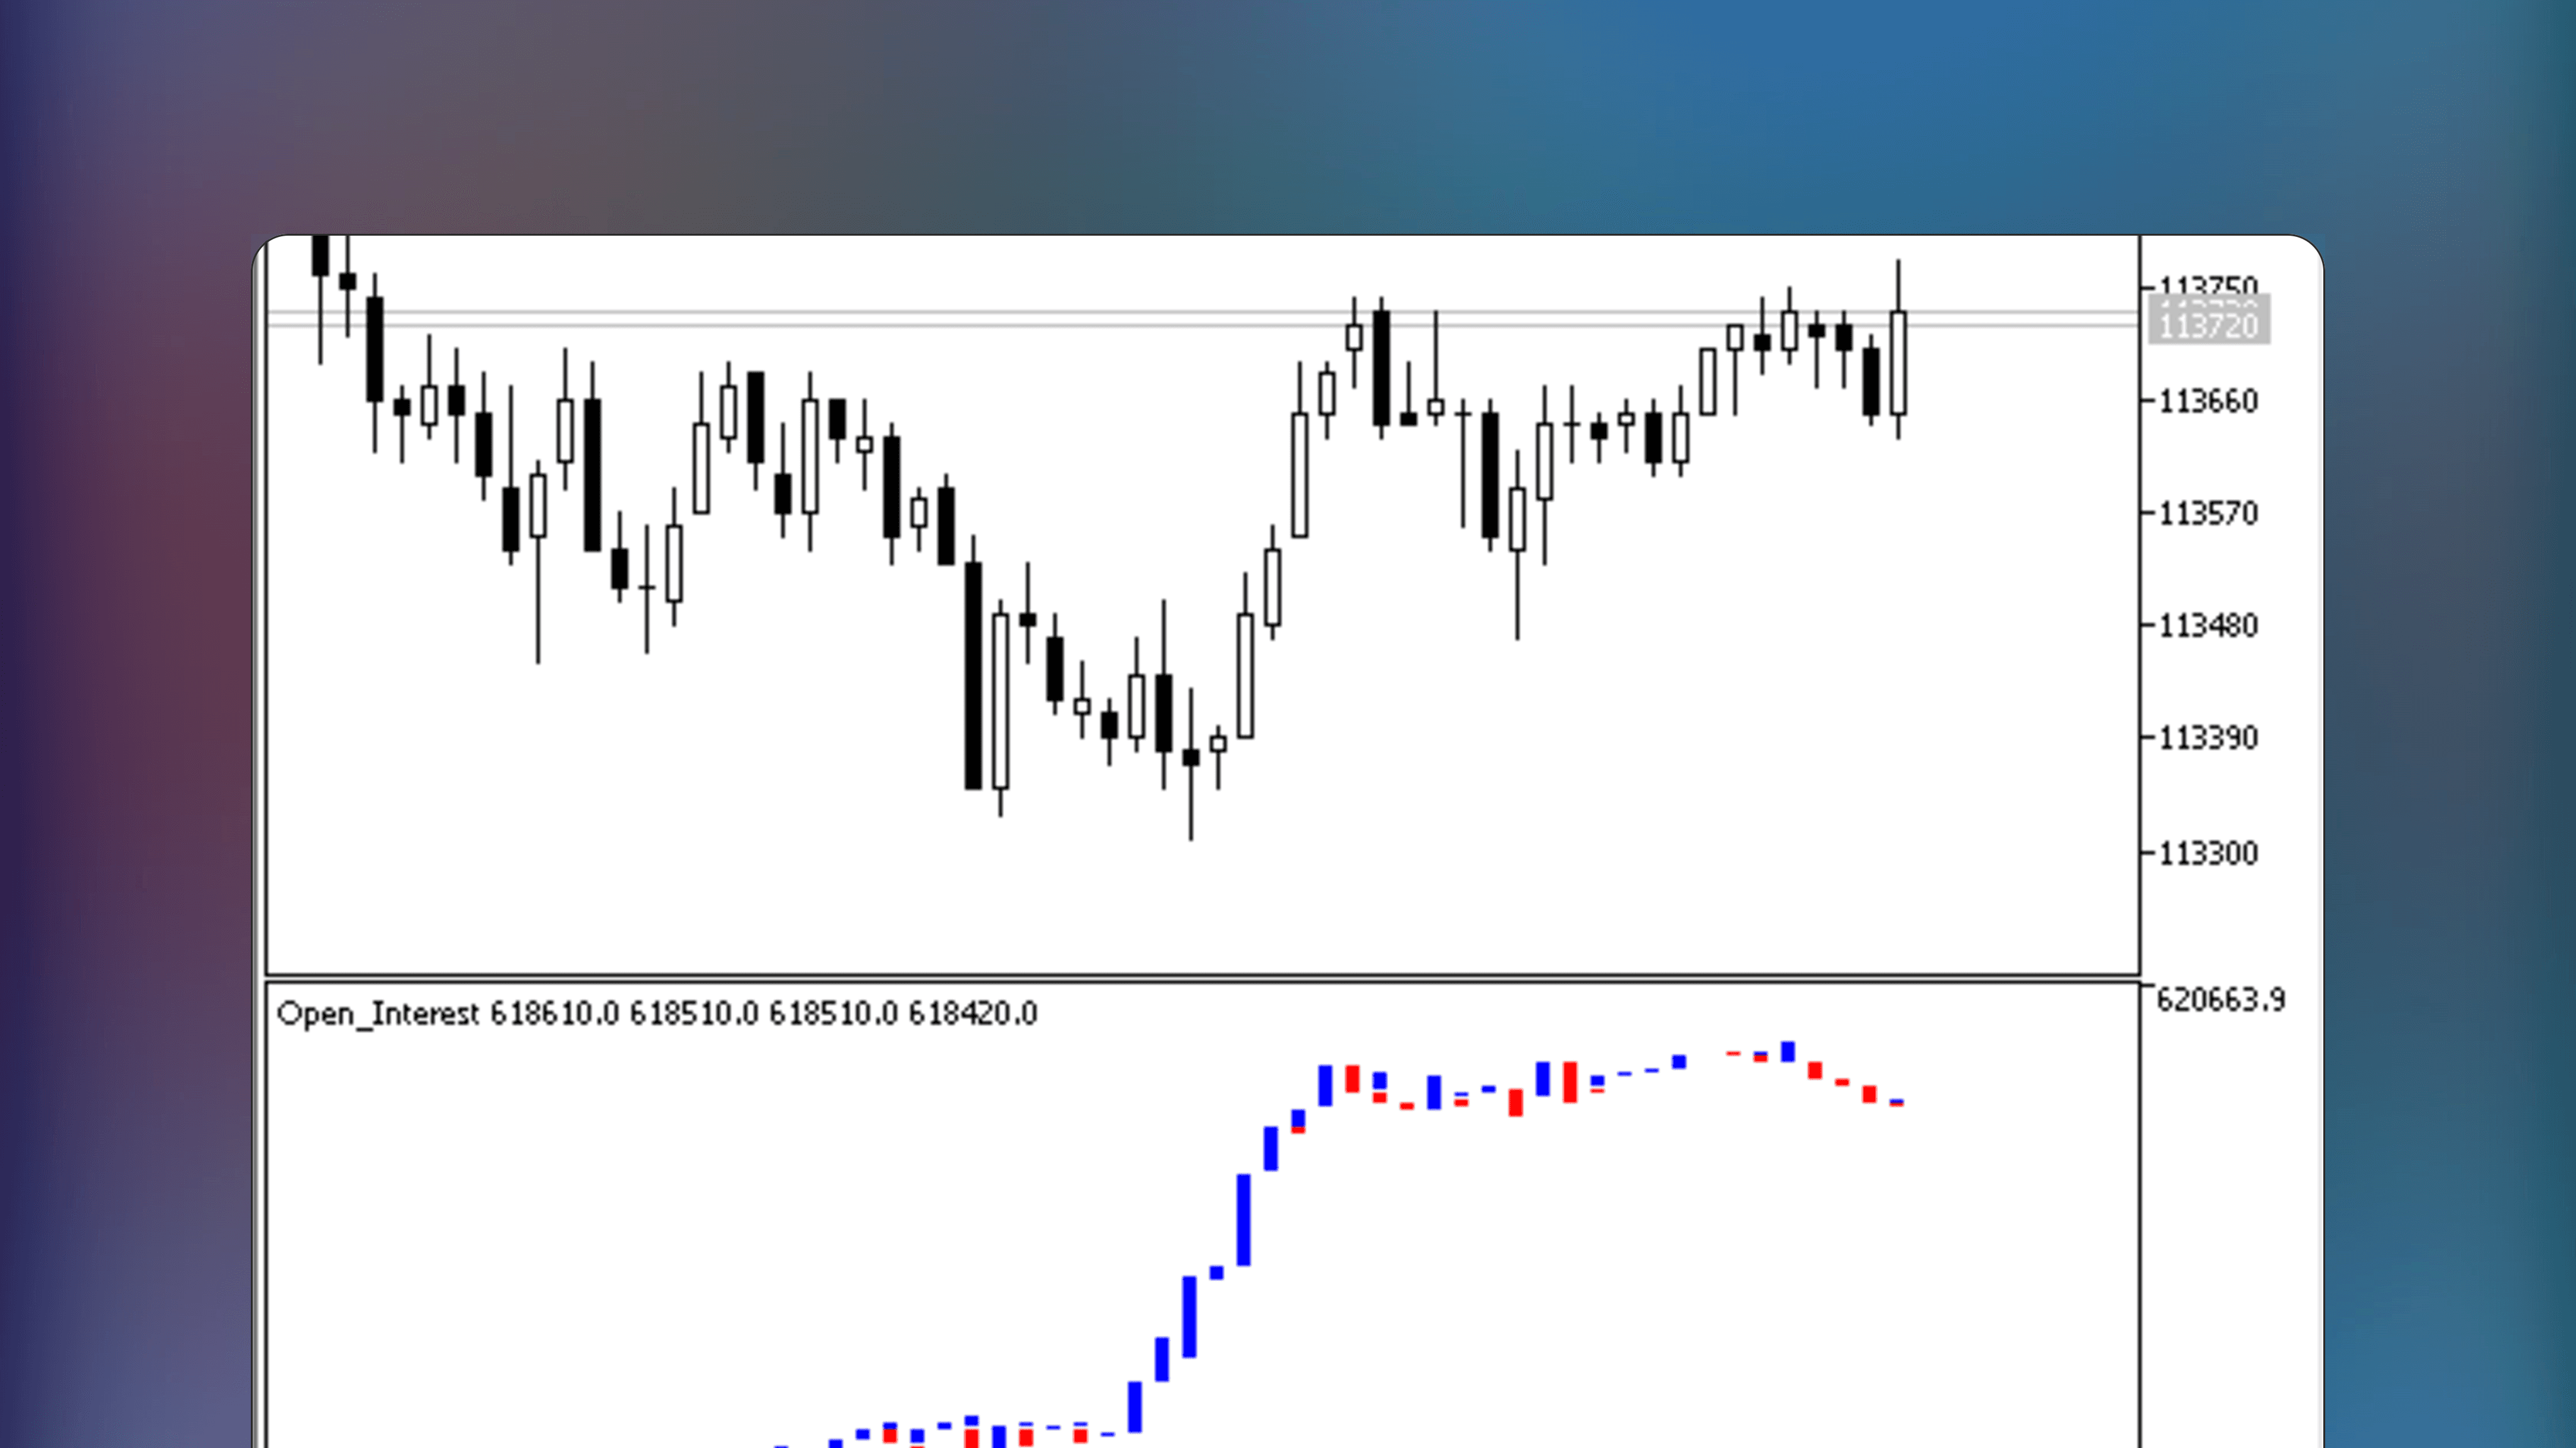
Open Interest
🔑
🌐
✅
🏅
Open Interest is a MetaTrader indicator that monitors the net value of open positions using blue and red candle colors, corresponding to increases or decreases in open interest.