


Spot unusual volume activity
TSV highlights divergences between price movement and volume pressure, revealing when moves lack conviction or when hidden accumulation is occurring beneath the surface.
Measure buyer and seller conviction
Persistent positive TSV readings indicate sustained buying pressure while negative readings suggest distribution. This directional volume context validates or questions price moves.
Detect accumulation and distribution phases
When price holds steady but TSV trends consistently in one direction, the indicator signals quiet accumulation or distribution before a potential breakout occurs.
How does TSV differ from regular volume indicators?
TSV weights volume by price change direction within time segments, distinguishing buying from selling pressure. Regular volume shows total activity regardless of direction. TSV reveals whether volume is accumulating or distributing during specific periods.
What does rising price with negative TSV indicate?
This divergence suggests distribution where smart money sells into rising prices. Despite price increase, volume flow is net negative indicating selling pressure. This pattern often precedes reversals as buying fails to match selling despite higher prices.
Which timeframe works best for TSV analysis?
Daily TSV shows institutional accumulation and distribution patterns. Intraday TSV reveals session-specific buying and selling pressure. Match TSV timeframe to your trading horizon. Higher timeframes show more significant patterns while lower timeframes provide entry timing.
⭐️
⭐️
⭐️
⭐️
⭐️


🔥
New Listings
Featured this week


🤖
Similar Listings
Traders also viewed
All


🤖
by baset84

Free
MetaTrader Indicator
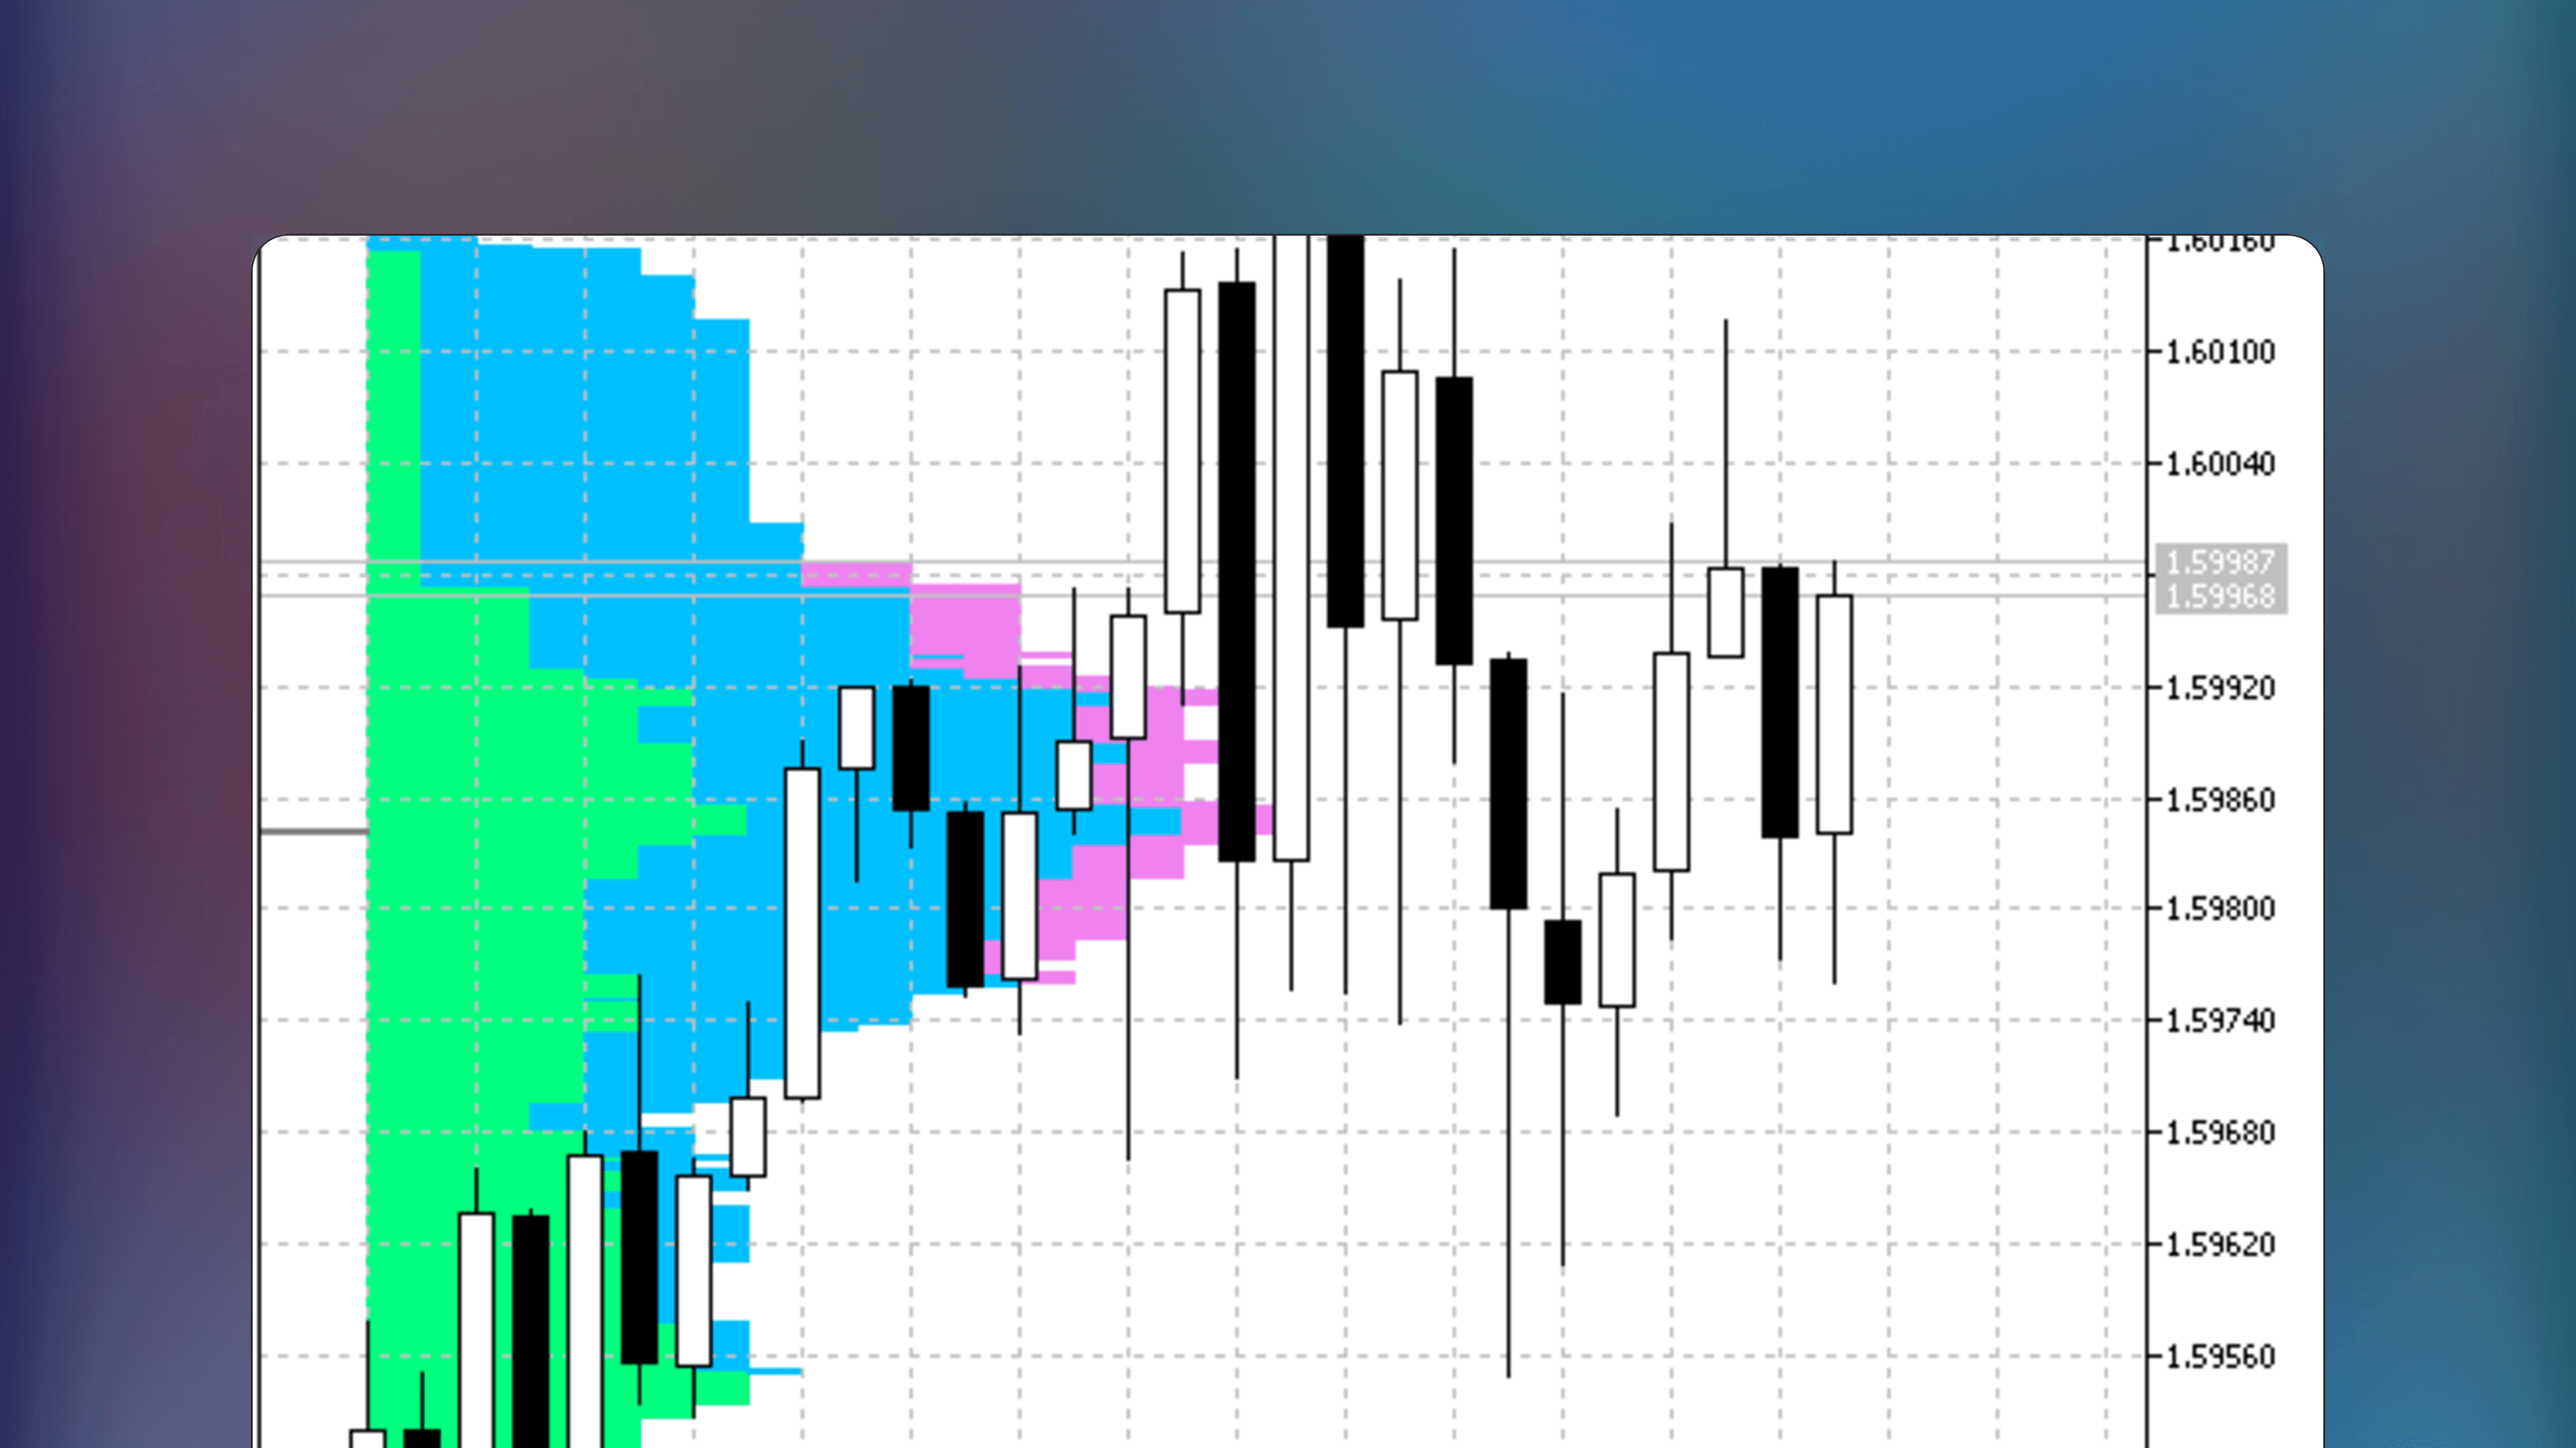
Volume Profile
🔑
🌐
✅
Volume Profile is a MetaTrader indicator displaying transaction volume at various price levels within a selected timeframe using horizontal lines. Additionally, this indicator displays volume point of control (vPOC), but no value area.
🤖
by Nikolay Kositsin
Free
MetaTrader Indicator
MarketProfile
🔑
🌐
✅
MarketProfile is a MetaTrader indicator that calculates the distribution of time at price for orderflow analysis. It displays statistical price distribution, control values and key price areas for daily trading sessions using color-coding. Compatible with multiple intraday timeframes according to author.

🤖
by joserrrm
Free
MetaTrader Indicator
VWAP Custom Position
🔑
🌐
✅
VWAP Custom Position is a MetaTrader indicator that calculates the Volume Weighted Average Price line with a user-defined, movable anchor point. Track trends and fair value dislocations using this VWAP indicator.

🤖
by dc2008
Free
MetaTrader Indicator
Histogram Bid and Ask prices
🔑
🌐
Histogram Bid and Ask prices is an Indicator for MetaTrader that plots a cumulative bid and ask price distributions and performs statistical analysis on High, Low, Open and Close prices. Optimized for smaller timeframes.

🤖
by mladen
Free
MetaTrader Indicator
Volume weighted awesome oscillator
🔑
🏅
Volume Weighted Awesome Oscillator is a free MetaTrader indicator that modifies Bill Williams’s Awesome Oscillator by using a volume-weighted moving average, combining price and volume analysis into one.

🤖
by scriptor
Free
MetaTrader Indicator
Volume_Accumulation
🔑
🌐
Volume_Accumulation is a MetaTrader Indicator that displays volume accumulation and distribution using a specialized formula. The indicator requires no inputs or settings, simply start using.

🤖
by barabashkakvn
Free
MetaTrader Indicator
Session Buy Sell Orders Volume
🔑
🌐
✅
🏅
Session Buy Sell Orders Volume is a free MetaTrader indicator that displays a histogram of total buy and sell order volumes for an easy identification of the dominant market side.
🤖
by barabashkakvn
Free
MetaTrader Indicator
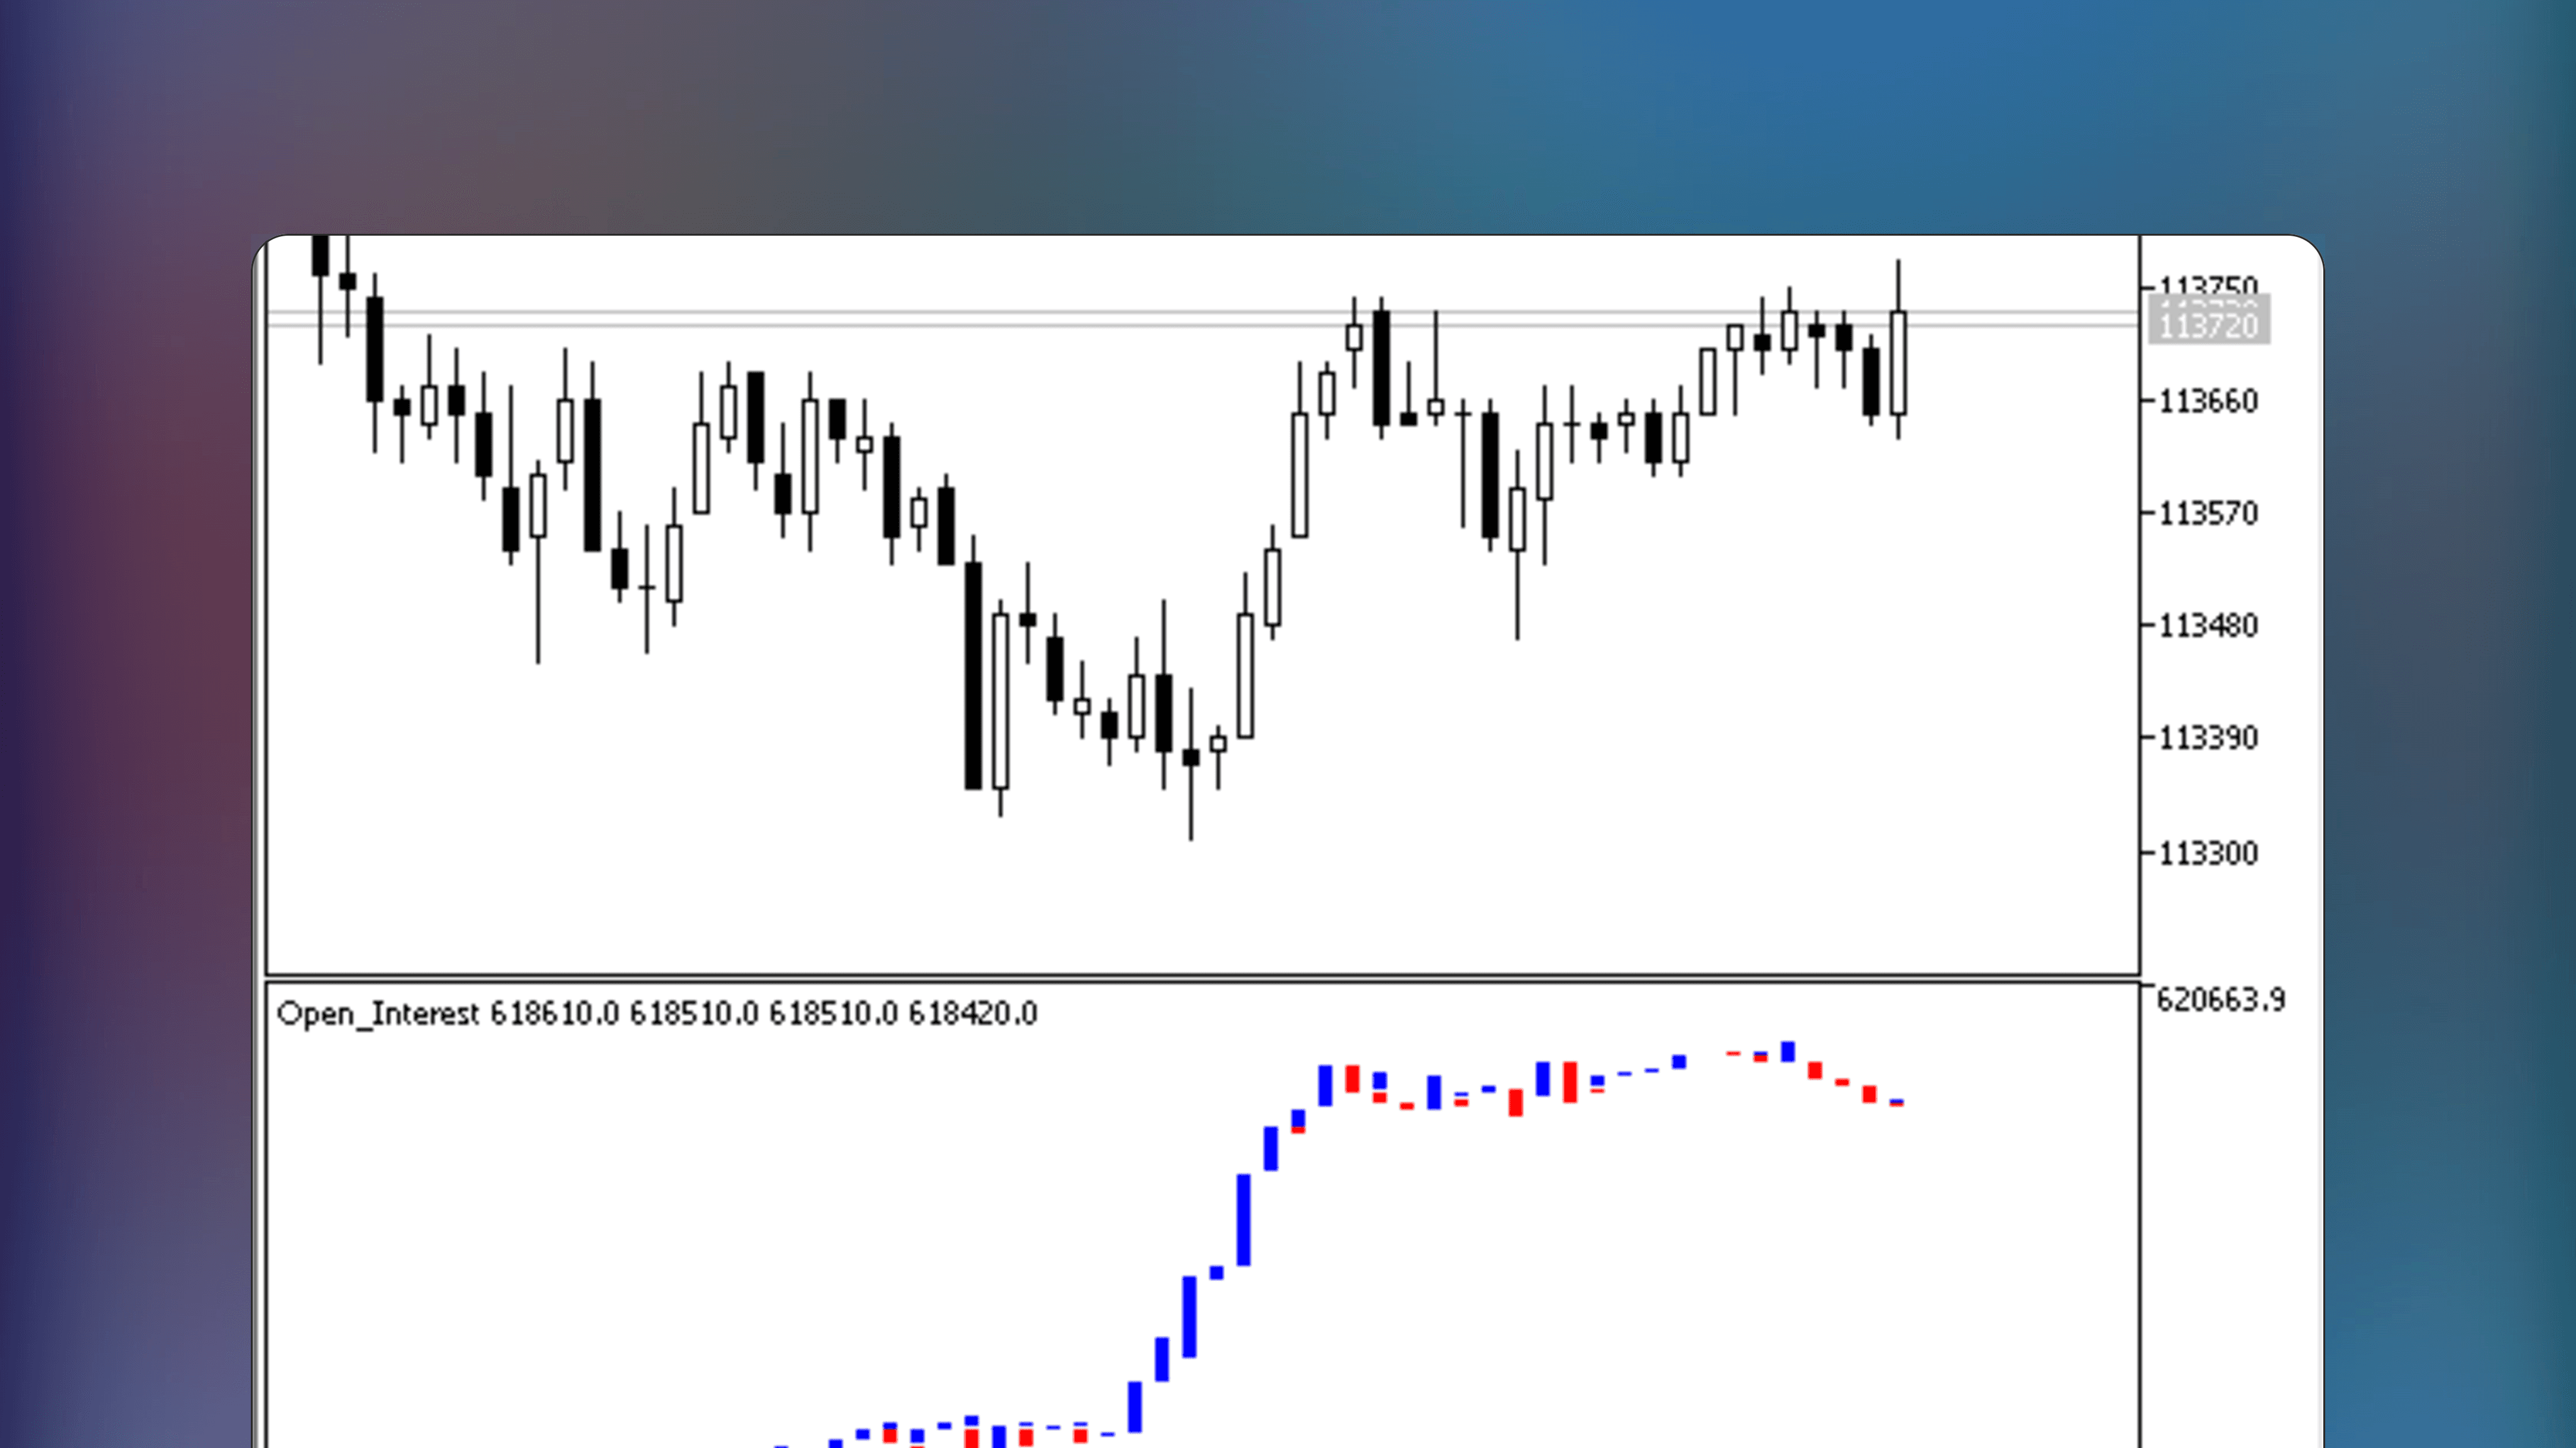
Open Interest
🔑
🌐
✅
🏅
Open Interest is a MetaTrader indicator that monitors the net value of open positions using blue and red candle colors, corresponding to increases or decreases in open interest.