From TradersList Editors

From TradersList Editors

Optimize your trading efficiency by using this indicator to instantly see stock positions relative to the VWAP directly in your watchlist.

Optimize your trading efficiency by using this indicator to instantly see stock positions relative to the VWAP directly in your watchlist.

ThinkOrSwim Indicator

ThinkOrSwim Indicator

VWAP Crosses, Format, Watchlist, Label, Scan Indicator for ThinkOrSwim

VWAP Crosses, Format, Watchlist, Label, Scan Indicator for ThinkOrSwim

ThinkorSwim interface displaying a watchlist column indicating if a stock is above or below the Volume Weighted Average Price and a price chart showing the VWAP line

by benten on ThinkOrSwim

ThinkorSwim interface displaying a watchlist column indicating if a stock is above or below the Volume Weighted Average Price and a price chart showing the VWAP line

by benten on ThinkOrSwim

🤖

🤖

VWAP Crosses, Format, Watchlist, Label, Scan For ThinkOrSwim

VWAP Crosses, Format, Watchlist, Label, Scan For ThinkOrSwim

VWAP Crosses is a free ThinkorSwim indicator that shows whether stocks in included in a watchlist are trading above or below the Volume Weighted Average Price.

VWAP Crosses is a free ThinkorSwim indicator that shows whether stocks in included in a watchlist are trading above or below the Volume Weighted Average Price.

Get on ThinkOrSwim

This indicator is available on ThinkOrSwim charting platform. Signing up for a free account and downloading ThinkOrSwim software is required.

Get on ThinkOrSwim

This indicator is available on ThinkOrSwim charting platform. Signing up for a free account and downloading ThinkOrSwim software is required.

🔑

Open Source

Listing has publically available source code that can be audited and modified as needed.

🔑

Open Source

Listing has publically available source code that can be audited and modified as needed.

💸

Free Access

All features of this listing are fully free to use with no pricing tiers. Simply start using.

💸

Free Access

All features of this listing are fully free to use with no pricing tiers. Simply start using.

Robust Theory

Concepts and theories mentioned in listing are based on generally approved and well established notions.

Robust Theory

Concepts and theories mentioned in listing are based on generally approved and well established notions.

🌐

Popular Topic

Concepts and theories mentioned in listing are popular topics in web search

🌐

Popular Topic

Concepts and theories mentioned in listing are popular topics in web search

Published by benten on ThinkOrSwim

Published by benten on ThinkOrSwim

VWAP as a Key Reference Level

The Volume Weighted Average Price (VWAP) represents the average price weighted by volume for the trading session. Institutional traders frequently use VWAP as a benchmark - stocks trading above it signal buyer control, while those below suggest seller dominance for the session.

Watchlist-Level Monitoring

Rather than checking each stock individually, this indicator applies VWAP analysis across your entire watchlist at once. A formatted column shows whether each symbol is above or below VWAP, letting you scan dozens of tickers in seconds to find the ones aligned with your directional bias.

Cross Detection and Labels

The indicator tracks when a stock crosses above or below VWAP during the session. These crosses often mark significant intraday turning points - a stock breaking above VWAP after a morning selloff, for example, frequently signals the start of a mean-reversion rally.

Scan Integration

Built-in scan compatibility means you can filter the entire market for VWAP-based conditions. Scan for stocks that just crossed above VWAP with increasing volume to build a real-time watchlist of momentum candidates, or below VWAP for short-side setups in a weak tape.

VWAP scan through your watchlist

VWAP scan through your watchlist

VWAP represents the average price weighted by volume for the session. This indicator applies VWAP analysis across your entire watchlist at once, showing whether each symbol is trading above or below this institutional benchmark.

VWAP represents the average price weighted by volume for the session. This indicator applies VWAP analysis across your entire watchlist at once, showing whether each symbol is trading above or below this institutional benchmark.

Reference Fair Value Across Symbols

Stocks above VWAP signal buyer control while those below suggest seller dominance. The formatted watchlist column shows this status for every ticker at a glance.

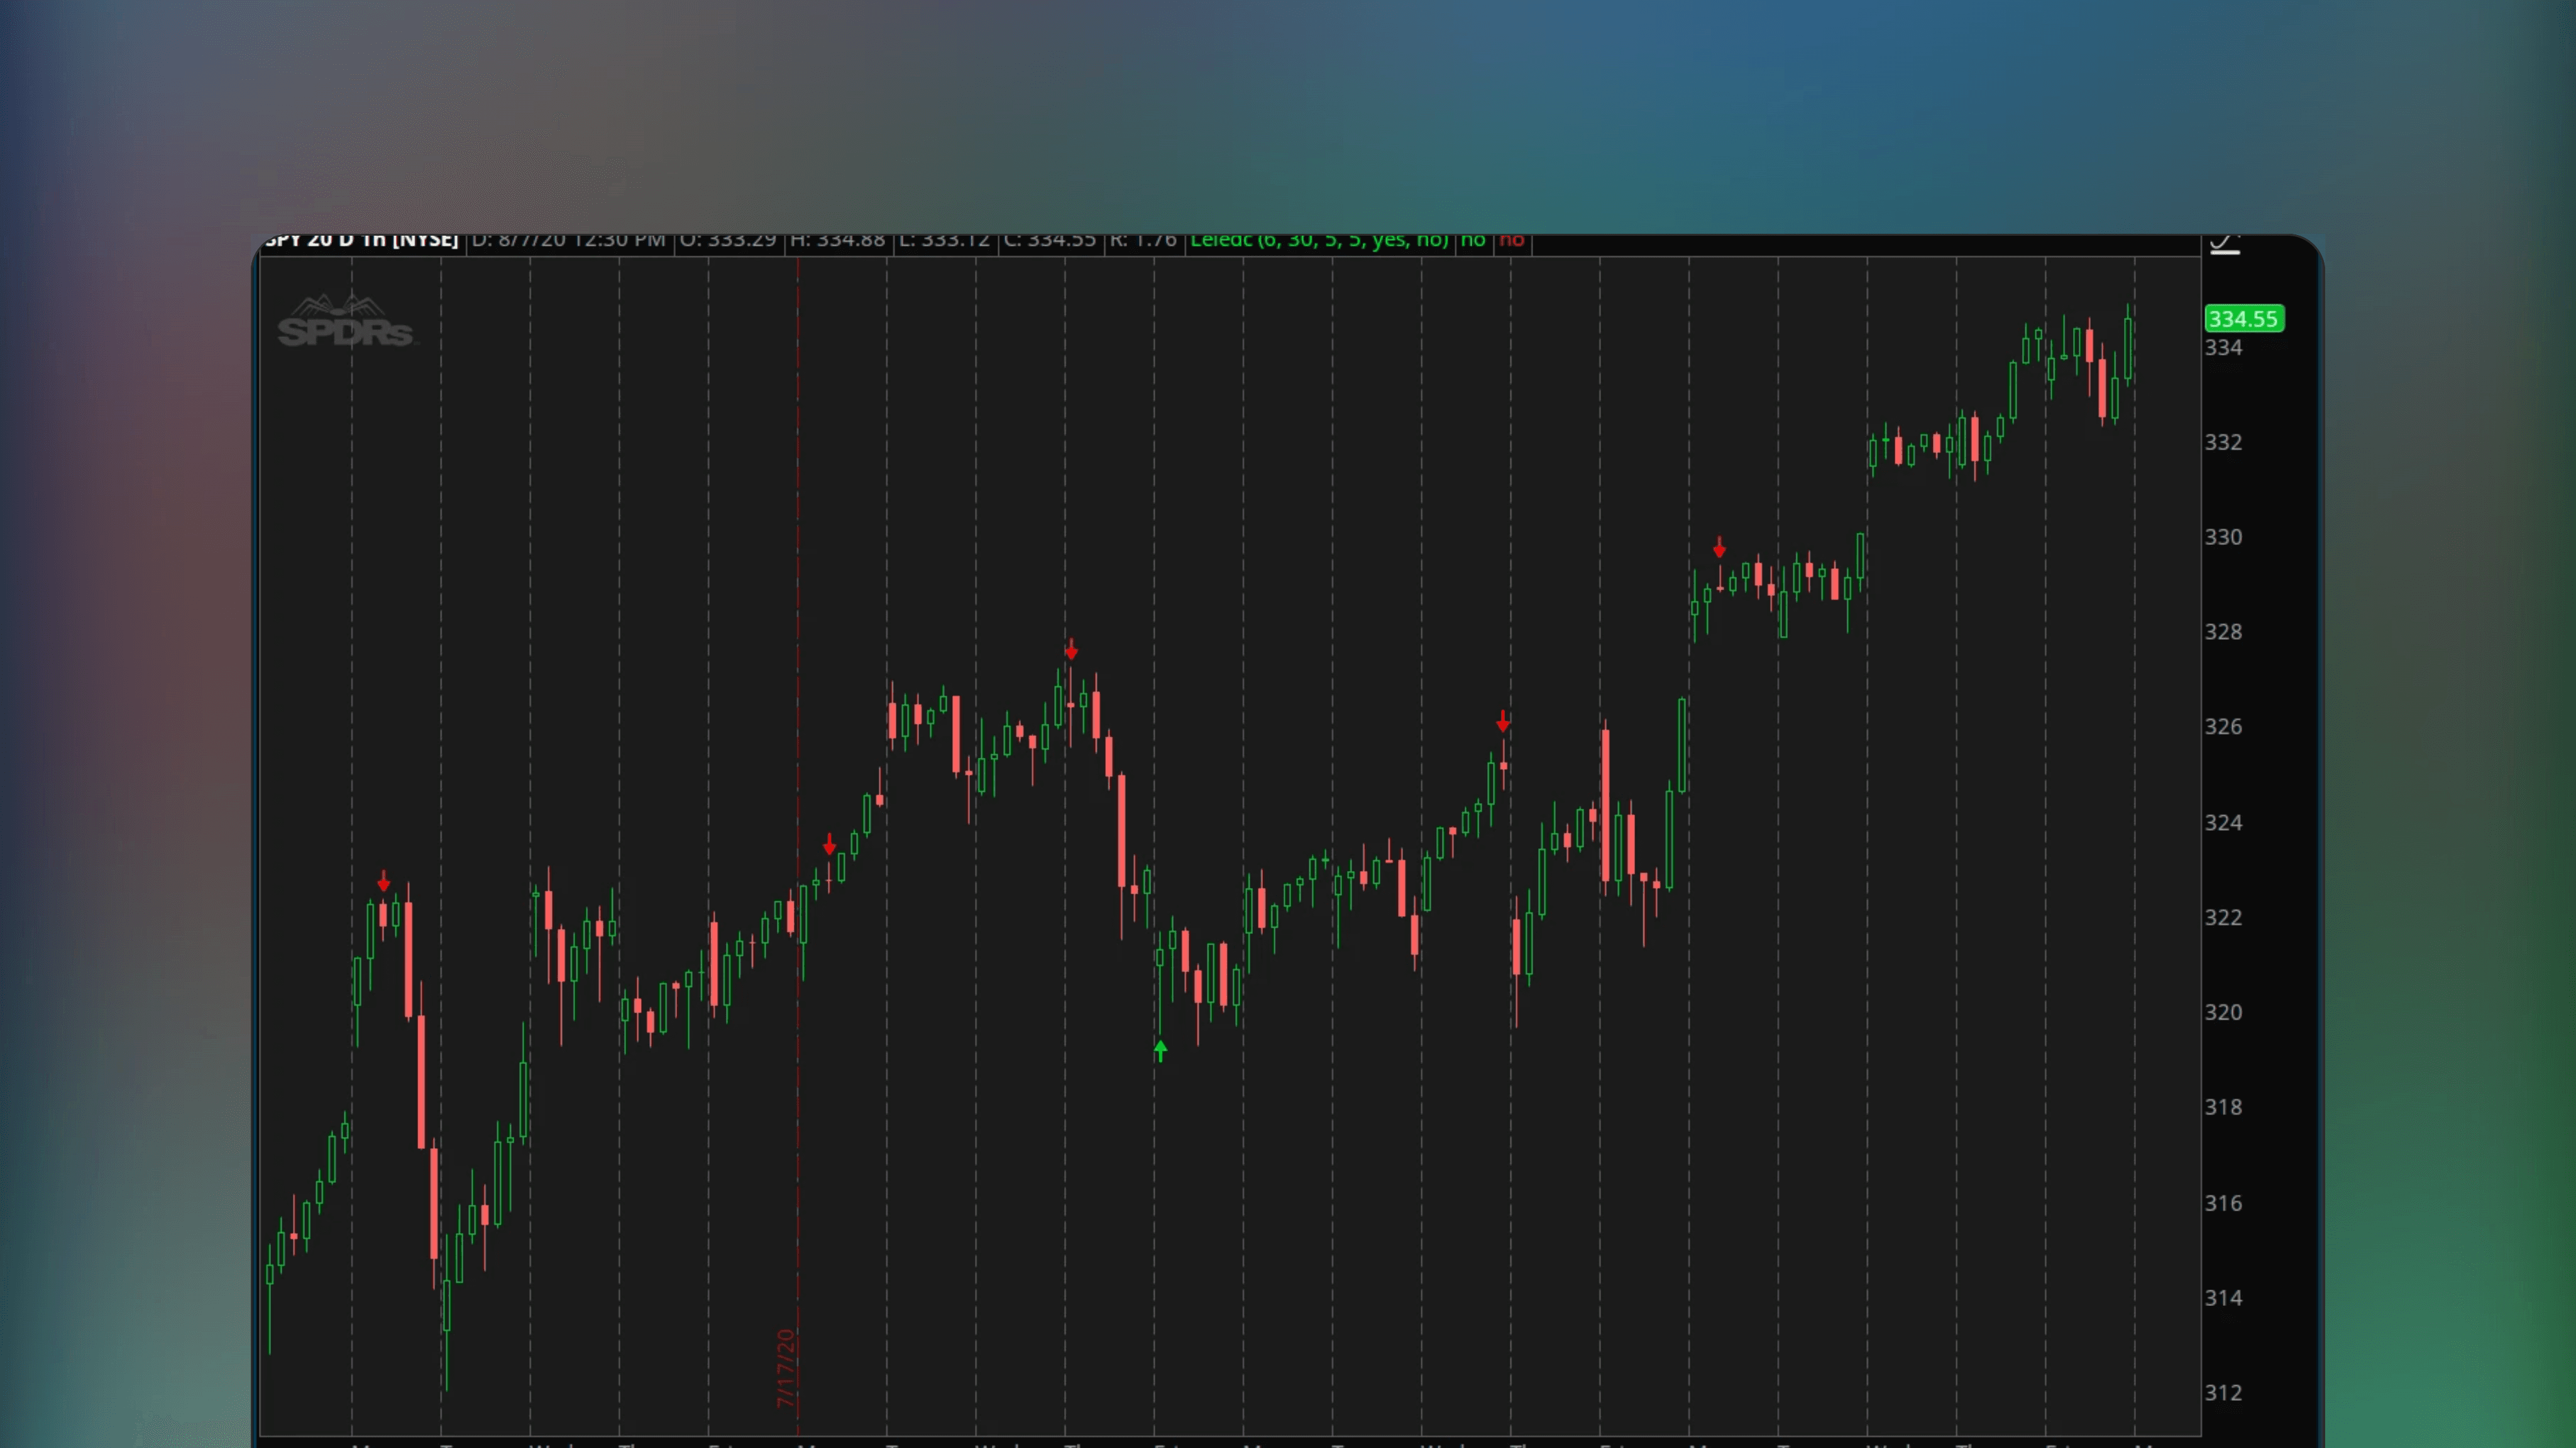
Spot Extended Deviations from VWAP

The indicator tracks when stocks cross above or below VWAP. These crosses often mark significant intraday turning points worth watching.

Filter Trend Candidates Efficiently

Built-in scan compatibility lets you filter the market for VWAP conditions. Find stocks that just crossed above VWAP with increasing volume for momentum plays.

Common Questions About VWAP Crosses

Common Questions About VWAP Crosses

VWAP is a widely followed benchmark for intraday traders, but questions arise around its proper application in watchlists and scans. Here are the most common concerns about using VWAP crosses effectively in ThinkorSwim.

VWAP is a widely followed benchmark for intraday traders, but questions arise around its proper application in watchlists and scans. Here are the most common concerns about using VWAP crosses effectively in ThinkorSwim.

Why does my VWAP watchlist column not show colors on certain stocks?

VWAP requires sufficient intraday volume data to calculate properly. Stocks with very low volume or those viewed outside regular trading hours may not display colors. Ensure extended hours data is enabled in your ThinkorSwim settings if trading premarket or aftermarket.

Does a VWAP cross guarantee a continuation move in that direction?

No. VWAP crosses mark inflection points but are not guaranteed signals. Stocks can whipsaw around VWAP, especially during choppy sessions. Many traders wait for a cross with volume confirmation or a retest before committing to a trade.

Can I scan for VWAP crosses across multiple timeframes simultaneously?

ThinkorSwim scans work on a single aggregation period per scan. You can create separate scans for different timeframes and combine results in a watchlist, or use a multi-timeframe indicator to display VWAP status from various periods on one chart.

🌐

🌐

Web sentiment

Web sentiment

Web users feel positive about VWAP Crosses, Format, Watchlist, Label, Scan for ThinkorSwim, appreciating its functionality amid technical frustrations, with a supportive community easing coding issues.

Web users feel positive about VWAP Crosses, Format, Watchlist, Label, Scan for ThinkorSwim, appreciating its functionality amid technical frustrations, with a supportive community easing coding issues.

Source: Online Discussion

Source: Online Discussion

Source: Online Discussion

✍️

✍️

TradersList Reviews (6)

TradersList Reviews (6)

TradersList Community has given this listing five stars, indicating great trust, extraordinary utility value and benefit for traders' toolkit. This listing is among the top ones on TradersList.

TradersList Community has given this listing five stars, indicating great trust, extraordinary utility value and benefit for traders' toolkit. This listing is among the top ones on TradersList.

⭐️

⭐️

⭐️

⭐️

⭐️

Source: TradersList Reviews

Source: TradersList Reviews

Bookmark

Saved here

🤖

Get Indicator

Find Indicator

Review

Review Indicator

✍️

⭐️

⭐️

⭐️

⭐️

⭐️

3

Comments

Read on Telegram

Find More

Similar Indicators

Listing by third party publisher. Not financial advice.

Risk Disclosure

Share Listing

🤖

🤖

Get Indicator

Get Indicator

Find Indicator

Find Indicator

✍️

Review

Review

Review Indicator

Review Indicator

⭐️

⭐️

⭐️

⭐️

⭐️

3

3

Comments

Comments

Read on Telegram

Read on Telegram

Saved here

Bookmark

Listing by third party publisher. Not financial advice.

Listing by third party publisher. Not financial advice.

Risk Disclosure

Risk Disclosure

Share

🤖

3

Get Notified

New Listings Weekly

🤖

3

Get Notified

New Listings Weekly

🤖

3

Get Notified

New Listings Weekly

✍️

By Author

More by benten

🔥

New Listings

Featured this week

🤖

Similar Listings

Traders also viewed

All

ThinkOrSwim interface displaying the SqueezeMetrics Dark Pools Indicator on a price chart with signals for long entries above 0.45 and sell points below 0.39

🤖

by deusmecanicus

Free

ThinkOrSwim Indicator

SqueezeMetrics Dark Pools Indicator For ThinkOrSwim

🔑

SqueezeMetrics Dark Pools Indicator for ThinkorSwim is a free indicator that uses the Dark Index (DIX) for generating long and short signals, based on statistical analysis and backtested data.

ThinkorSwim interface displaying a sector rotation statistics indicator with normalized line graphs plotting the relative performance of major sector ETFs like XLK, XLF and XLE to visualize capital flow between market sectors

🤖

by markos

Free

ThinkOrSwim Indicator

Sector Rotation Indicator For ThinkOrSwim

🔑

🌐

Sector Rotation is a ThinkorSwim indicator that visually analyzes shifting investment allocations between sectors, revealing outperforming and underperforming themes.

ThinkOrSwim watchlist column displaying histogram color coding and numerical values to track squeeze events and momentum direction

🤖

by dunpeal

Free

ThinkOrSwim Indicator

Squeeze Watchlist Column - Histrogram Colors, For ThinkOrSwim

🔑

🌐

Squeeze Watchlist Column is a free ThinkOrSwim indicator that visualizes market squeeze events with histogram colors, counts amount of squeezes, tracks their timing across different timeframes and organizes watchlist metrics numerically for easy monitoring.

ThinkOrSwim price chart featuring the FlowAlgo Dark pool and Option Flow indicator displaying visual markers for institutional dark pool orders and option flow data points

🤖

by benten

Free

ThinkOrSwim Indicator

FlowAlgo Dark pool and Option Flow For ThinkOrSwim

🔑

🌐

🏅

FlowAlgo Dark pool and Option Flow for ThinkorSwim is a ThinkOrSwim indicator that visualizes dark pool and option trading activities using manual, hardcoded data.

ThinkOrSwim chart interface showing the Expected Move Probability Cone indicator projecting a widening parabolic range forward from current price levels based on implied volatility and time to expiration

🤖

by halcyonguy

Free

ThinkOrSwim Indicator

Expected Move, Probability Cone For ThinkOrSwim

🔑

🌐

Expected Move, Probability Cone For ThinkOrSwim is an Indicator that calculates expected market moves using price, implied volatility and days to expiratio. Visually displayed using a probability cone.

ThinkOrSwim chart displaying the Triple VWAP indicator with upper and lower bands representing one two and three standard deviations around the central volume-weighted average price line

🤖

by benten

Free

ThinkOrSwim Indicator

Triple VWAP Indicator For ThinkOrSwim

🔑

Triple VWAP Indicator for ThinkorSwim VWAP by adding 1 to 3 standard deviation bands alongside VWAP, providing a more detailed view of extreme deviations based on market volatility.

ThinkOrSwim platform interface displaying the Unusual Option Activity Scanner with a list of option contracts with volume of 10,000 or more and strike prices and expiration dates

🤖

by theelderwand

Free

ThinkOrSwim Indicator

Unusual Option Activity Scanner For ThinkOrSwim

🔑

🌐

Unusual Option Activity Scanner for ThinkorSwim is an Indicator that scans option contracts with volumes of 10,000 or more to identify unusual activity. Fine-tune settings according to your needs.

ThinkorSwim trading chart featuring the Implied Volatility Rank and Percentile indicator with lines representing the 52-week high and low ranges

🤖

by camelotnite

Free

ThinkOrSwim Indicator

Implied Volatility (IV) Rank & Percentile For ThinkOrSwim

🔑

🌐

Implied Volatility (IV) Rank & Percentile for ThinkOrSwim displays implied volatility (IV) rank and percentile for options, providing insights into how options are priced in a market.

🤖

by tradecombine

Free

ThinkOrSwim Indicator

JBoyd_TDA Seasons Column For ThinkOrSwim

🔑

🌐

JBoyd_TDA Seasons Column For ThinkOrSwim displays market trend states using seasonal terms like winter and summer, enabling a quick an intuitive read for different trending states and their magnitude.

Discover trading edge

Discover trading edge

Indicators, Platforms & Education

Indicators, Platforms & Education

Browse Listings

Browse Listings

or

Open Random

Open Random

TradersList

Discover trading edge

Follow

Disclaimer

Our goal is to achieve greater transparency, guidance and safety in trading and investing by providing means to discover, research and discuss trading/investing related sites/services.

Content provided on this site is not financial advice, meant for educational purposes only. TradersList does not endorse or guarantee any result for listed sites/services. Do your own research.

Read full disclaimer