


Published by Exocharts


Analyze order flow for any market
Use volume profiles and footprints across crypto exchanges and legacy markets. The same analytical framework applies regardless of the instrument.
Create custom order flow templates
Design workspace layouts with your preferred combination of DOM, footprint and profile tools. Save configurations for different trading approaches.
Access tick-level volume data
The platform provides granular trade data showing volume at each price tick. See exactly how much traded at every level, not just per candle.
What is a volume footprint chart?
A footprint breaks each candle into traded volume at every price level, showing how much was bought versus sold. This granular view reveals whether moves are driven by aggressive buyers, passive sellers or a combination.
How do I use the DOM ladder for trading?
The DOM displays live order book with bid and ask quantities at each tick. Monitor for large orders being placed or pulled. Execute trades directly from the ladder for fast, precise order management during active trading.
Is there a difference between web and desktop versions?
The web version requires no installation and works from any browser. The desktop client may offer additional performance and features. Choose based on your needs for portability versus dedicated setup.
⭐️
⭐️
⭐️
⭐️
⭐️


🔥
New Listings
Featured this week


📟
Similar Listings
Traders also viewed
All

📟
Free*
Technical Analysis Platform
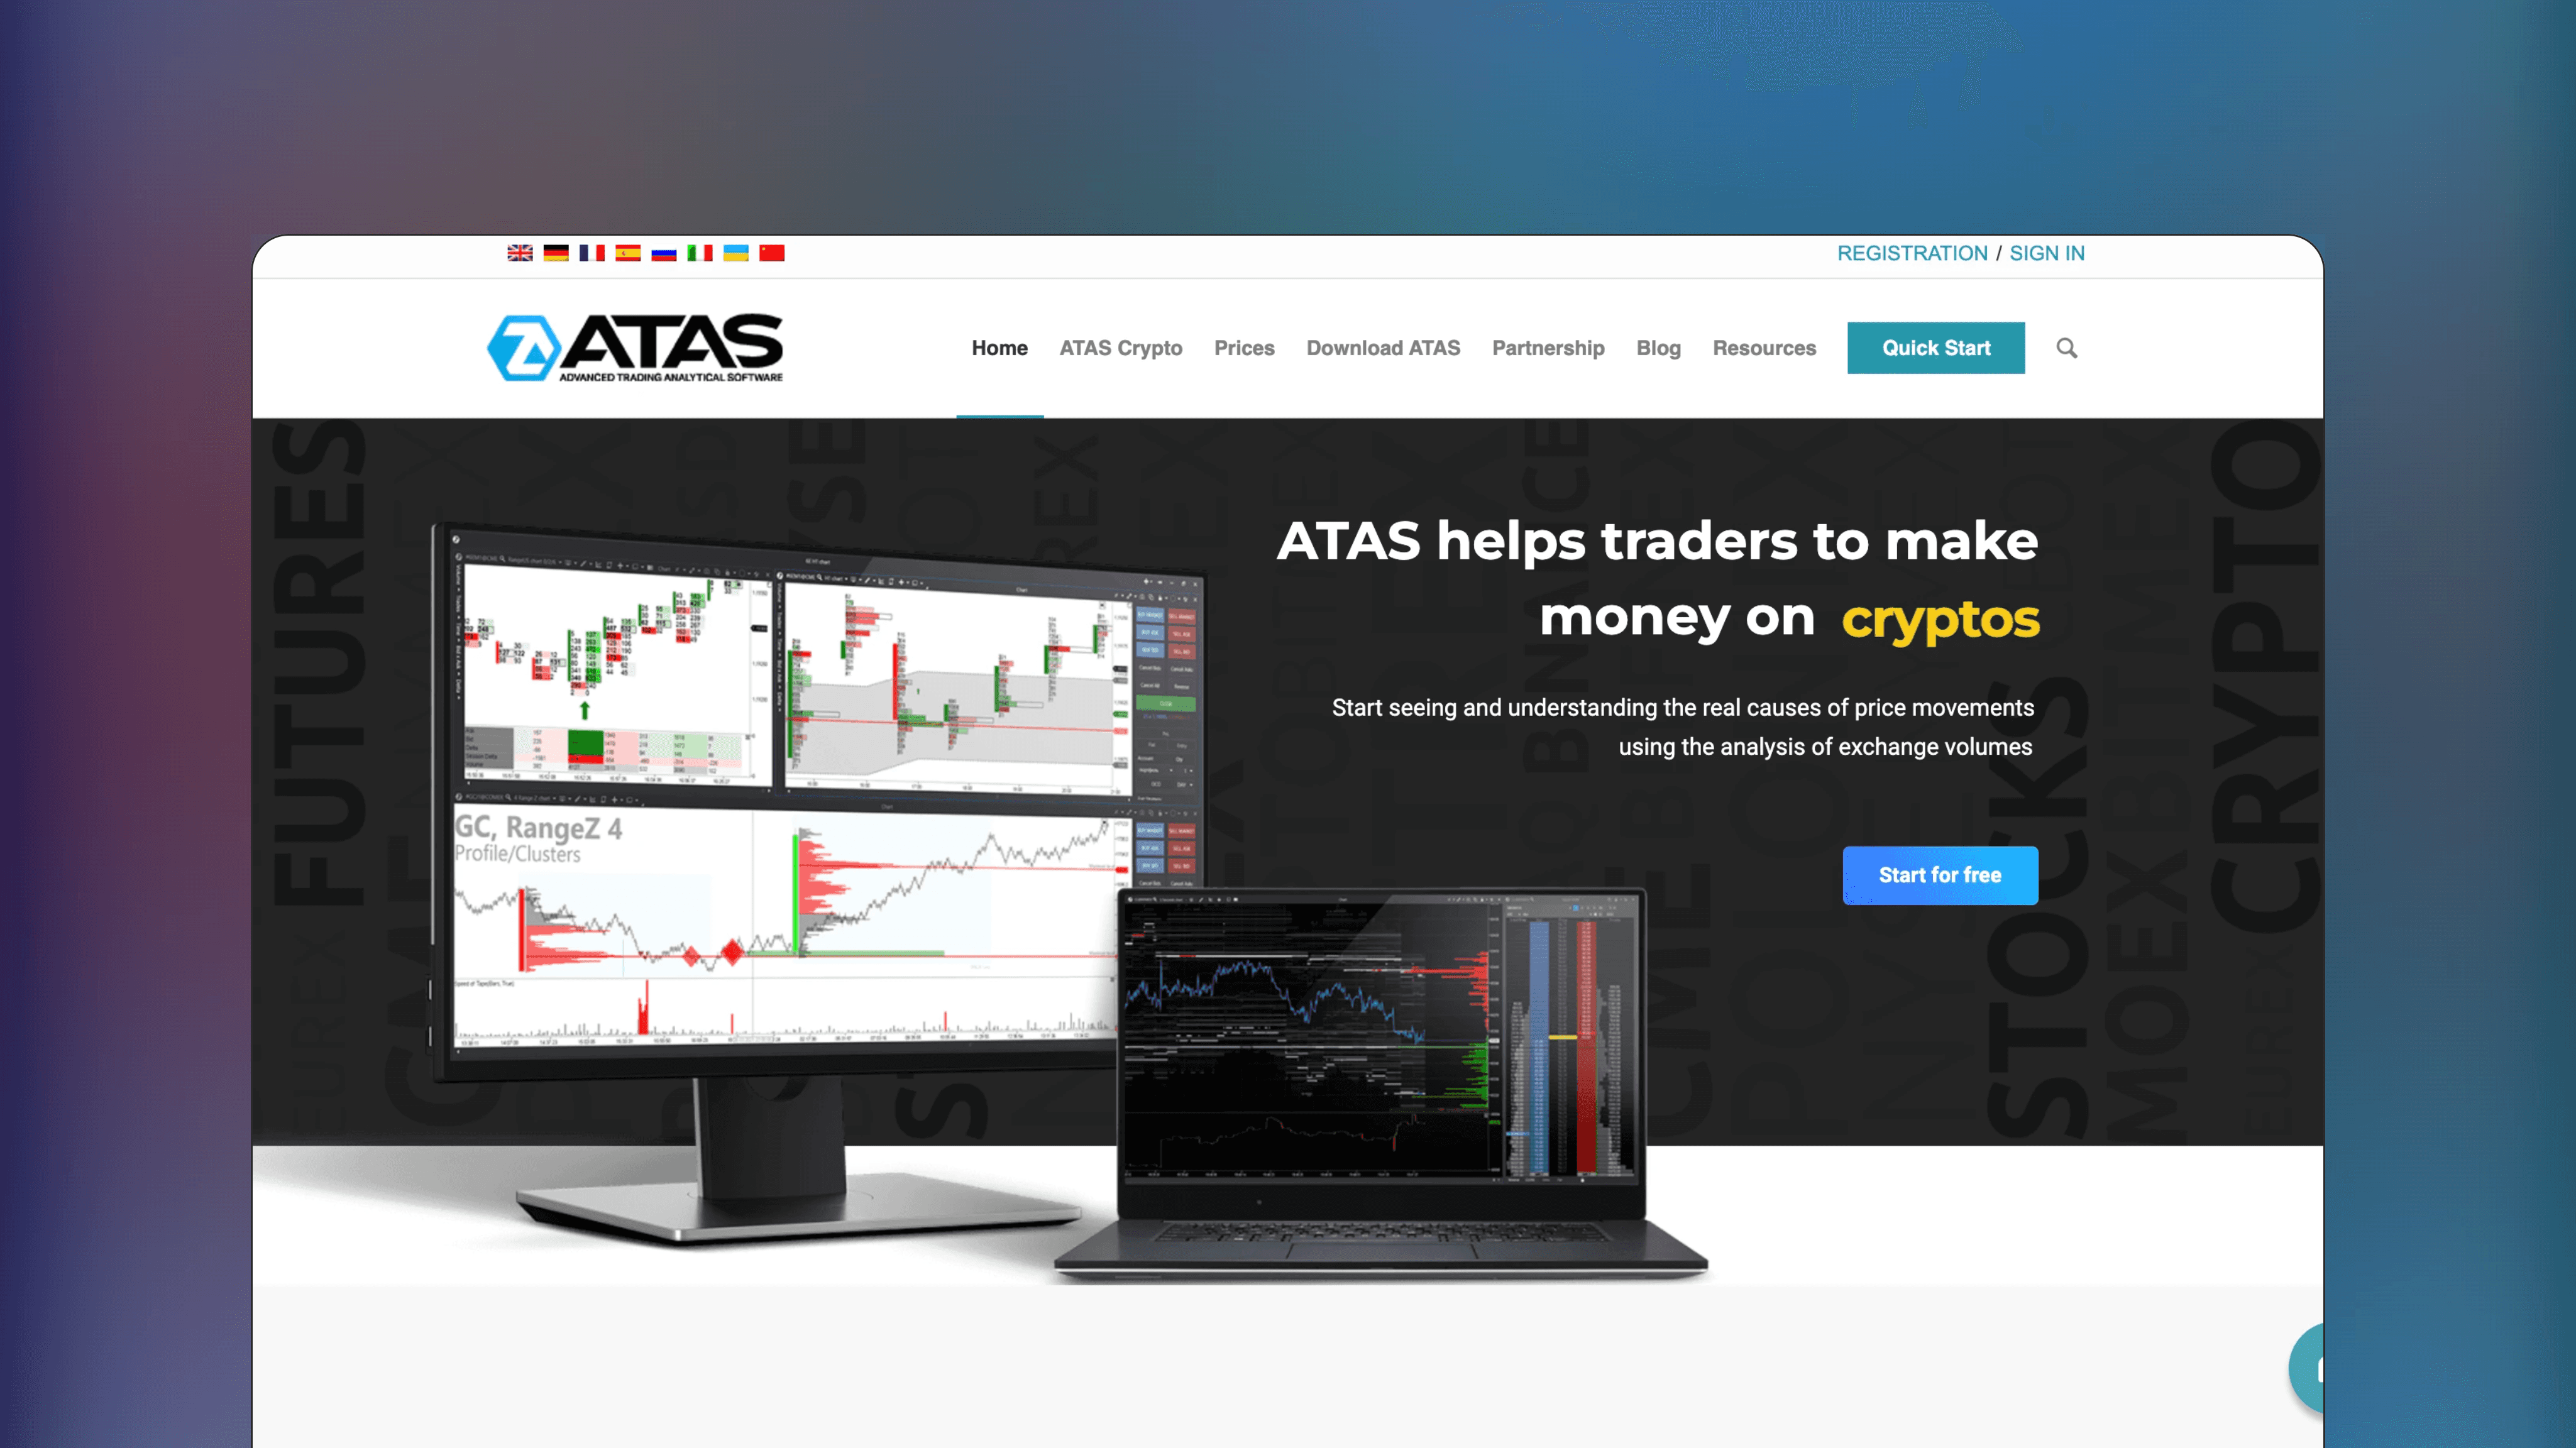
ATAS
🌐
✅
🏅
ATAS is a platform offering advanced orderflow tools for analyzing stocks, futures and cryptocurrencies. ATAS features a variety of tools, such as liquidity heatmaps, liquidation bubbles, and volume footprints.
📟
Paid
Technical Analysis Platform
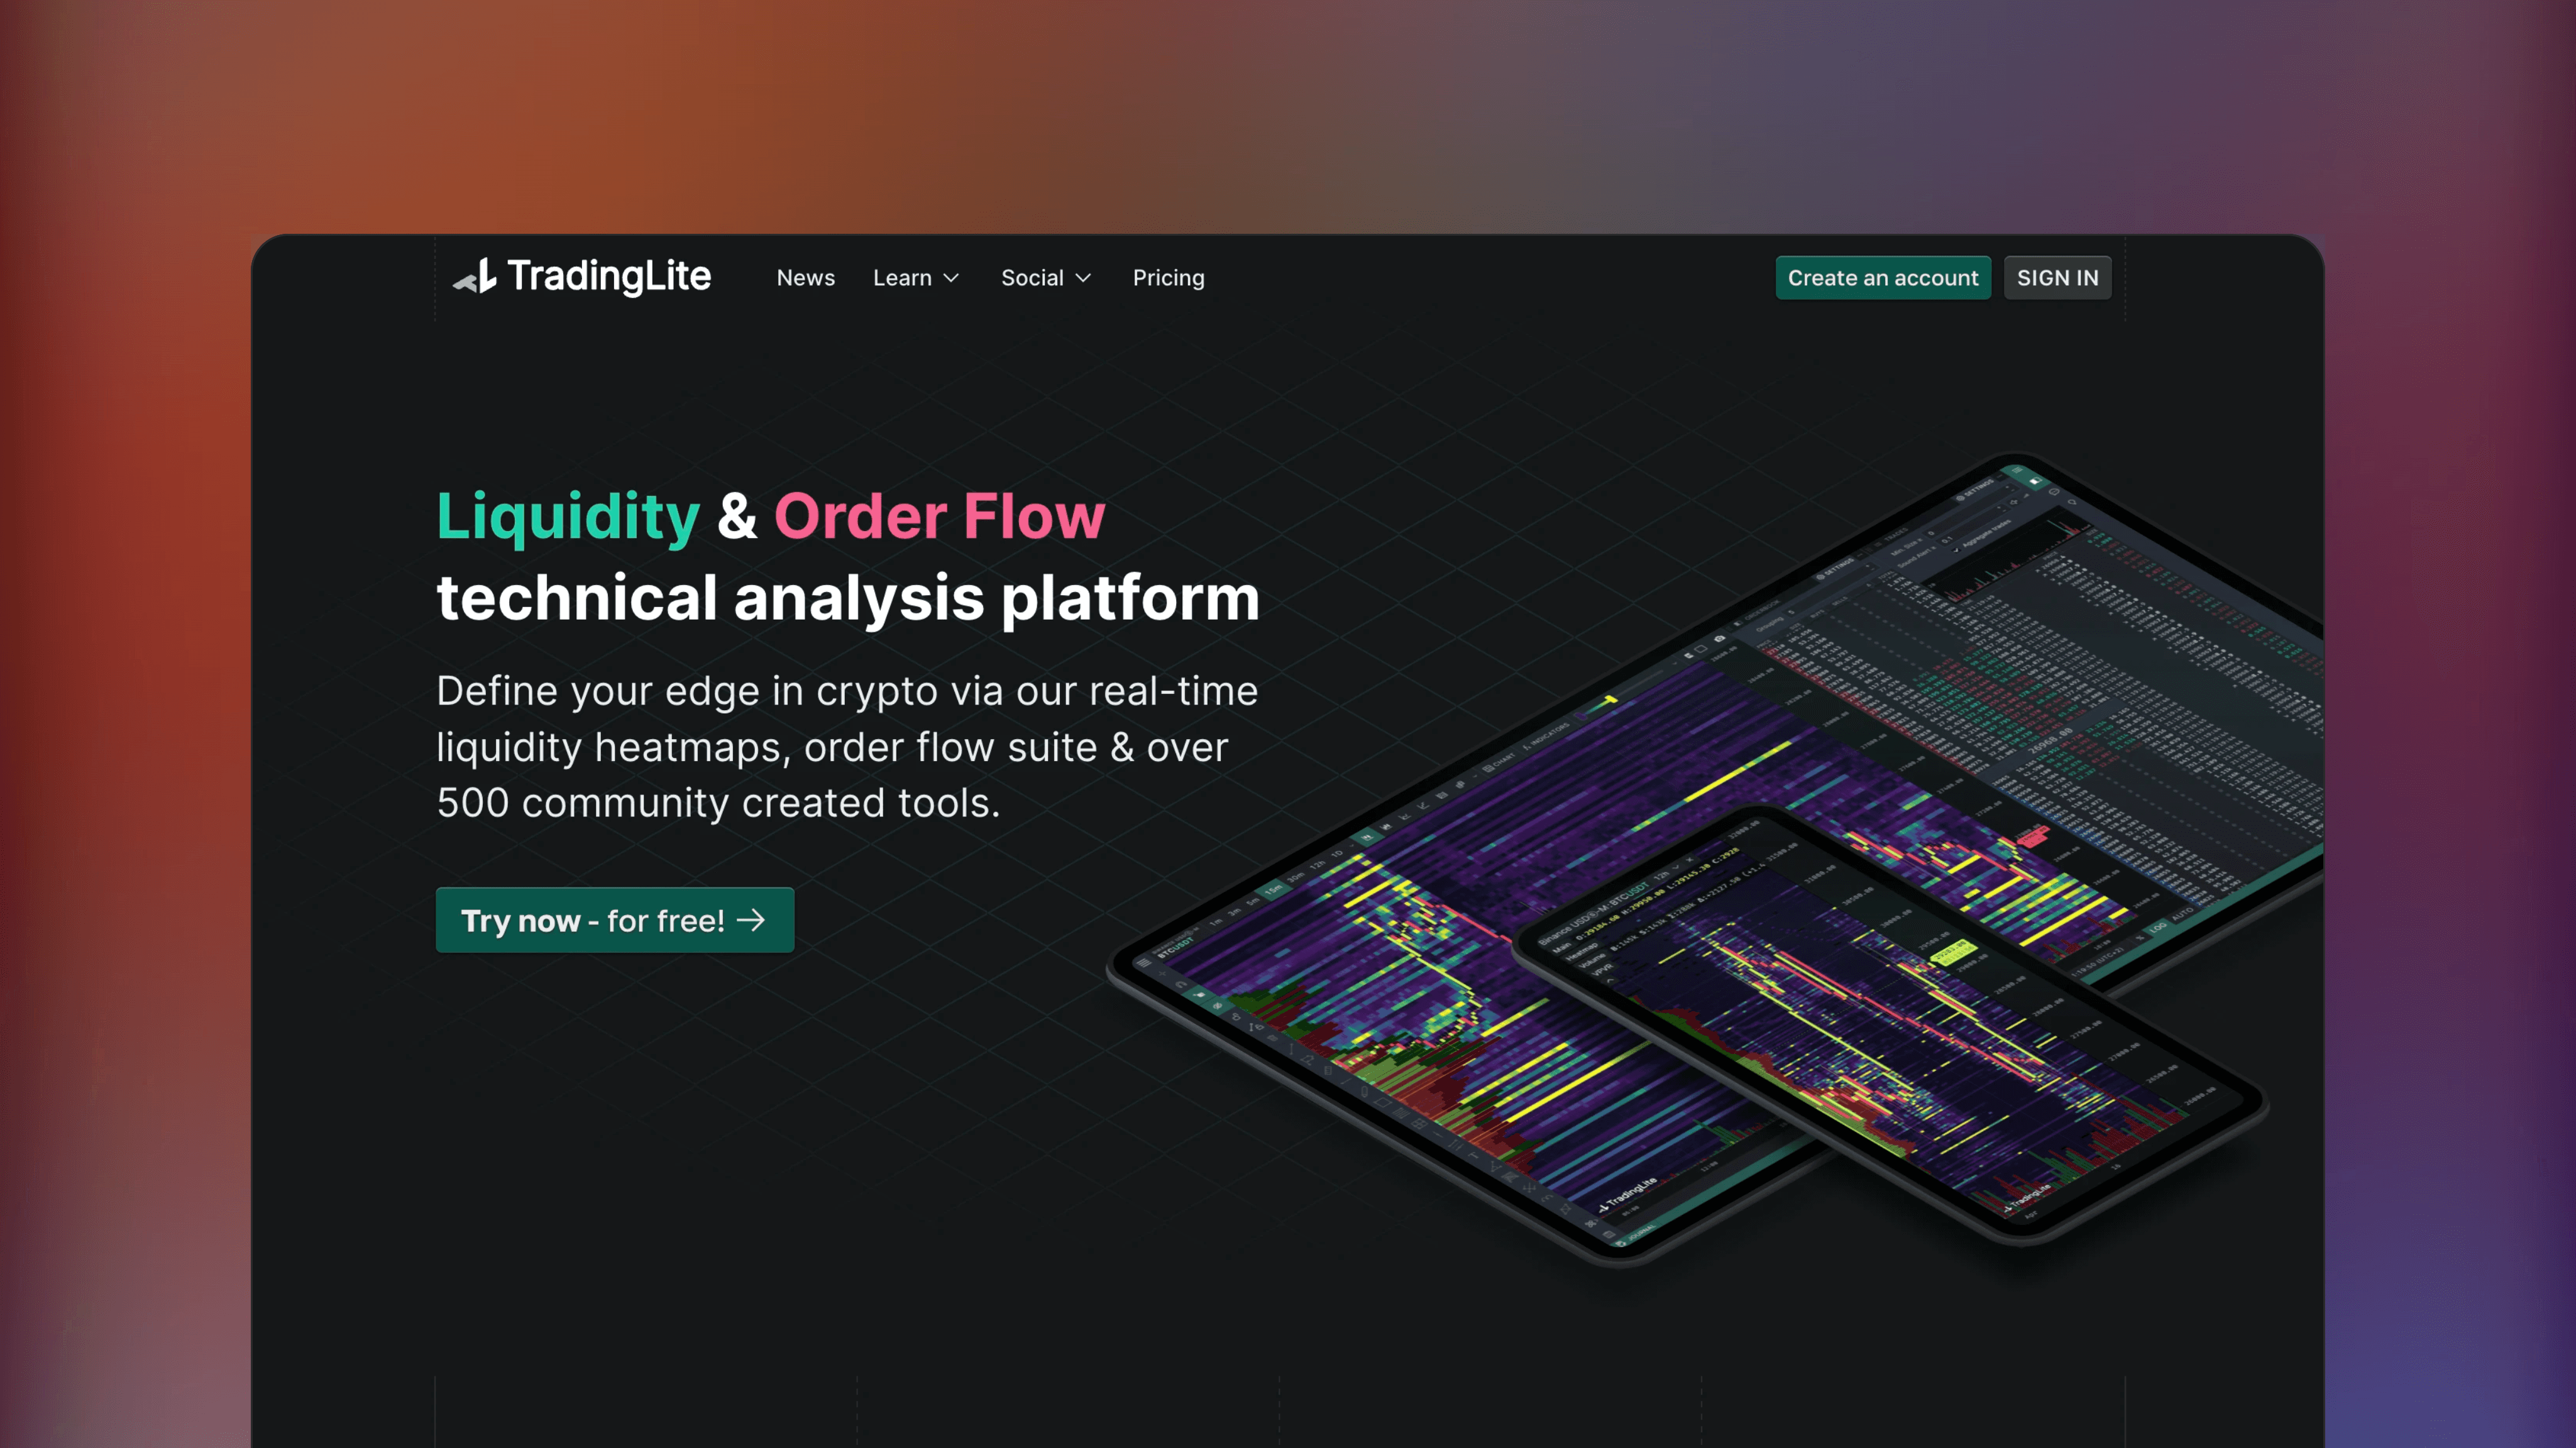
TradingLite
🌐
✅
🏅
TradingLite is a web-based platform for cryptocurrency orderflow analysis, offering advanced tools like liquidity heatmaps, volume profiles, footprints and hundreds of community created indicators.
📟
Free*
Technical Analysis Platform
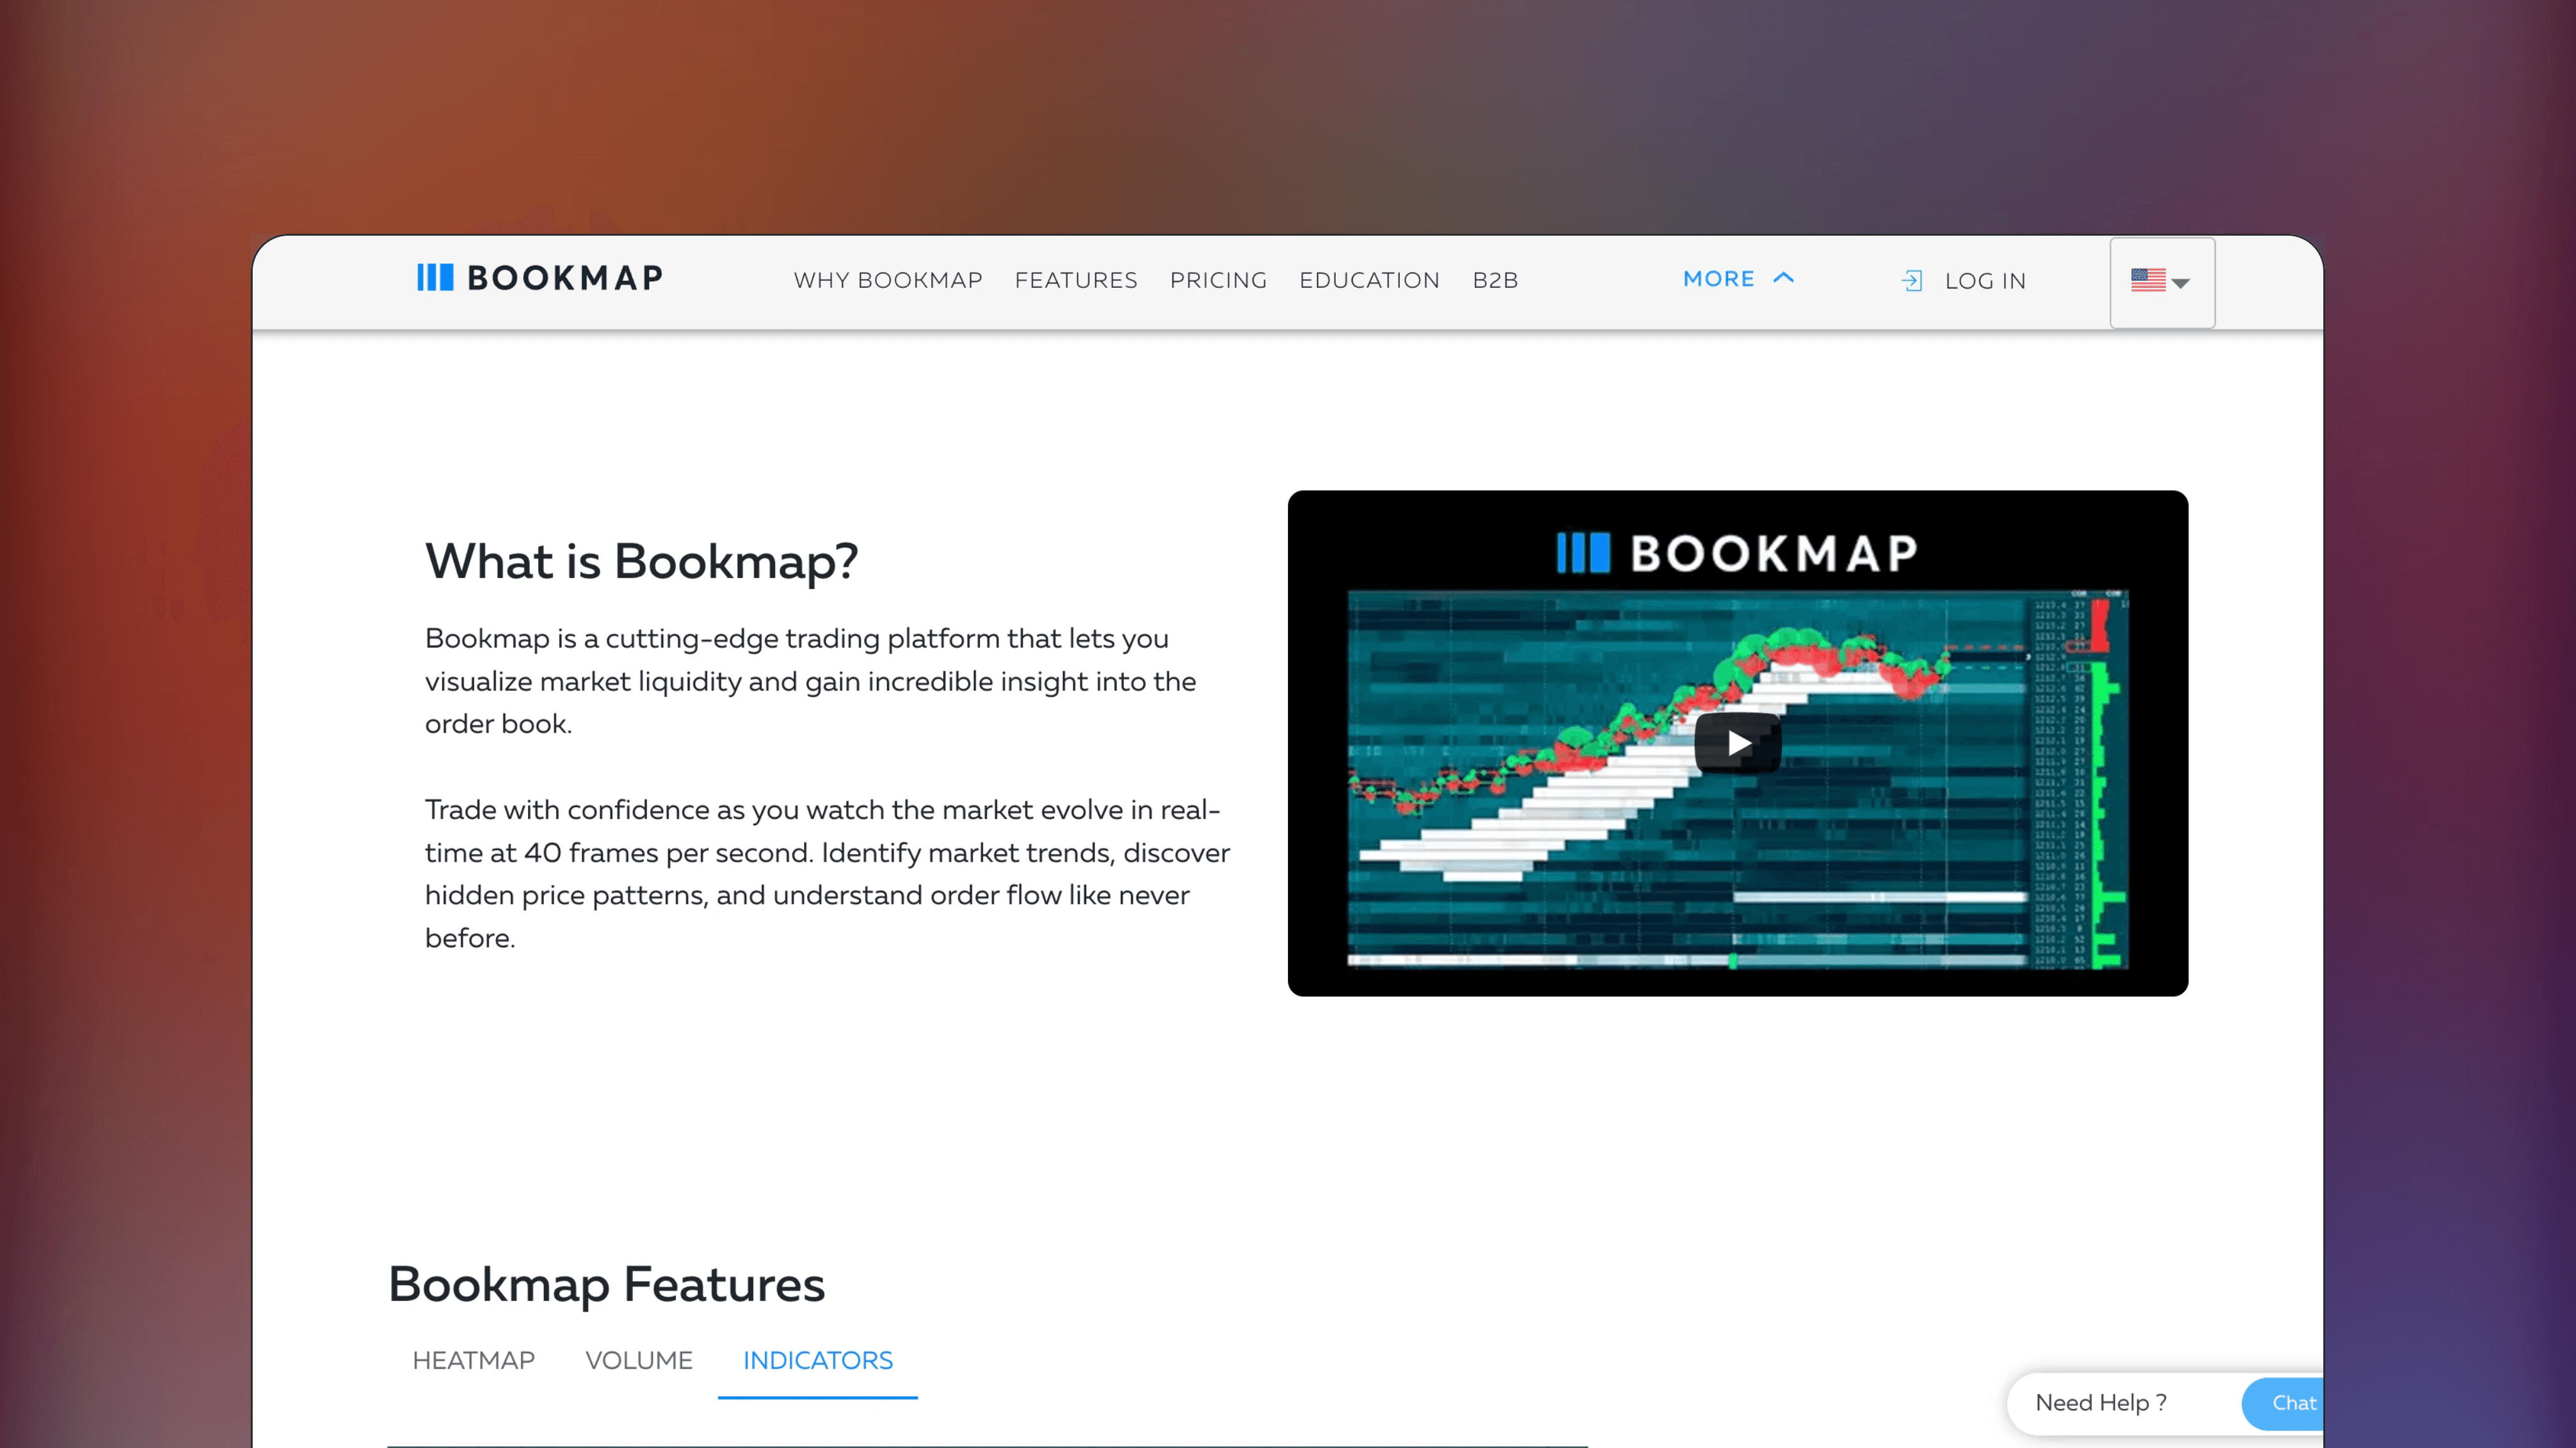
Bookmap
🌐
✅
🏅
Bookmap hosts a range of advanced order flow tools like liquidity heatmaps, liquidation bubbles and volume profiles with real-time and accurate orderbook data.
📟
Paid
Technical Analysis Platform
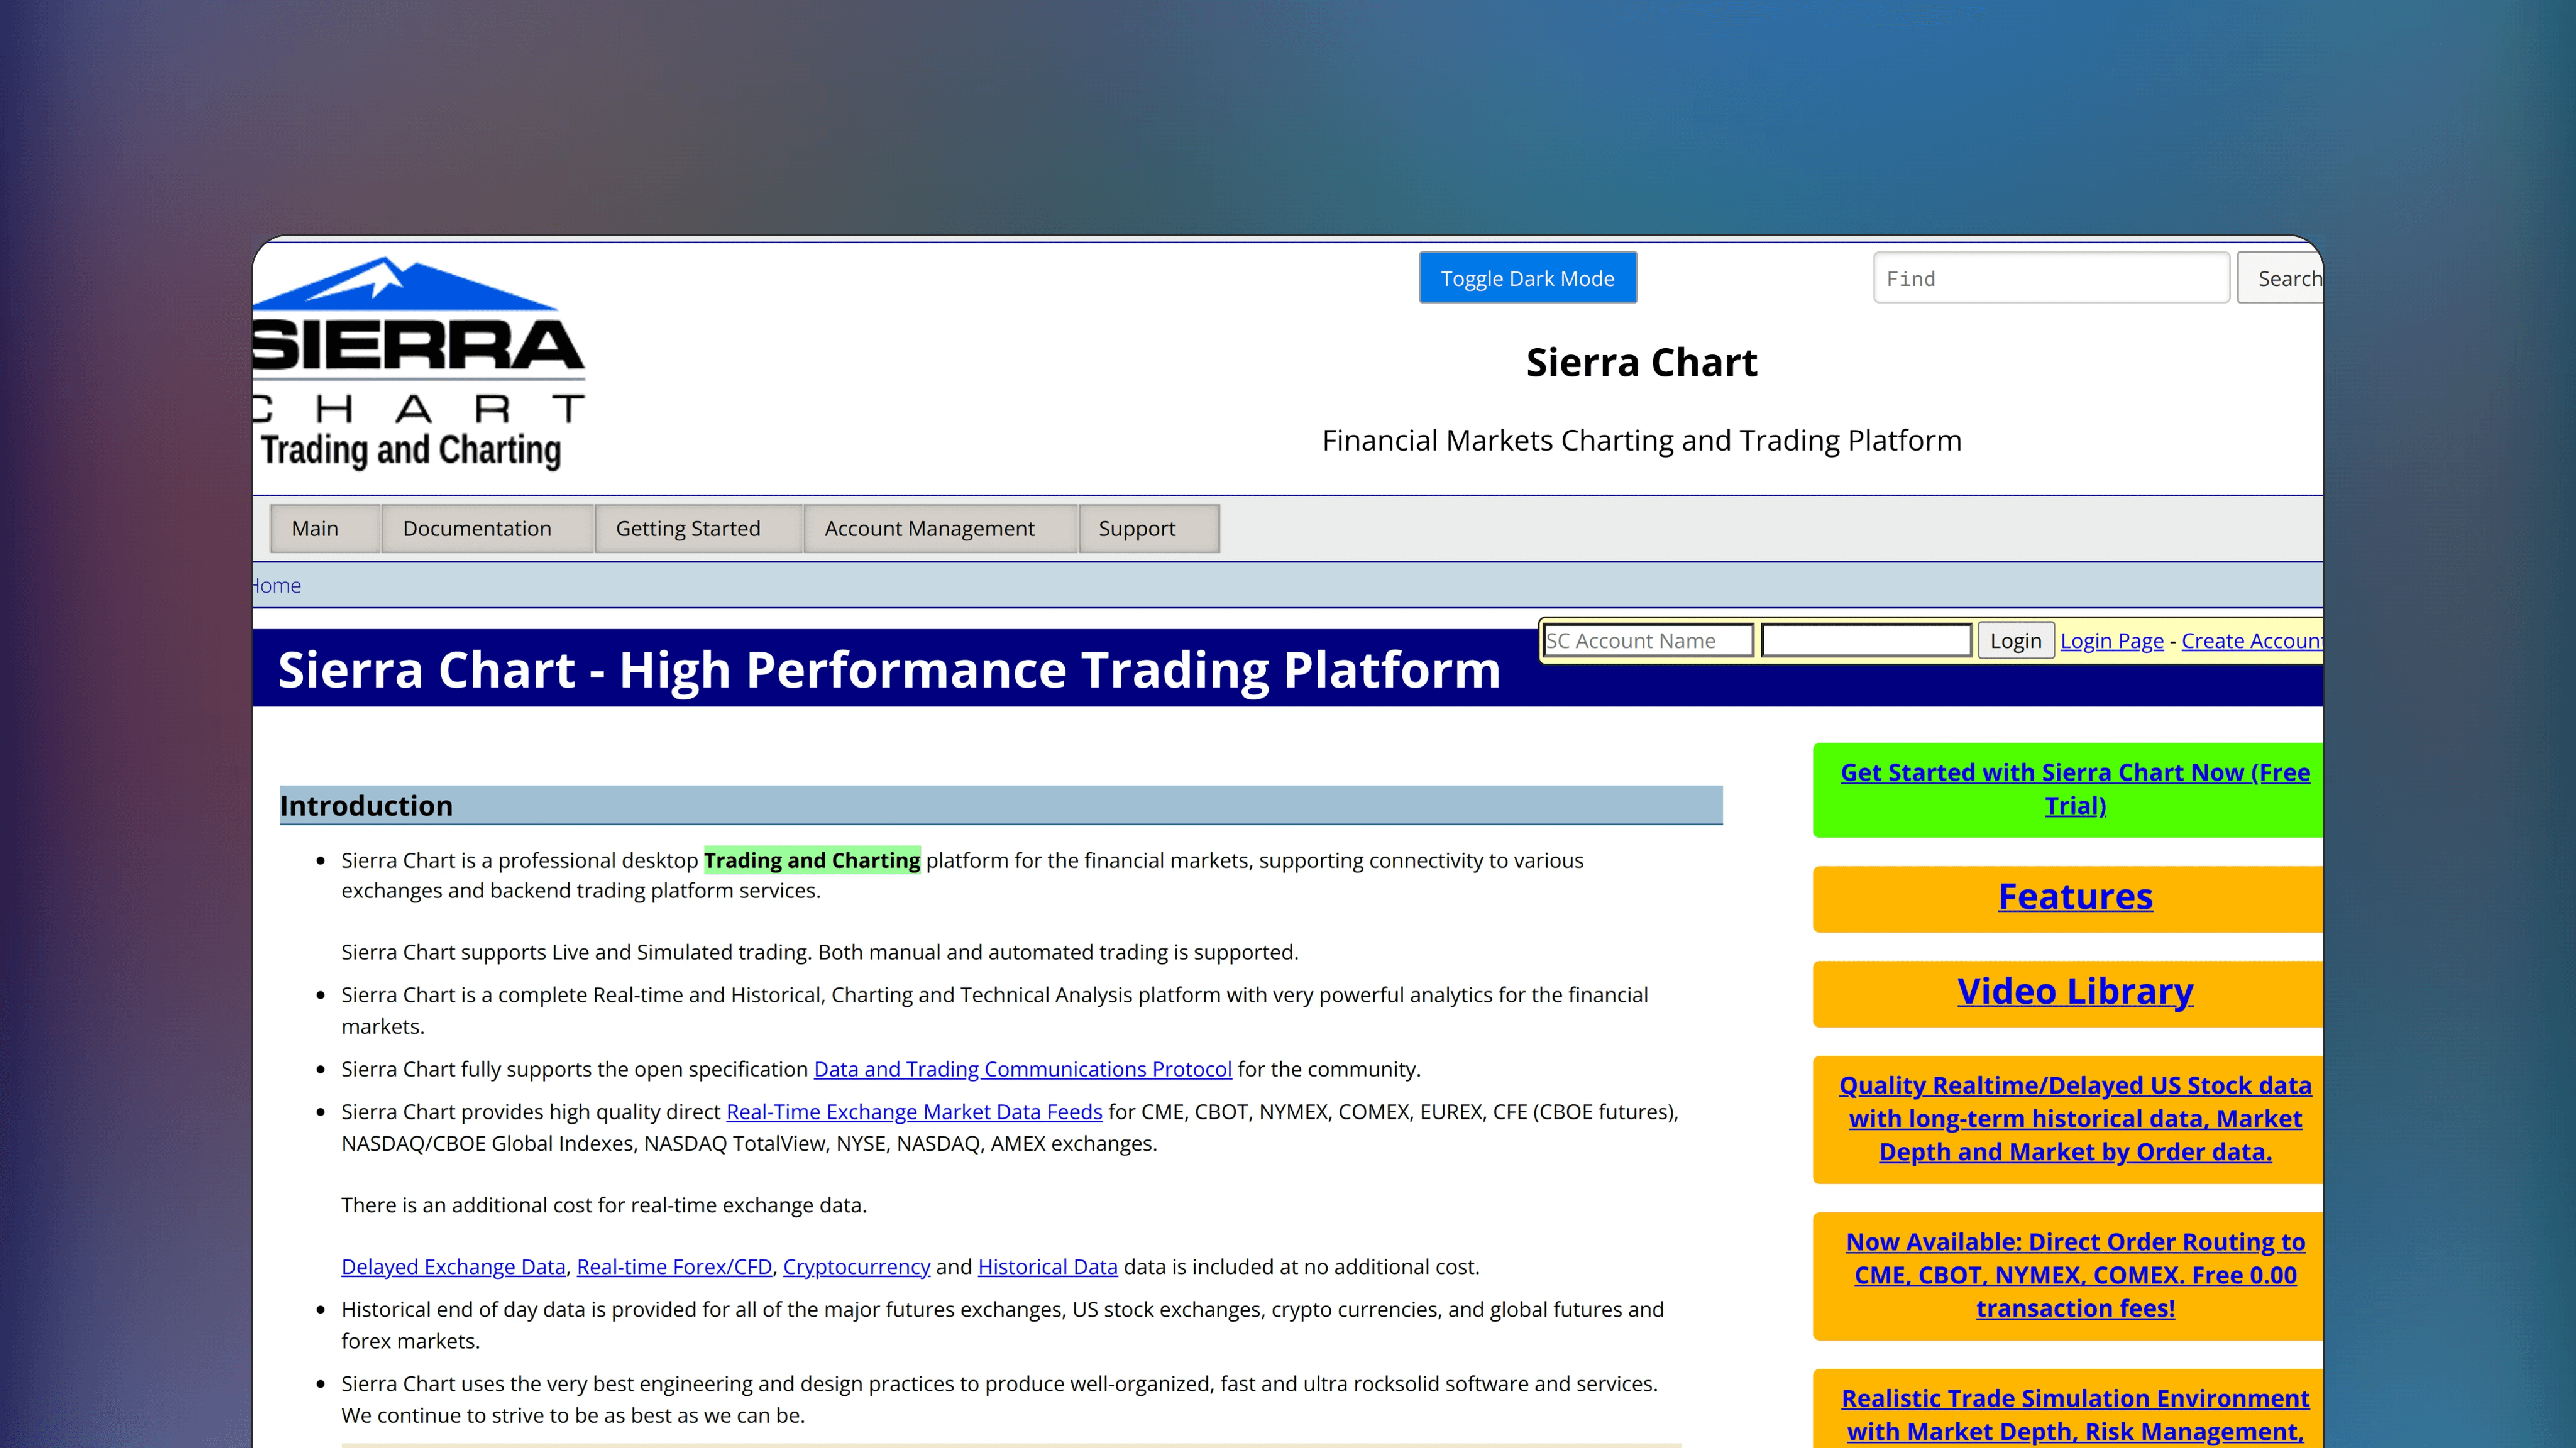
Sierra Charts
🌐
✅
🏅
Sierra Charts is a desktop trading platform offering advanced orderflow tools like cumulative volume delta, volume profile and footprints based on true order book data.
📟
Paid
Technical Analysis Platform
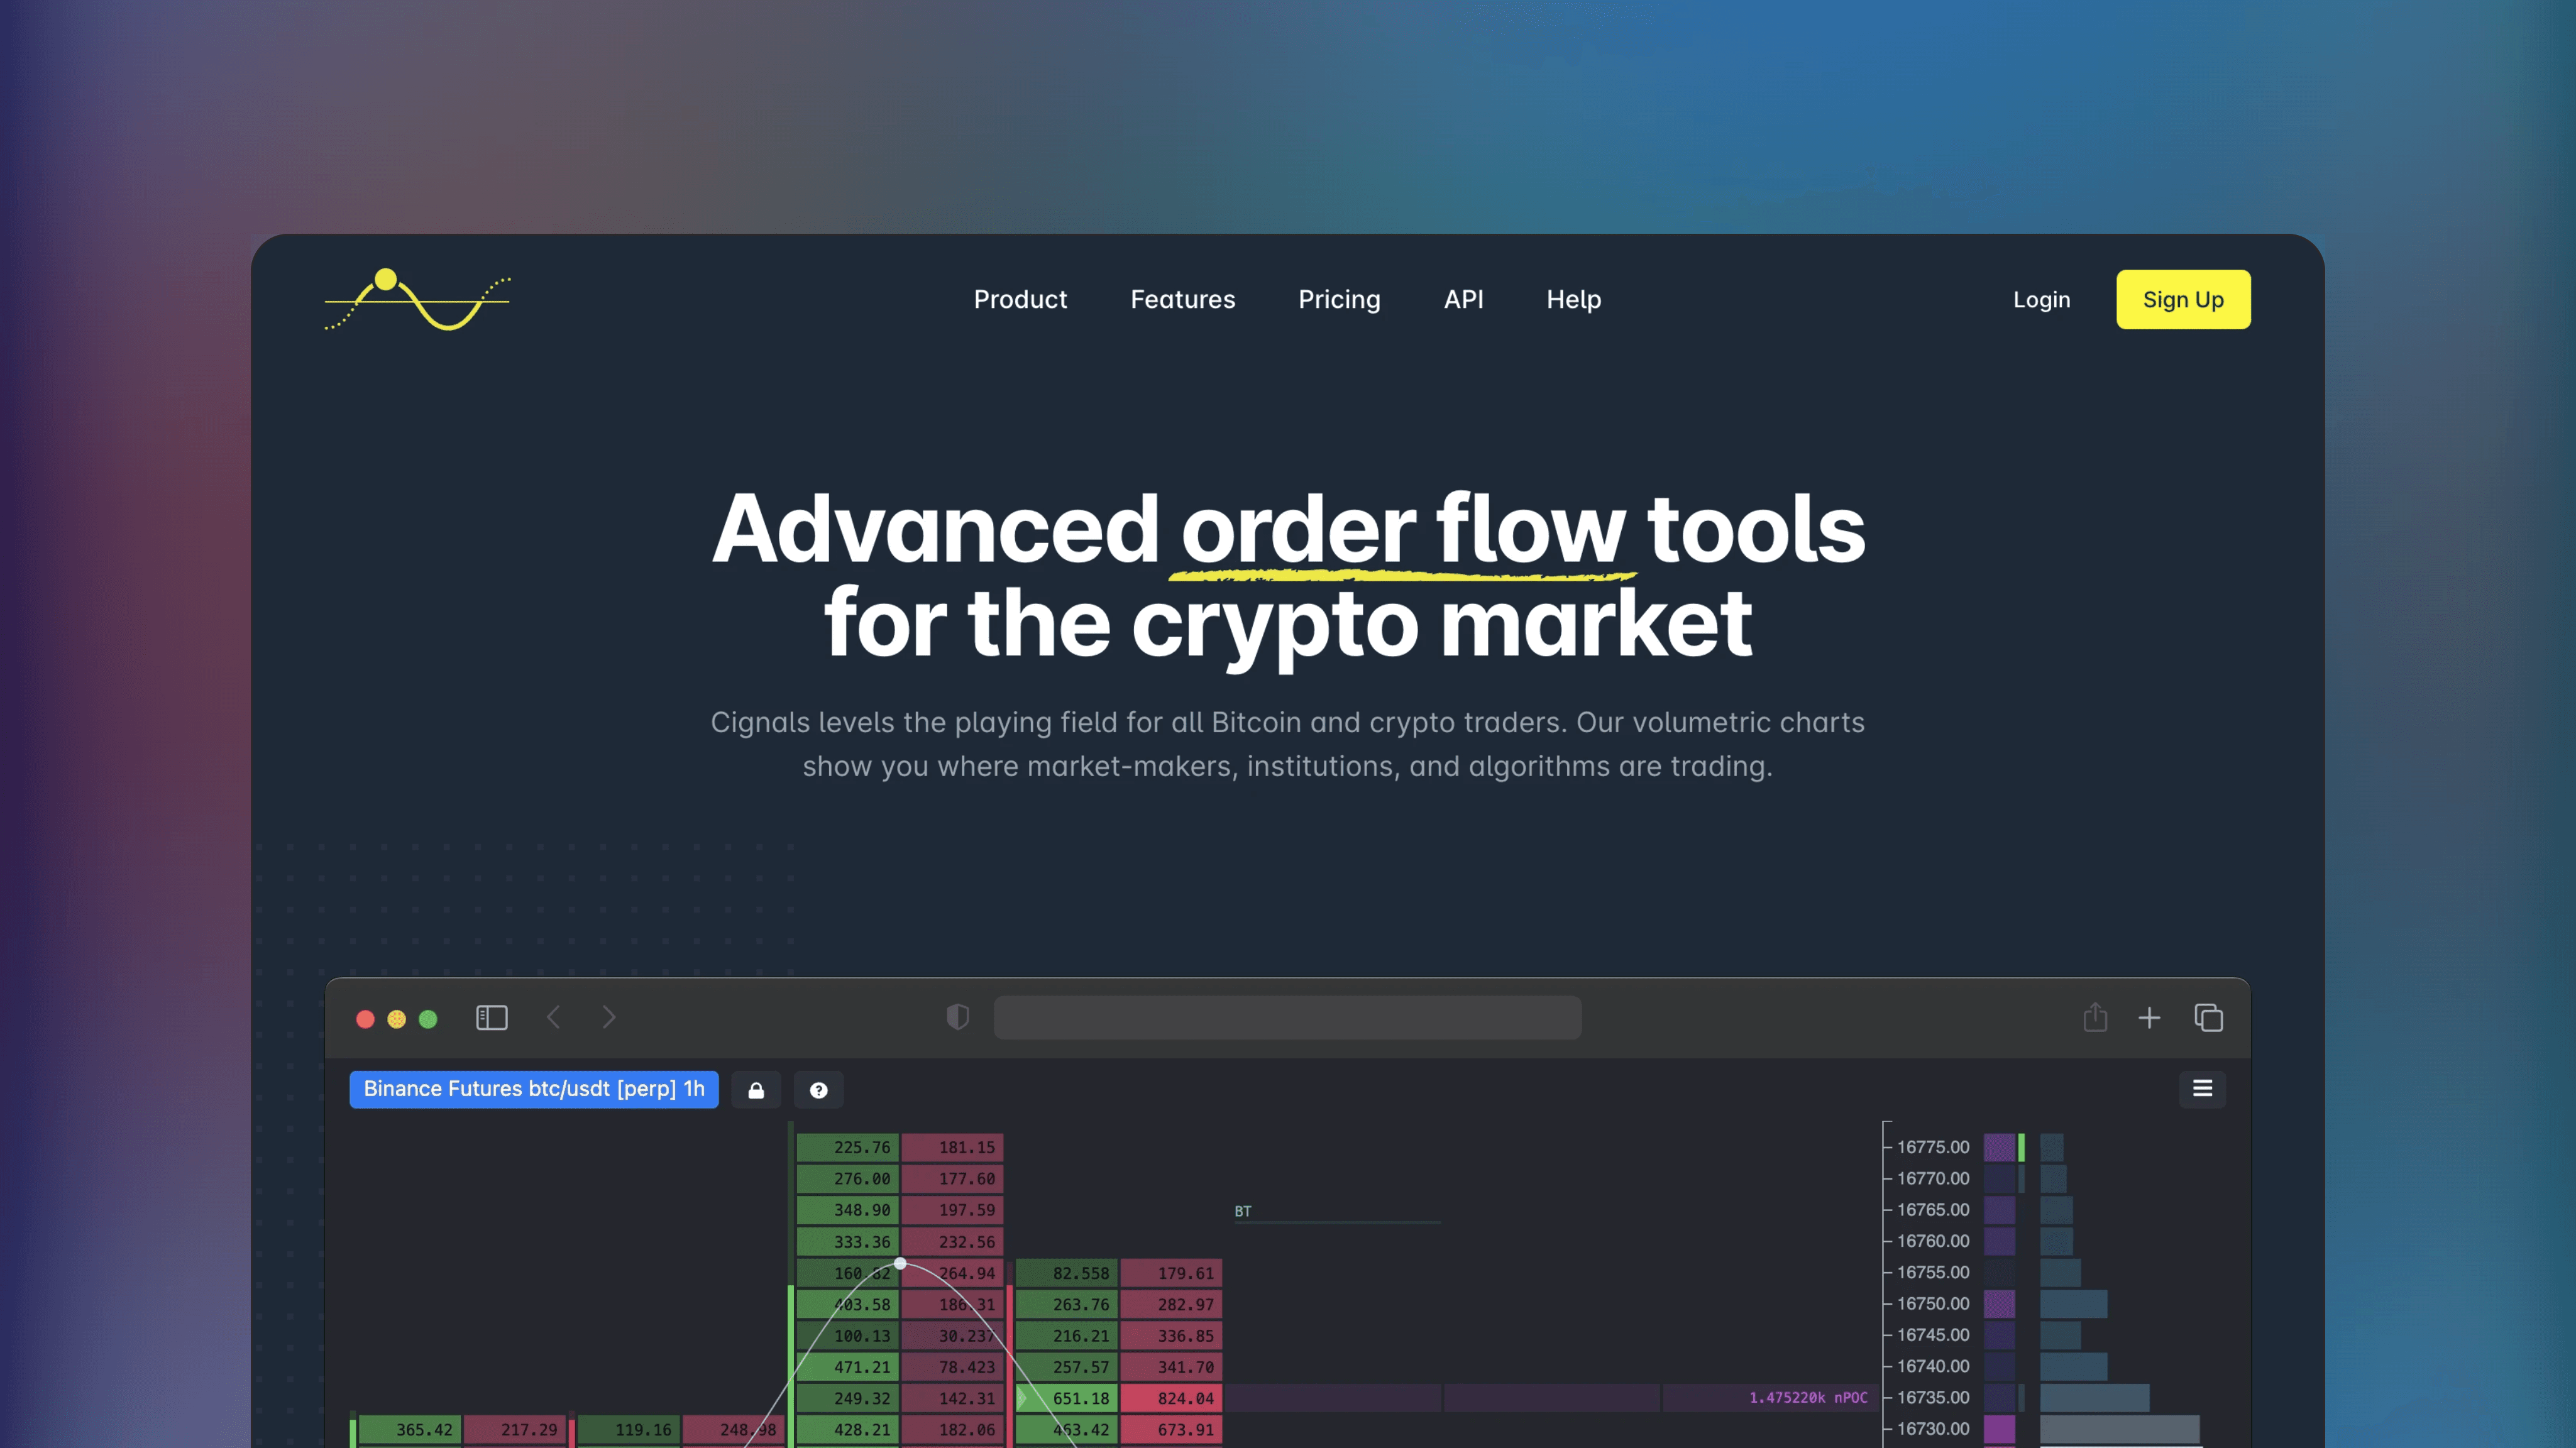
Cignals
🌐
✅
Cignals offers advanced order flow tools like volume profiles, DOM ladder and volume footprint for cryptocurrency markets with direct integration to cryptocurrency exchanges.
📟
Free*
Technical Analysis Platform
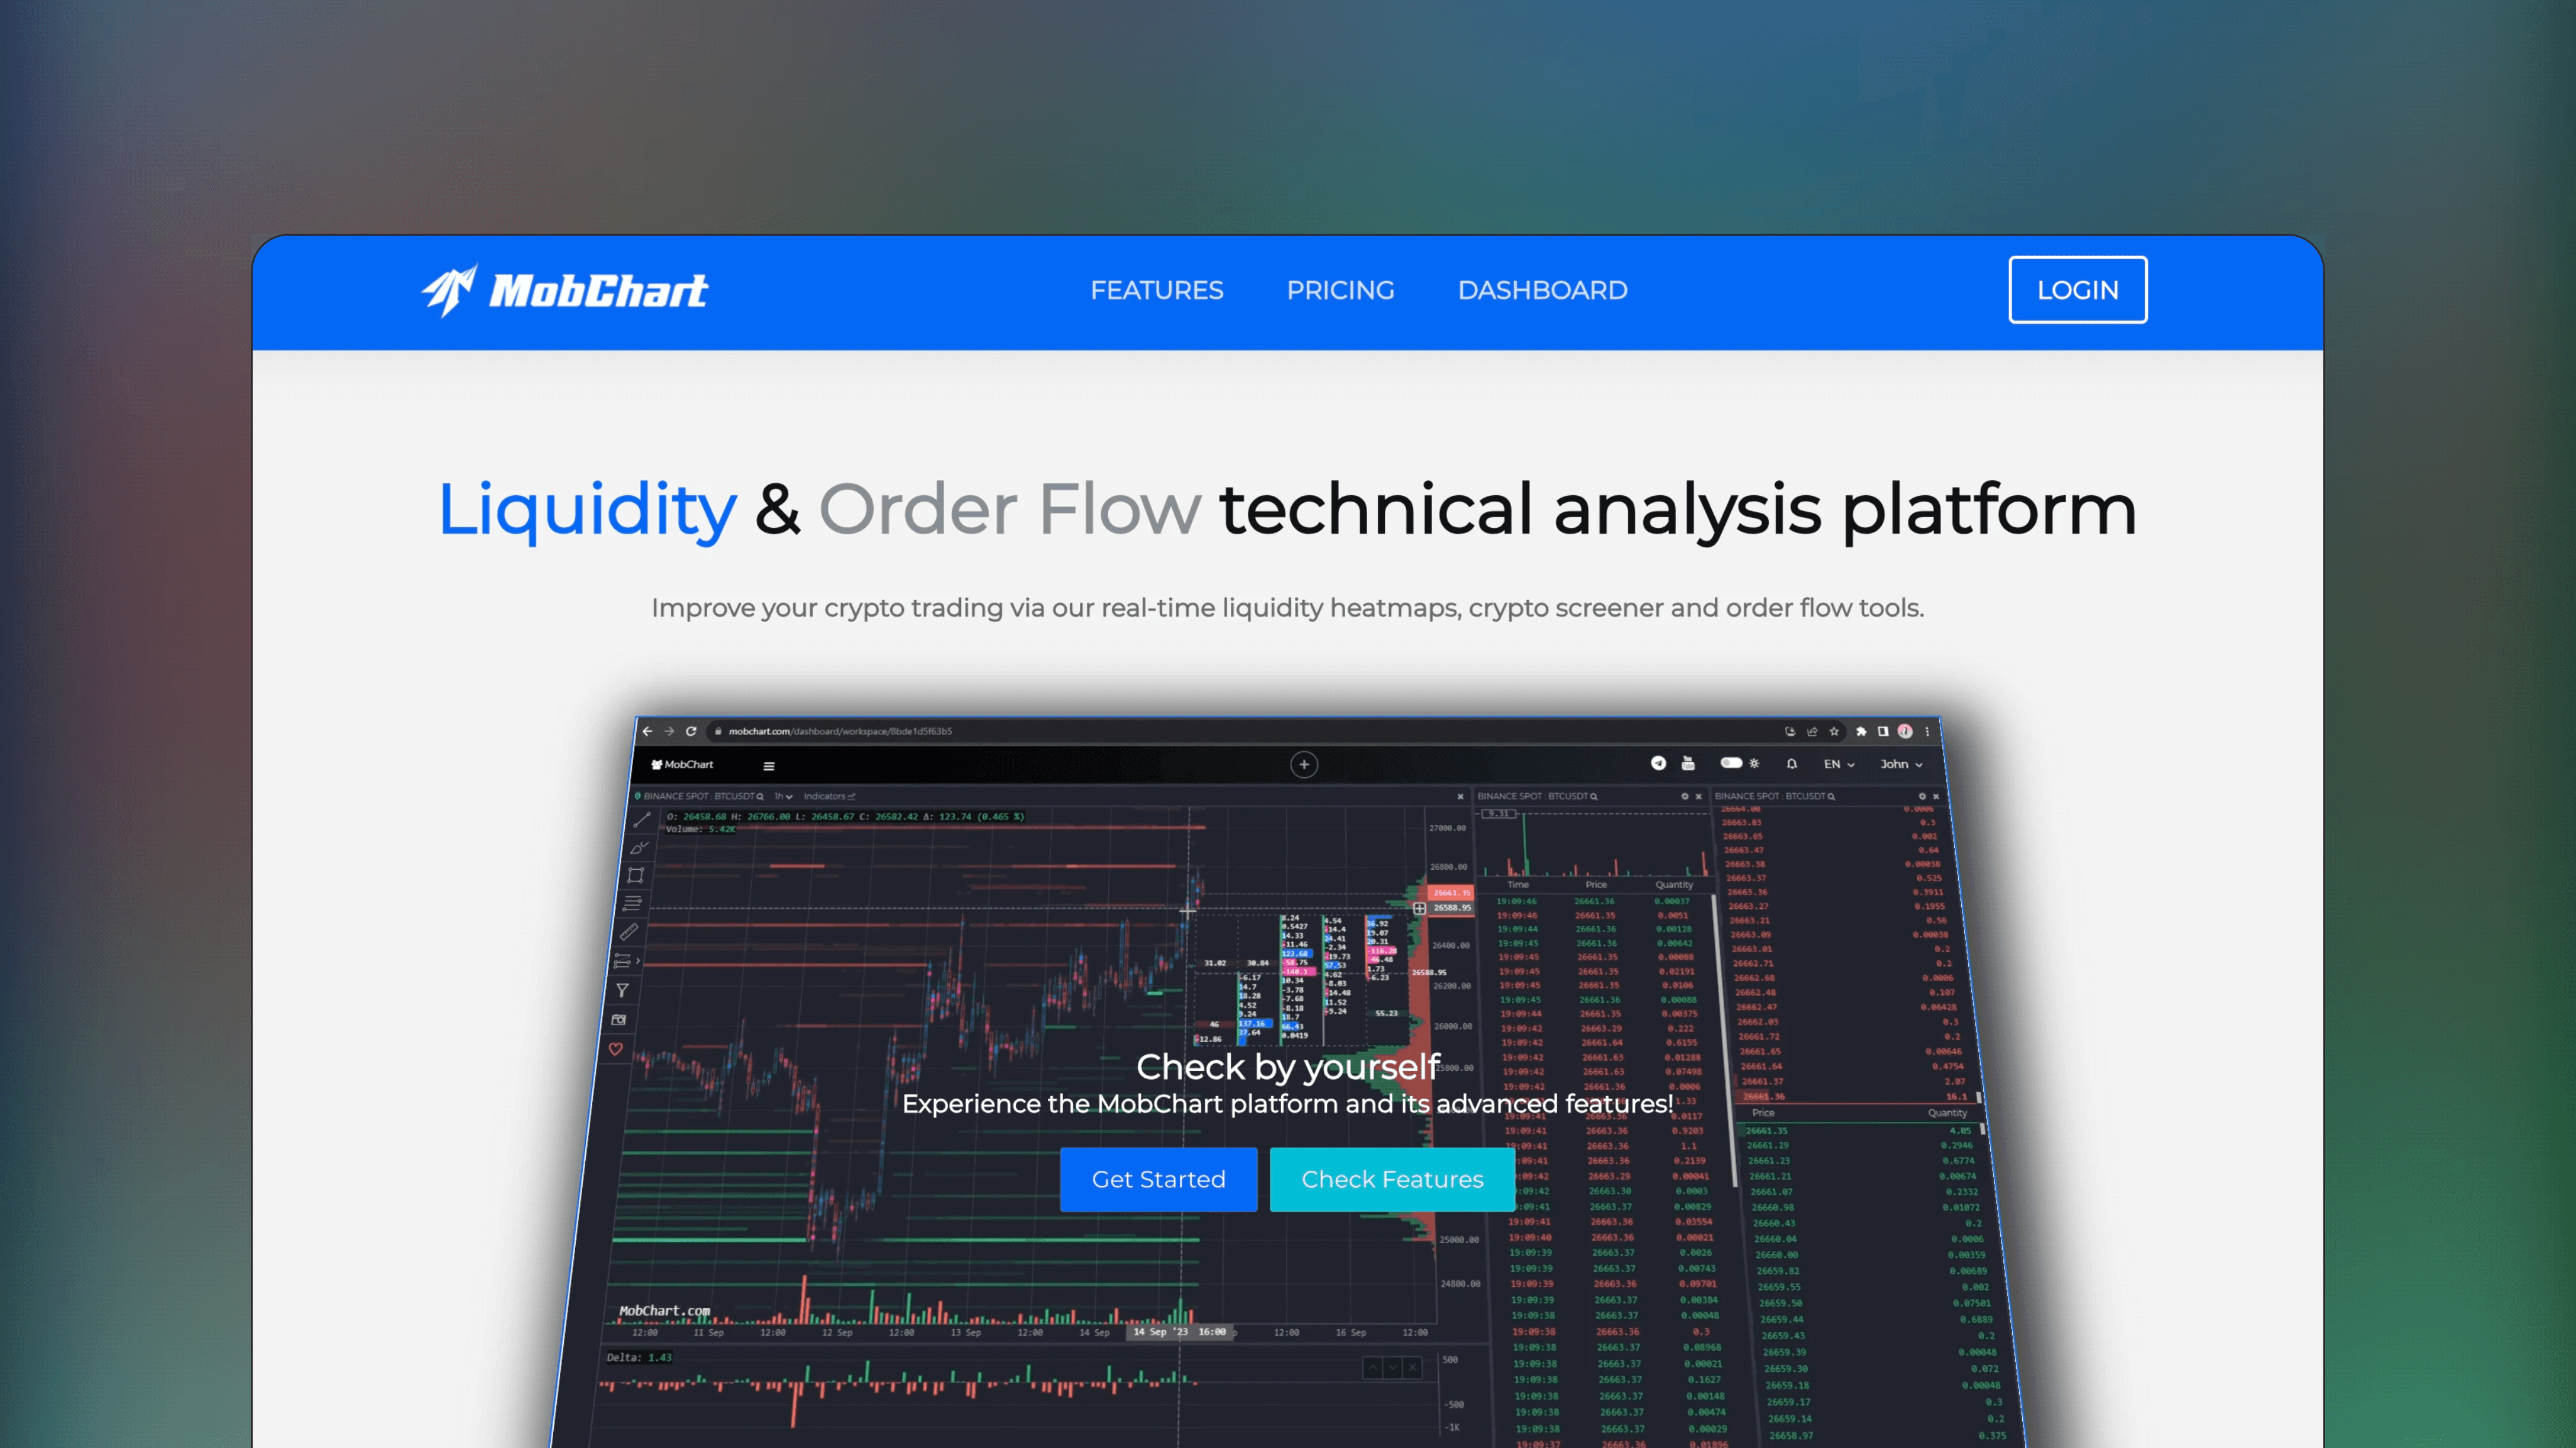
MobChart
🌐
✅
MobChart is a platform offering basic orderflow capabilities, such as volume profile, volume delta and liquidity heatmap for cryptocurrencies. The platform also offers screeners for scanning volume events across the markets. Free and paid options available.
📟
Paid
Technical Analysis Platform
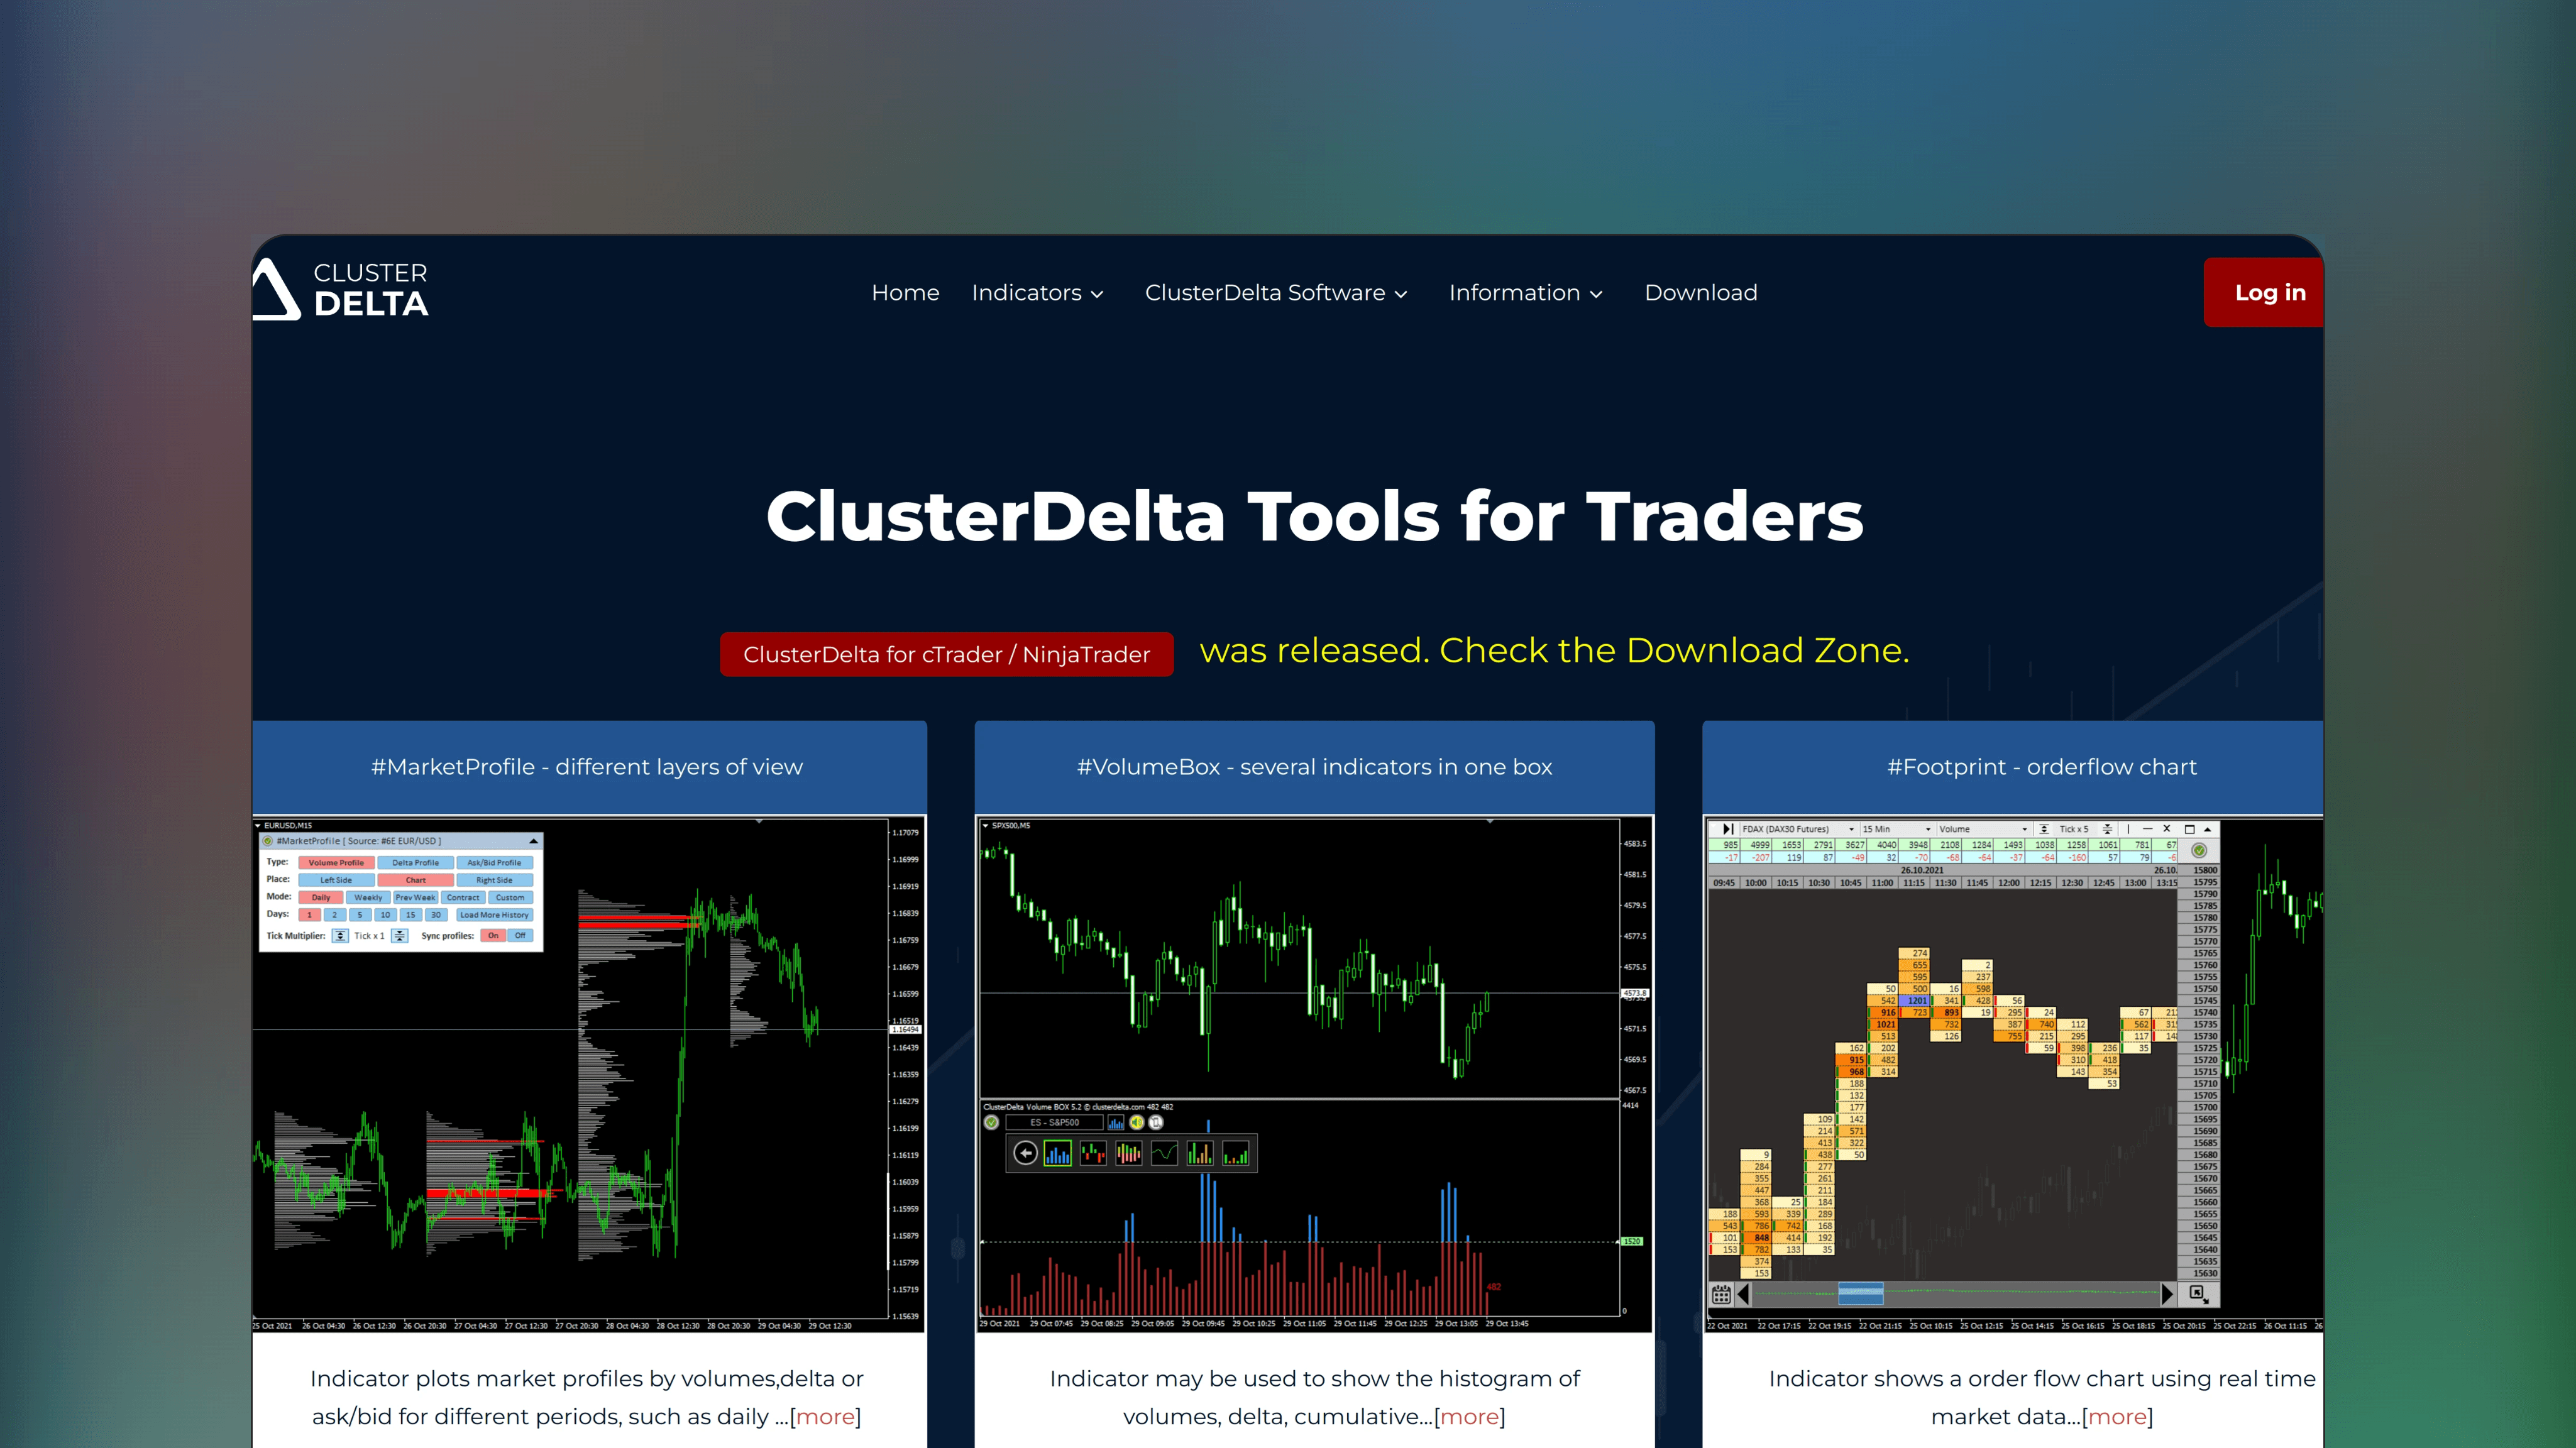
ClusterDelta
🌐
✅
ClusterDelta features advanced order flow tools like volume profiles, DOM ladder and volume footprint with customizable charts and various indicators for technical analysis.
📟
Free*
Technical Analysis Platform
PipFlow
🌐
✅
PipFlow provides a variety of advanced order flow tools like volume footprint, liquidity heatmap, market profile and real-time Level II data analysis. For futures, stocks and cryptocurrencies on multiple devices.