


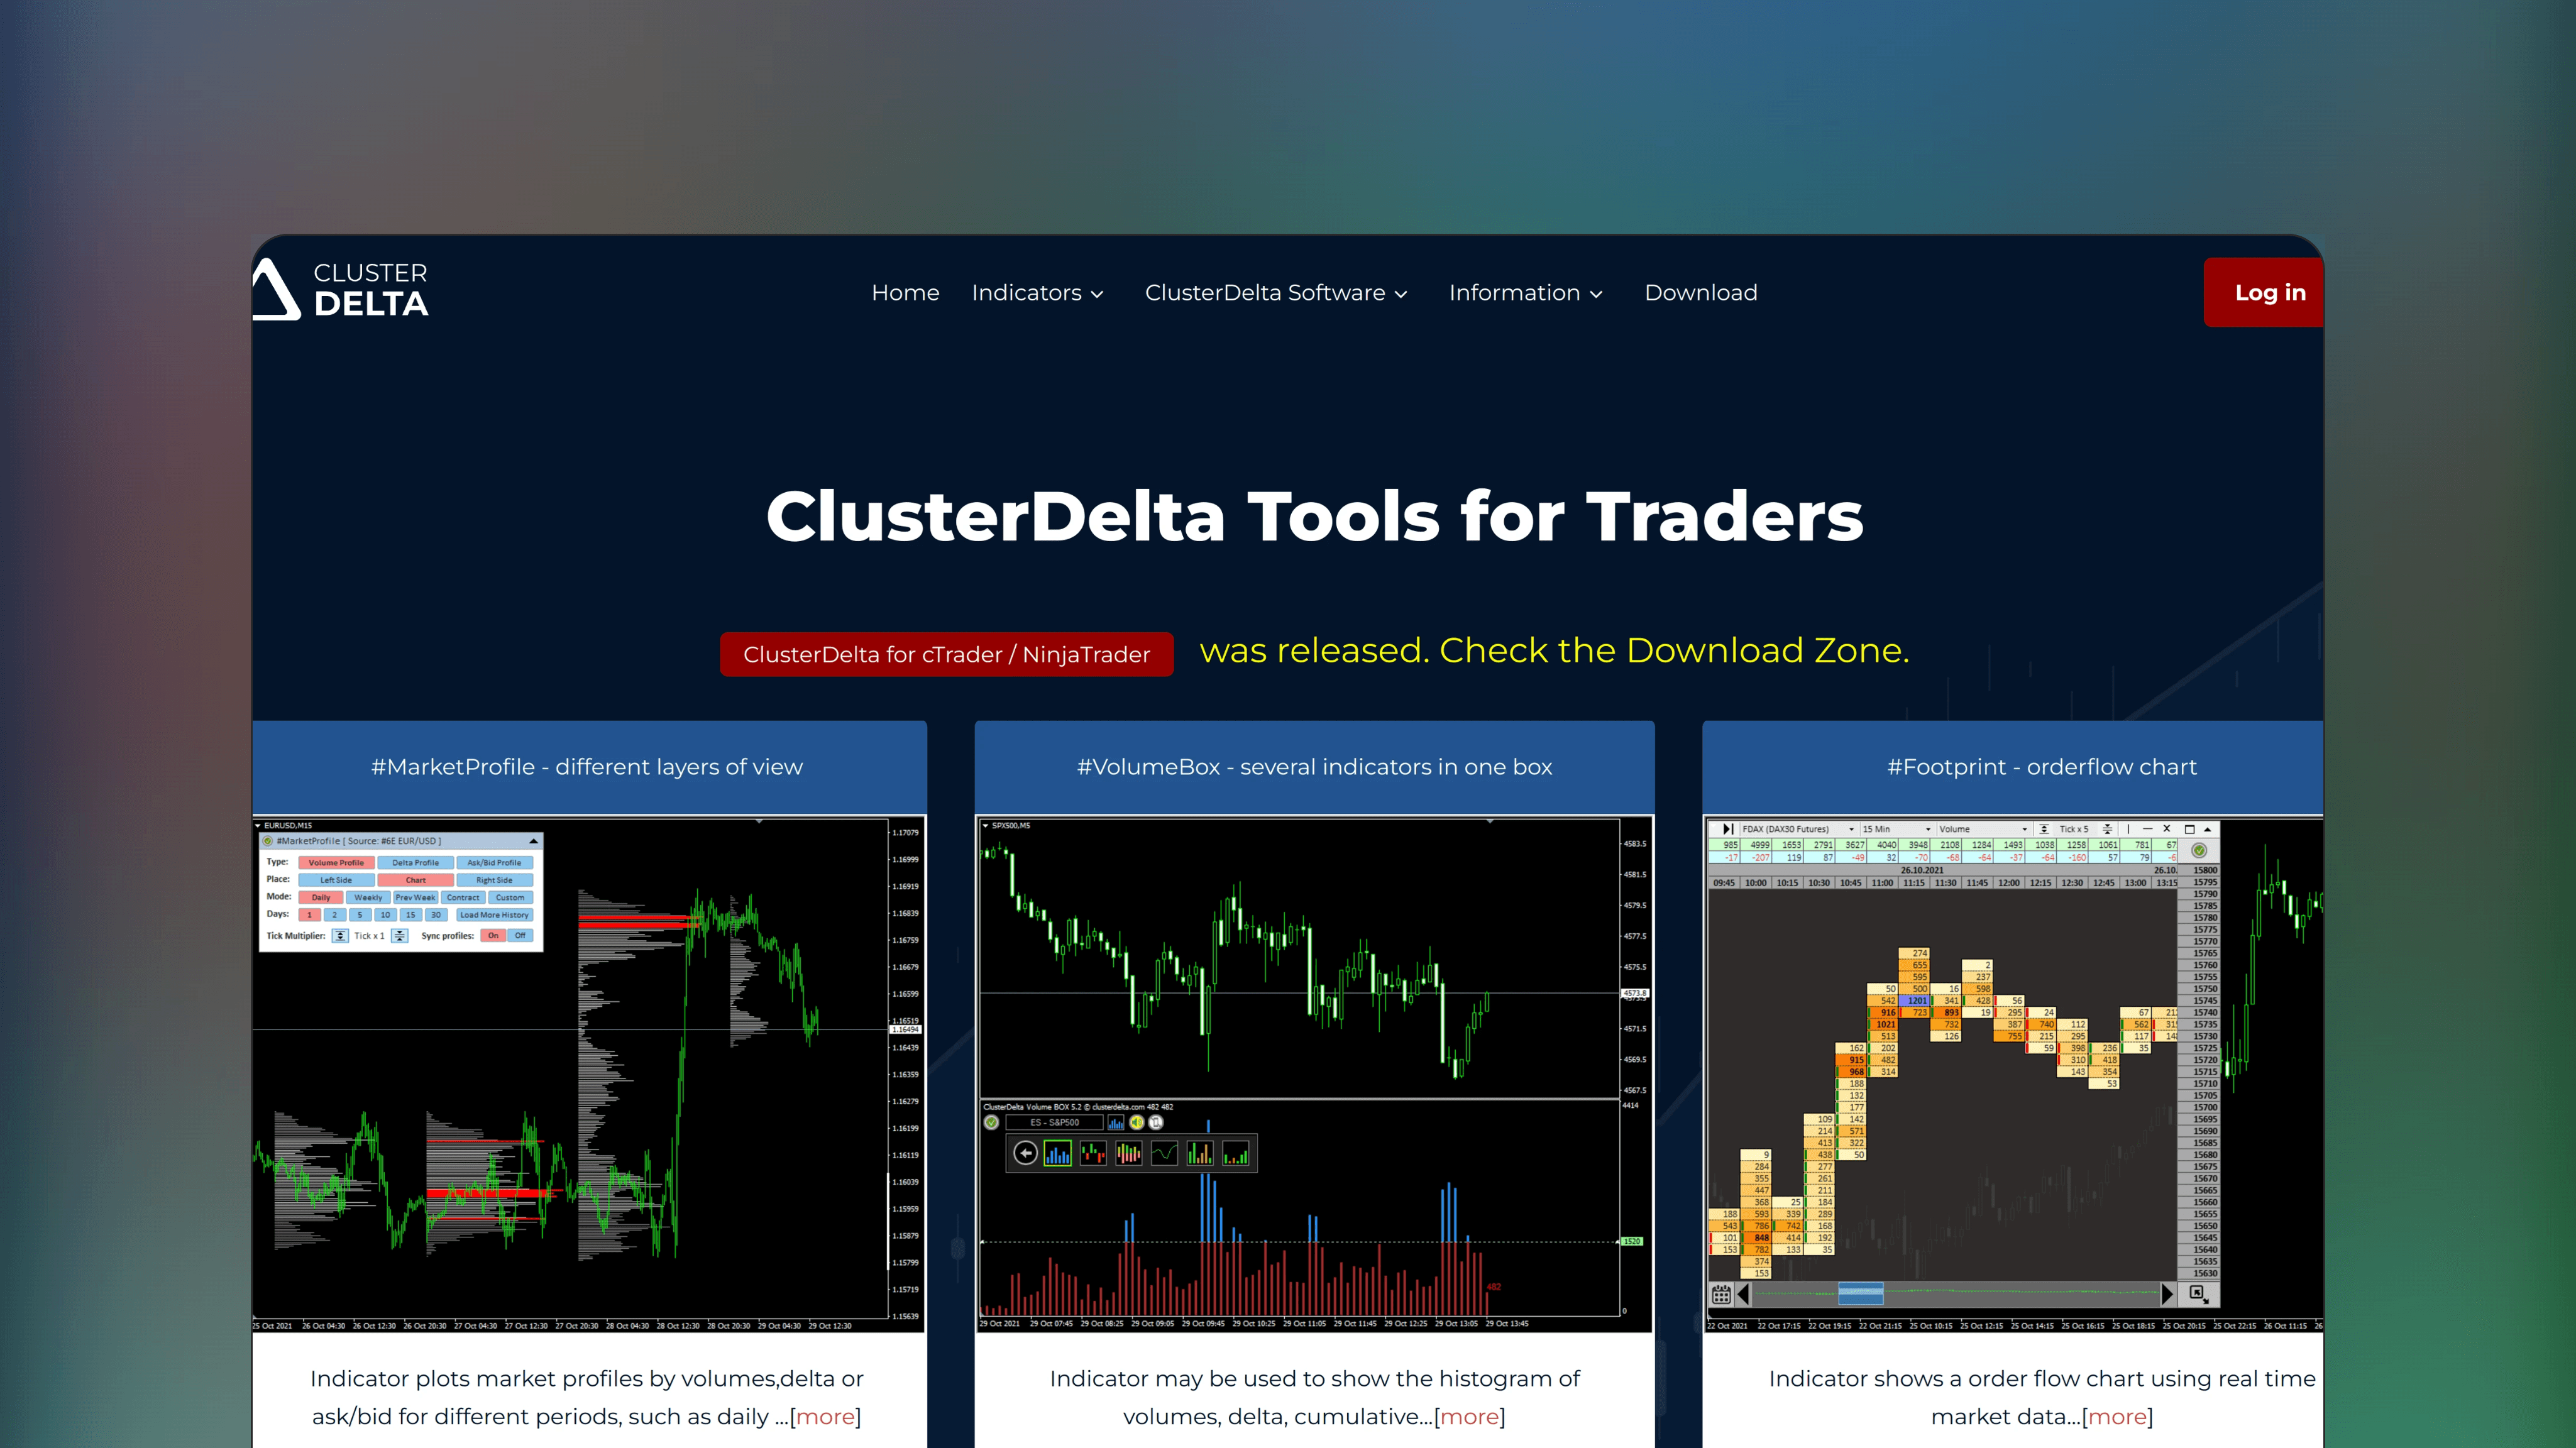
Published by ClusterDelta


Apply orderflow analysis across markets
Use volume footprint charts to break each candle into a grid of price and volume, revealing the true buying and selling dynamics within price moves.
Create custom orderflow chart layouts
Tailor charts with adjustable timeframes, color schemes and indicator overlays to build a multi-layered analysis framework matching your style.
Access tick-level volume accuracy
Analyze precise volume data at every tick to confirm technical setups and add confluence with volume profile support and resistance levels.
What is a volume footprint chart?
The volume footprint breaks each candle into a grid of price and volume. A candle that closed bullish but shows heavy selling at the highs may indicate absorption rather than genuine buying strength.
How do volume profiles work?
Volume profiles display traded volume at each price level rather than per time period. This reveals high-volume nodes where significant activity occurred, which often act as support or resistance.
Can I combine order flow with traditional indicators?
Yes. ClusterDelta includes standard technical indicators alongside orderflow tools. Using RSI divergence to confirm a volume profile support level adds confluence to trade setups and improves conviction.
⭐️
⭐️
⭐️
⭐️
⭐️


🔥
New Listings
Featured this week


📟
Similar Listings
Traders also viewed
All

📟
Free*
Technical Analysis Platform
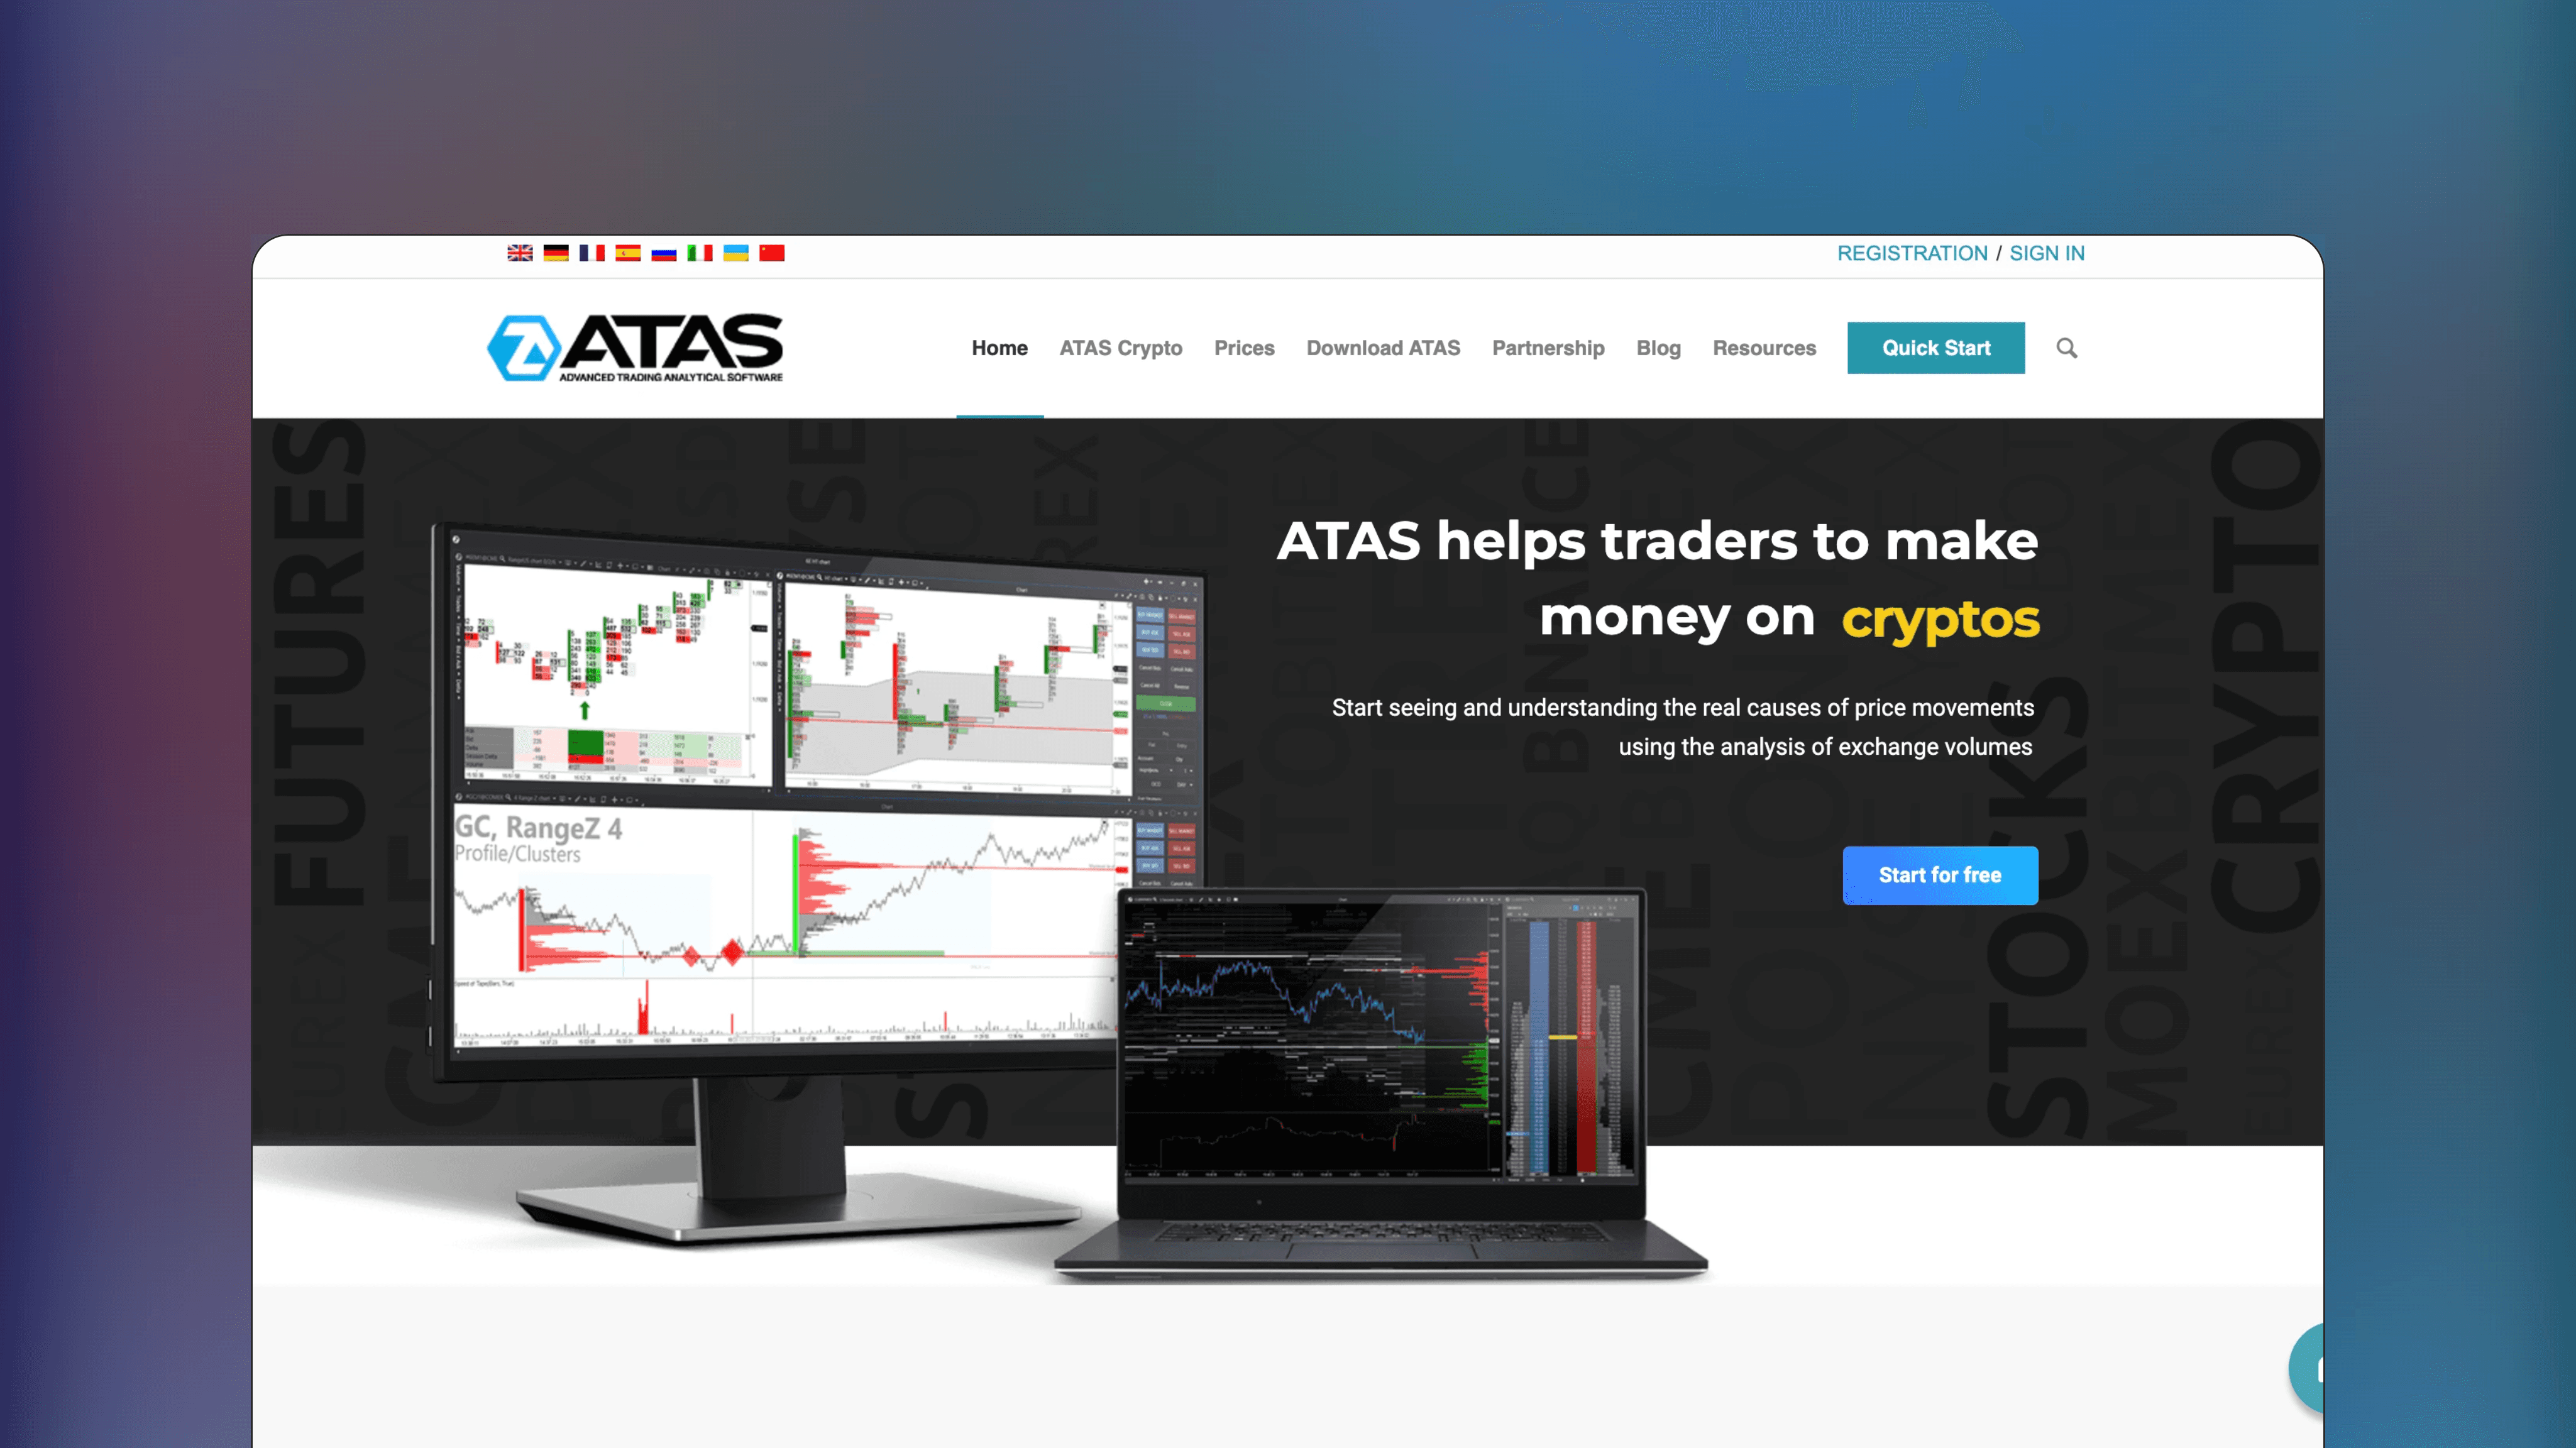
ATAS
🌐
✅
🏅
ATAS is a platform offering advanced orderflow tools for analyzing stocks, futures and cryptocurrencies. ATAS features a variety of tools, such as liquidity heatmaps, liquidation bubbles, and volume footprints.
📟
Paid
Technical Analysis Platform
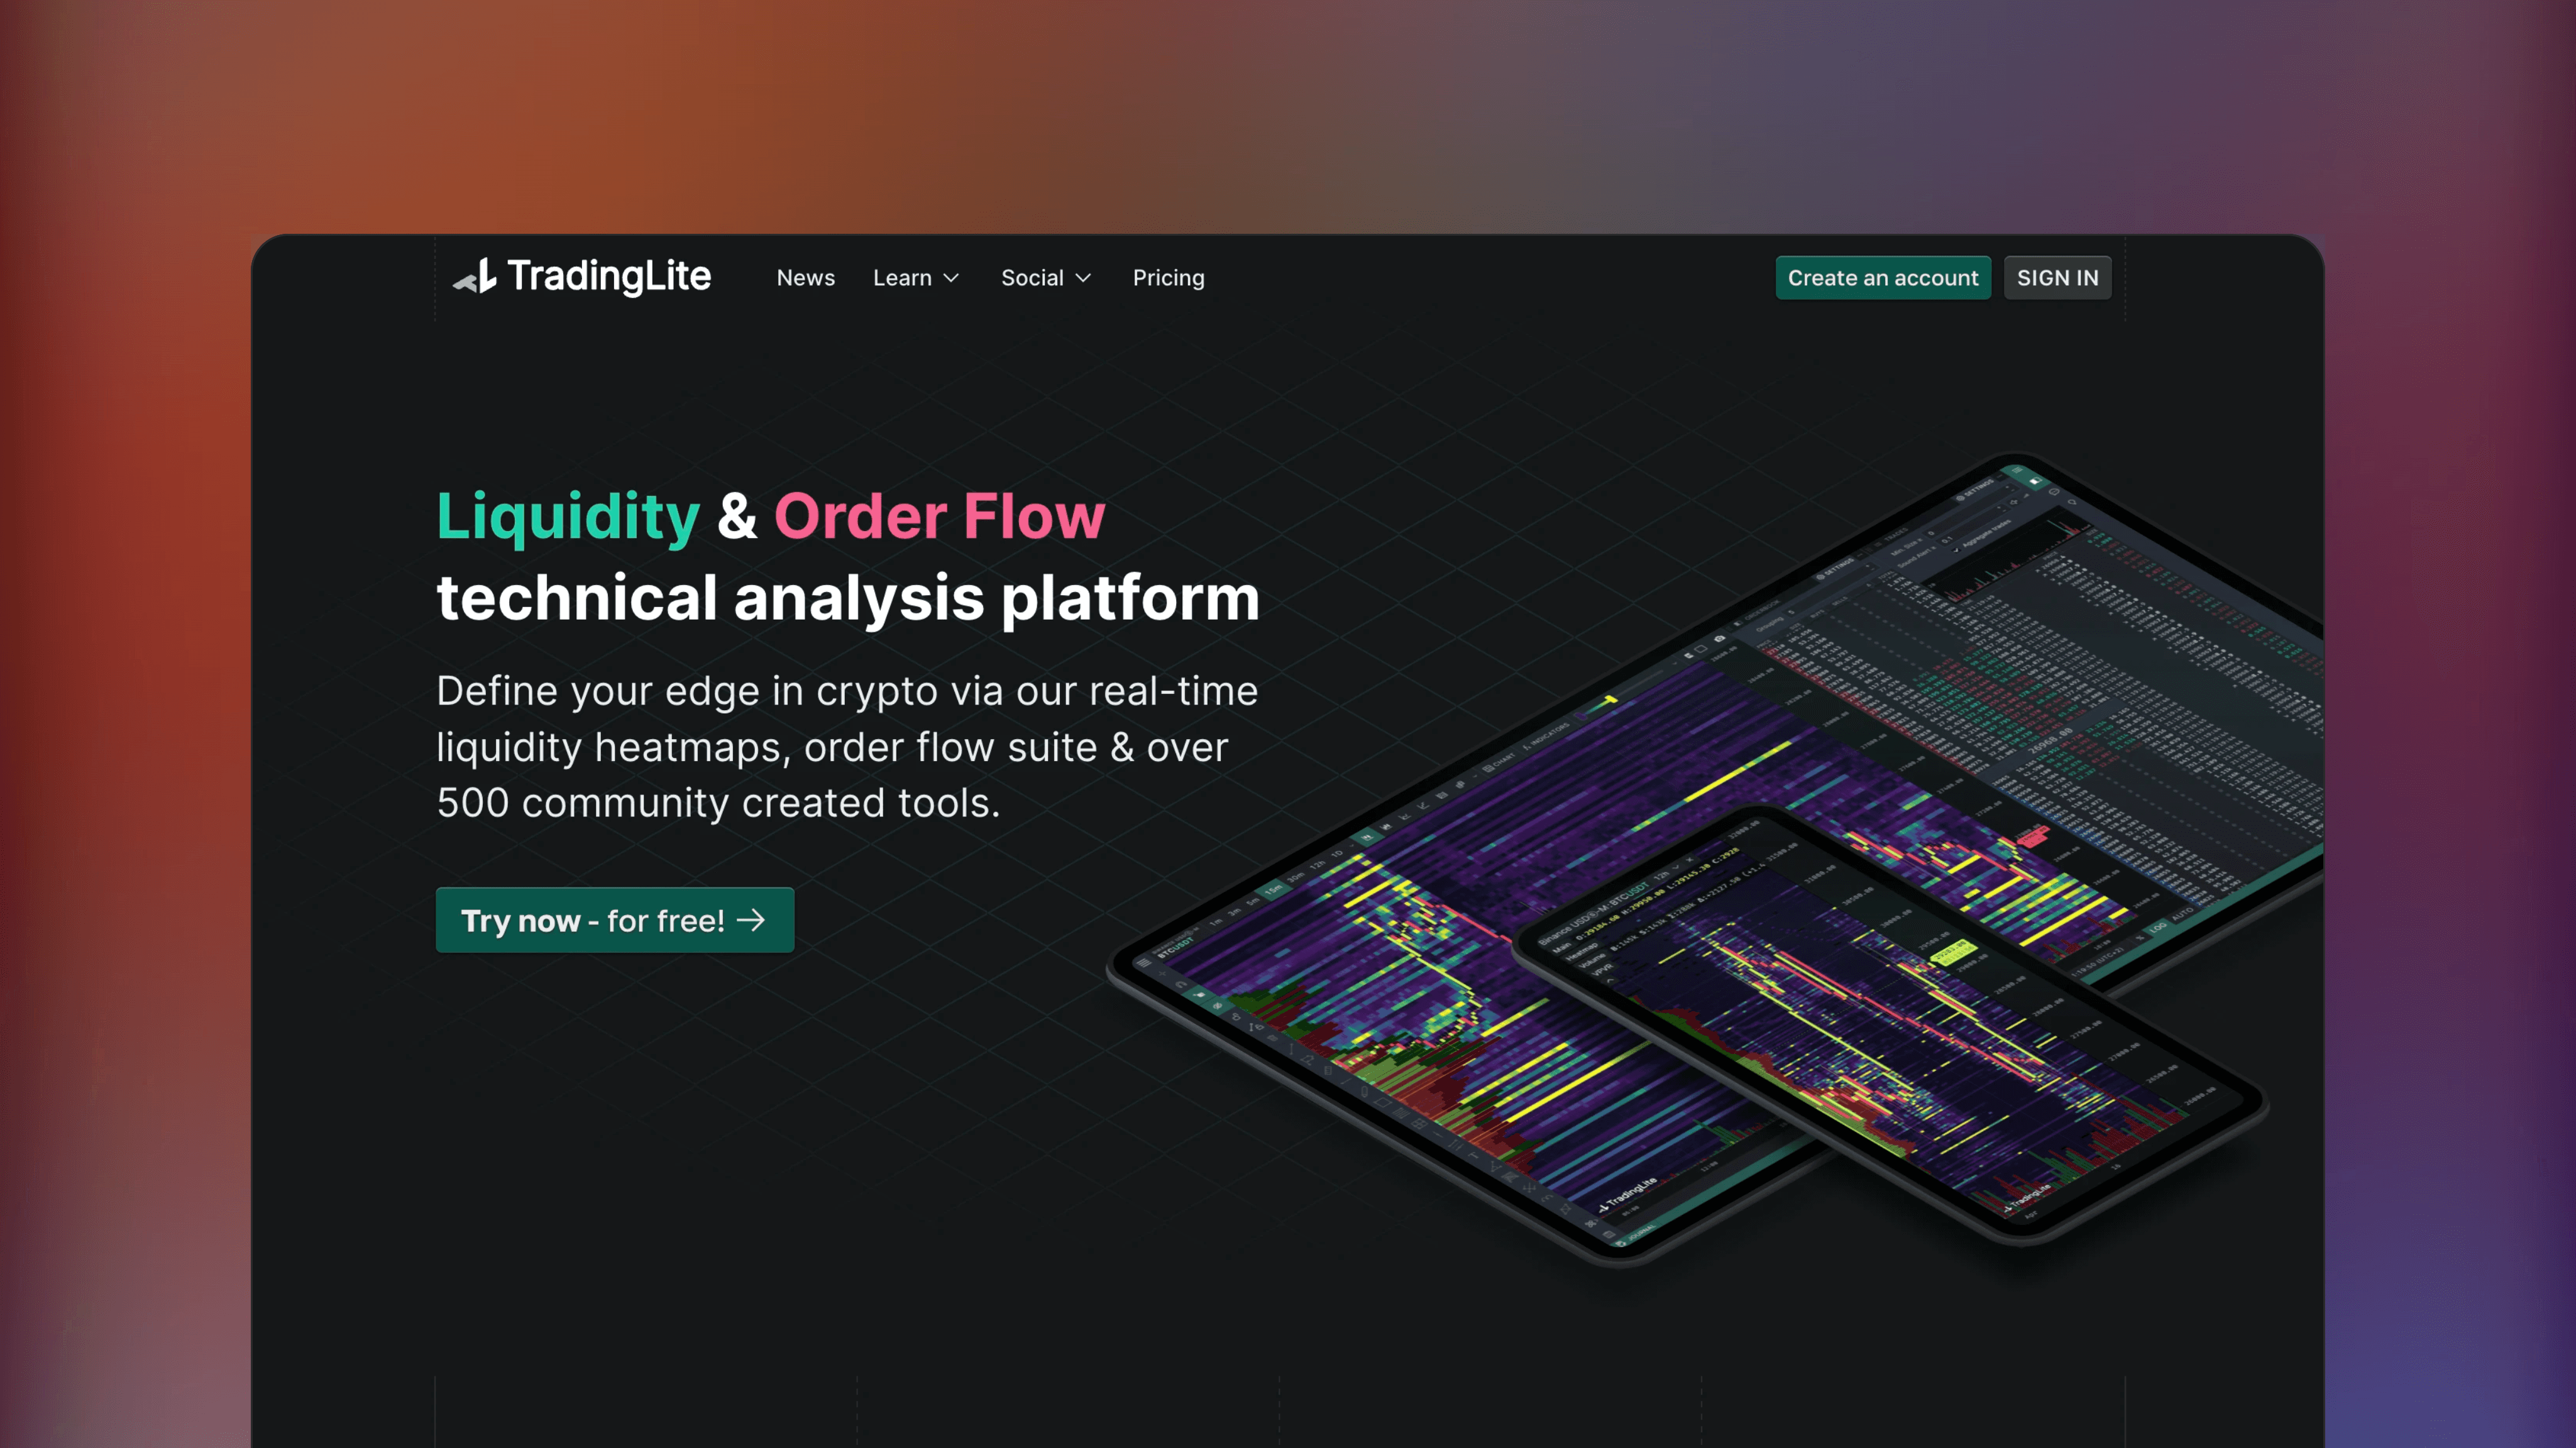
TradingLite
🌐
✅
🏅
TradingLite is a web-based platform for cryptocurrency orderflow analysis, offering advanced tools like liquidity heatmaps, volume profiles, footprints and hundreds of community created indicators.
📟
Free*
Technical Analysis Platform
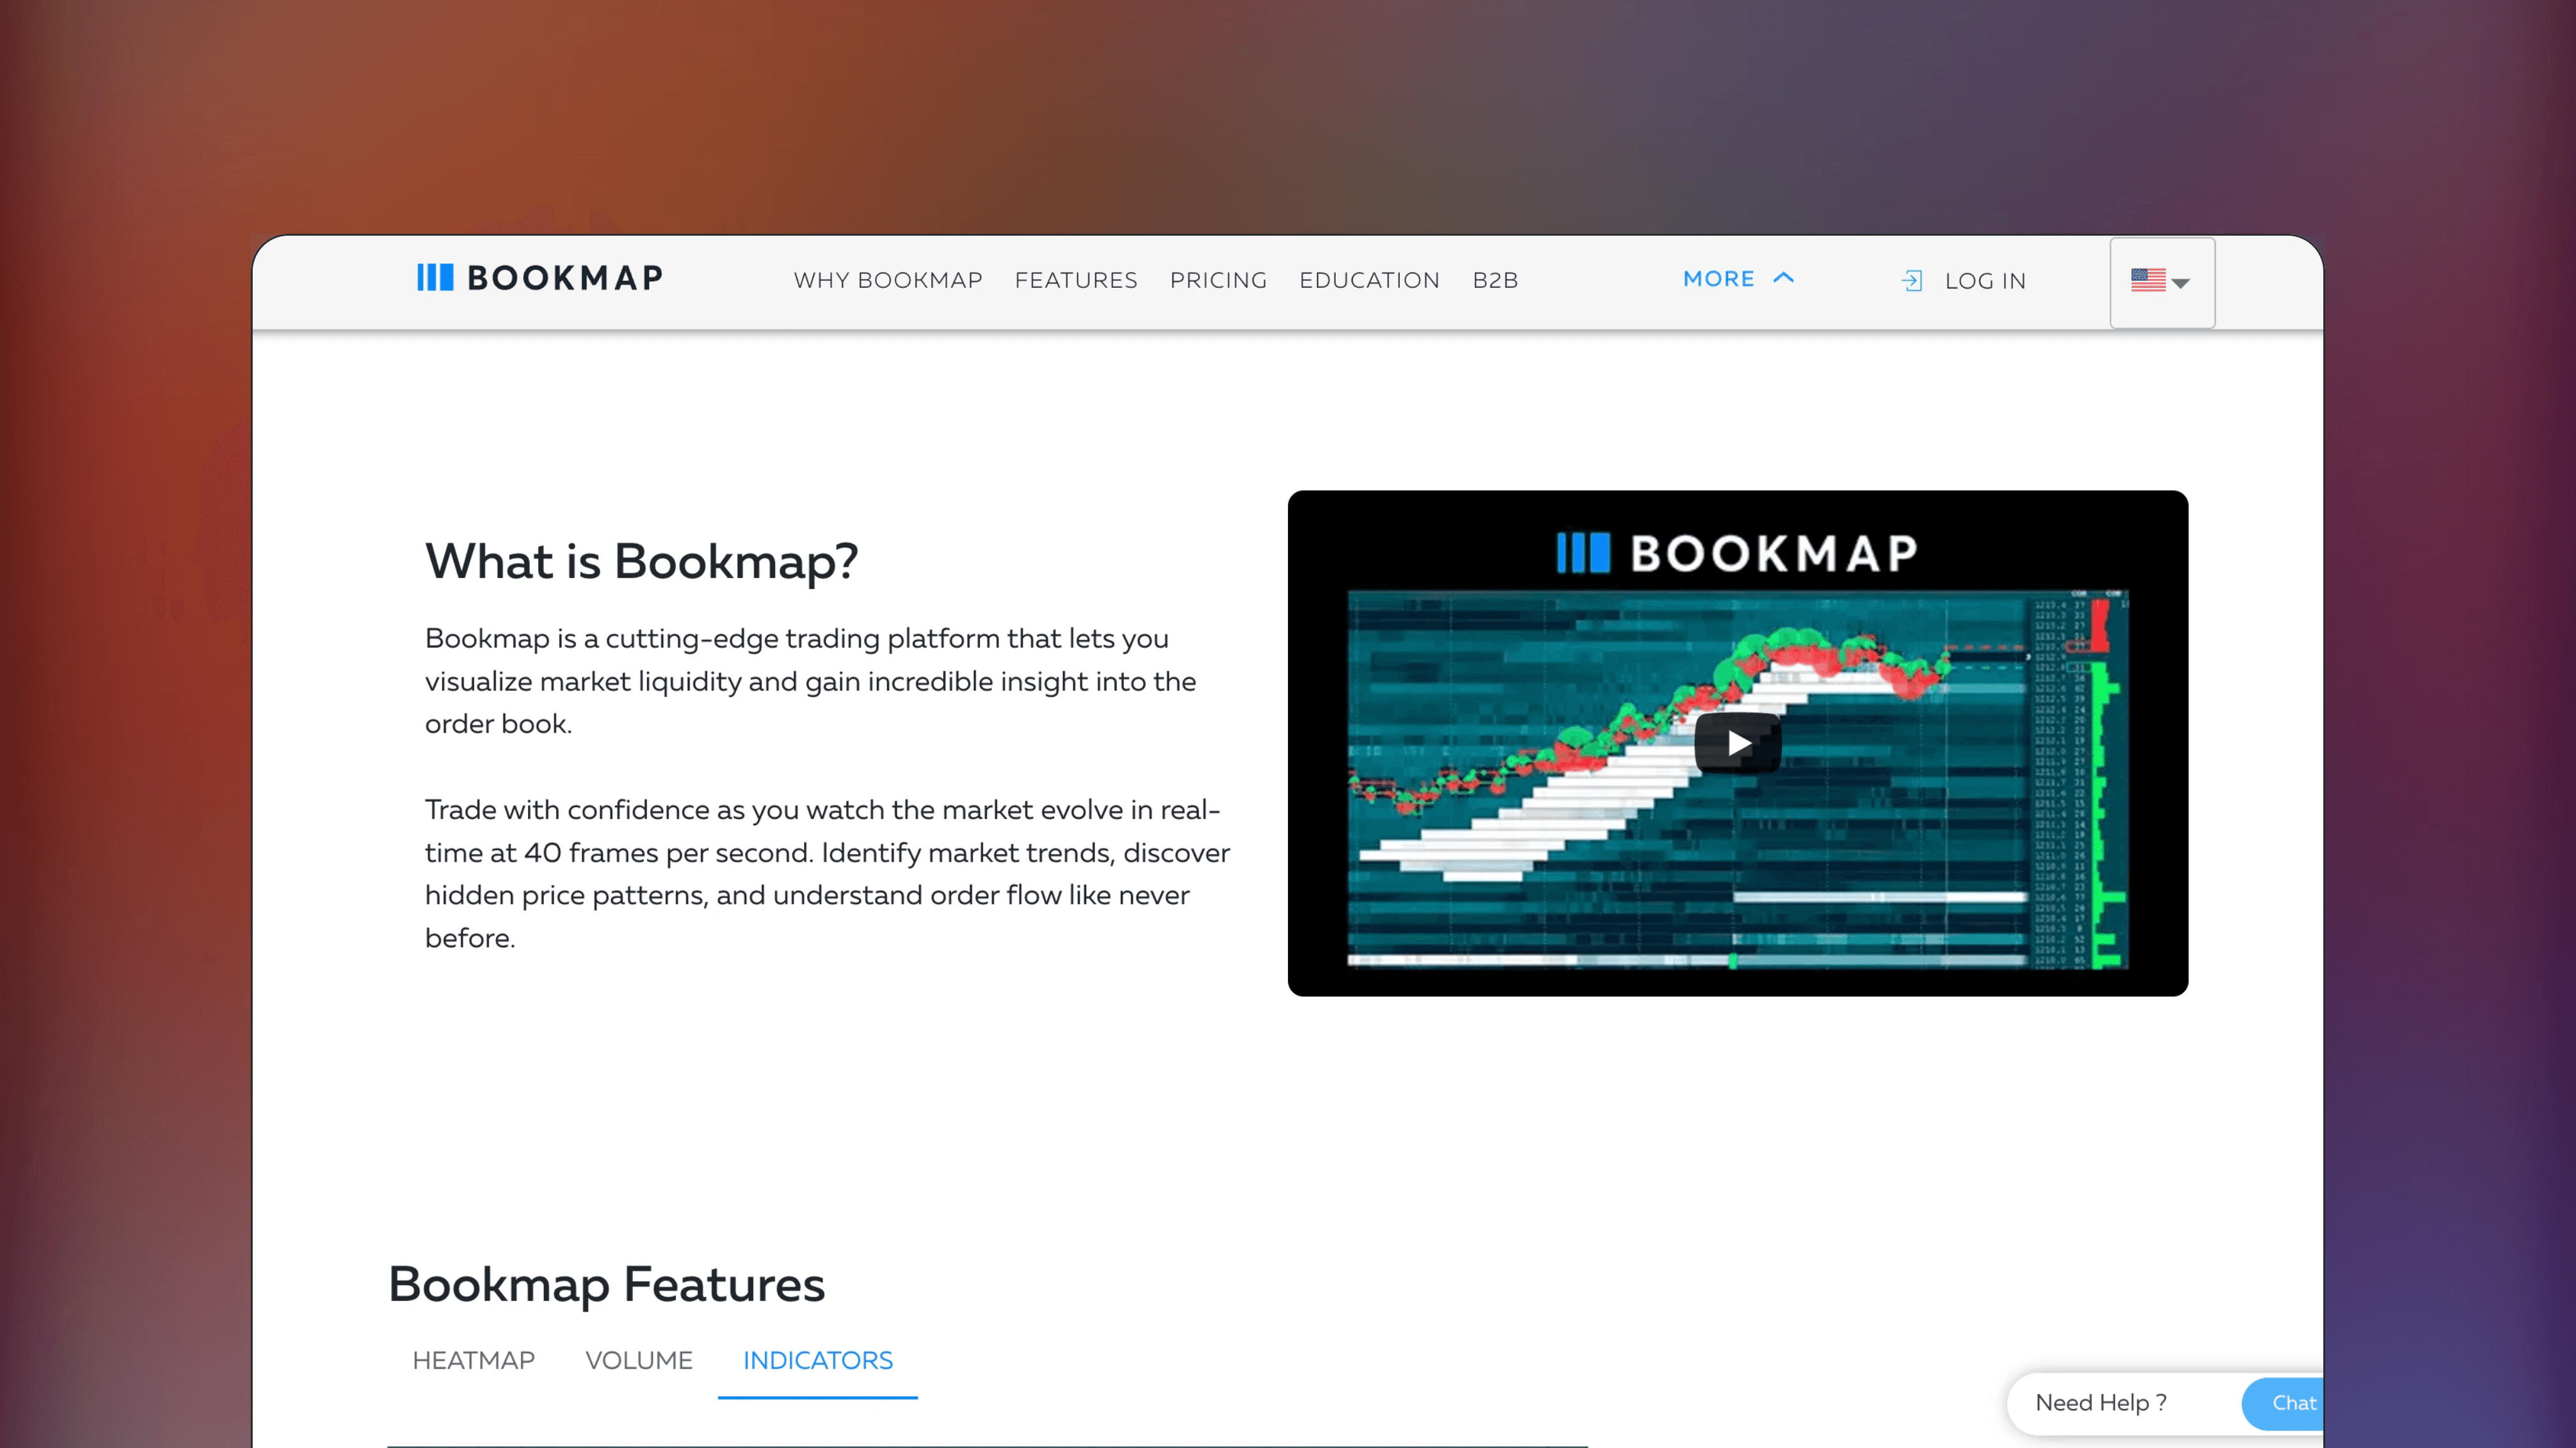
Bookmap
🌐
✅
🏅
Bookmap hosts a range of advanced order flow tools like liquidity heatmaps, liquidation bubbles and volume profiles with real-time and accurate orderbook data.
📟
Paid
Technical Analysis Platform
Exocharts
🌐
✅
🏅
Exocharts provides advanced orderflow tools like volume profiles, DOM ladder and volume footprint for cryptocurrency and legacy markets. Available in both web and desktop versions.
📟
Paid
Technical Analysis Platform
Sierra Charts
🌐
✅
🏅
Sierra Charts is a desktop trading platform offering advanced orderflow tools like cumulative volume delta, volume profile and footprints based on true order book data.
📟
Paid
Technical Analysis Platform
Cignals
🌐
✅
Cignals offers advanced order flow tools like volume profiles, DOM ladder and volume footprint for cryptocurrency markets with direct integration to cryptocurrency exchanges.
📟
Free*
Technical Analysis Platform
MobChart
🌐
✅
MobChart is a platform offering basic orderflow capabilities, such as volume profile, volume delta and liquidity heatmap for cryptocurrencies. The platform also offers screeners for scanning volume events across the markets. Free and paid options available.
📟
Free*
Technical Analysis Platform
PipFlow
🌐
✅
PipFlow provides a variety of advanced order flow tools like volume footprint, liquidity heatmap, market profile and real-time Level II data analysis. For futures, stocks and cryptocurrencies on multiple devices.