


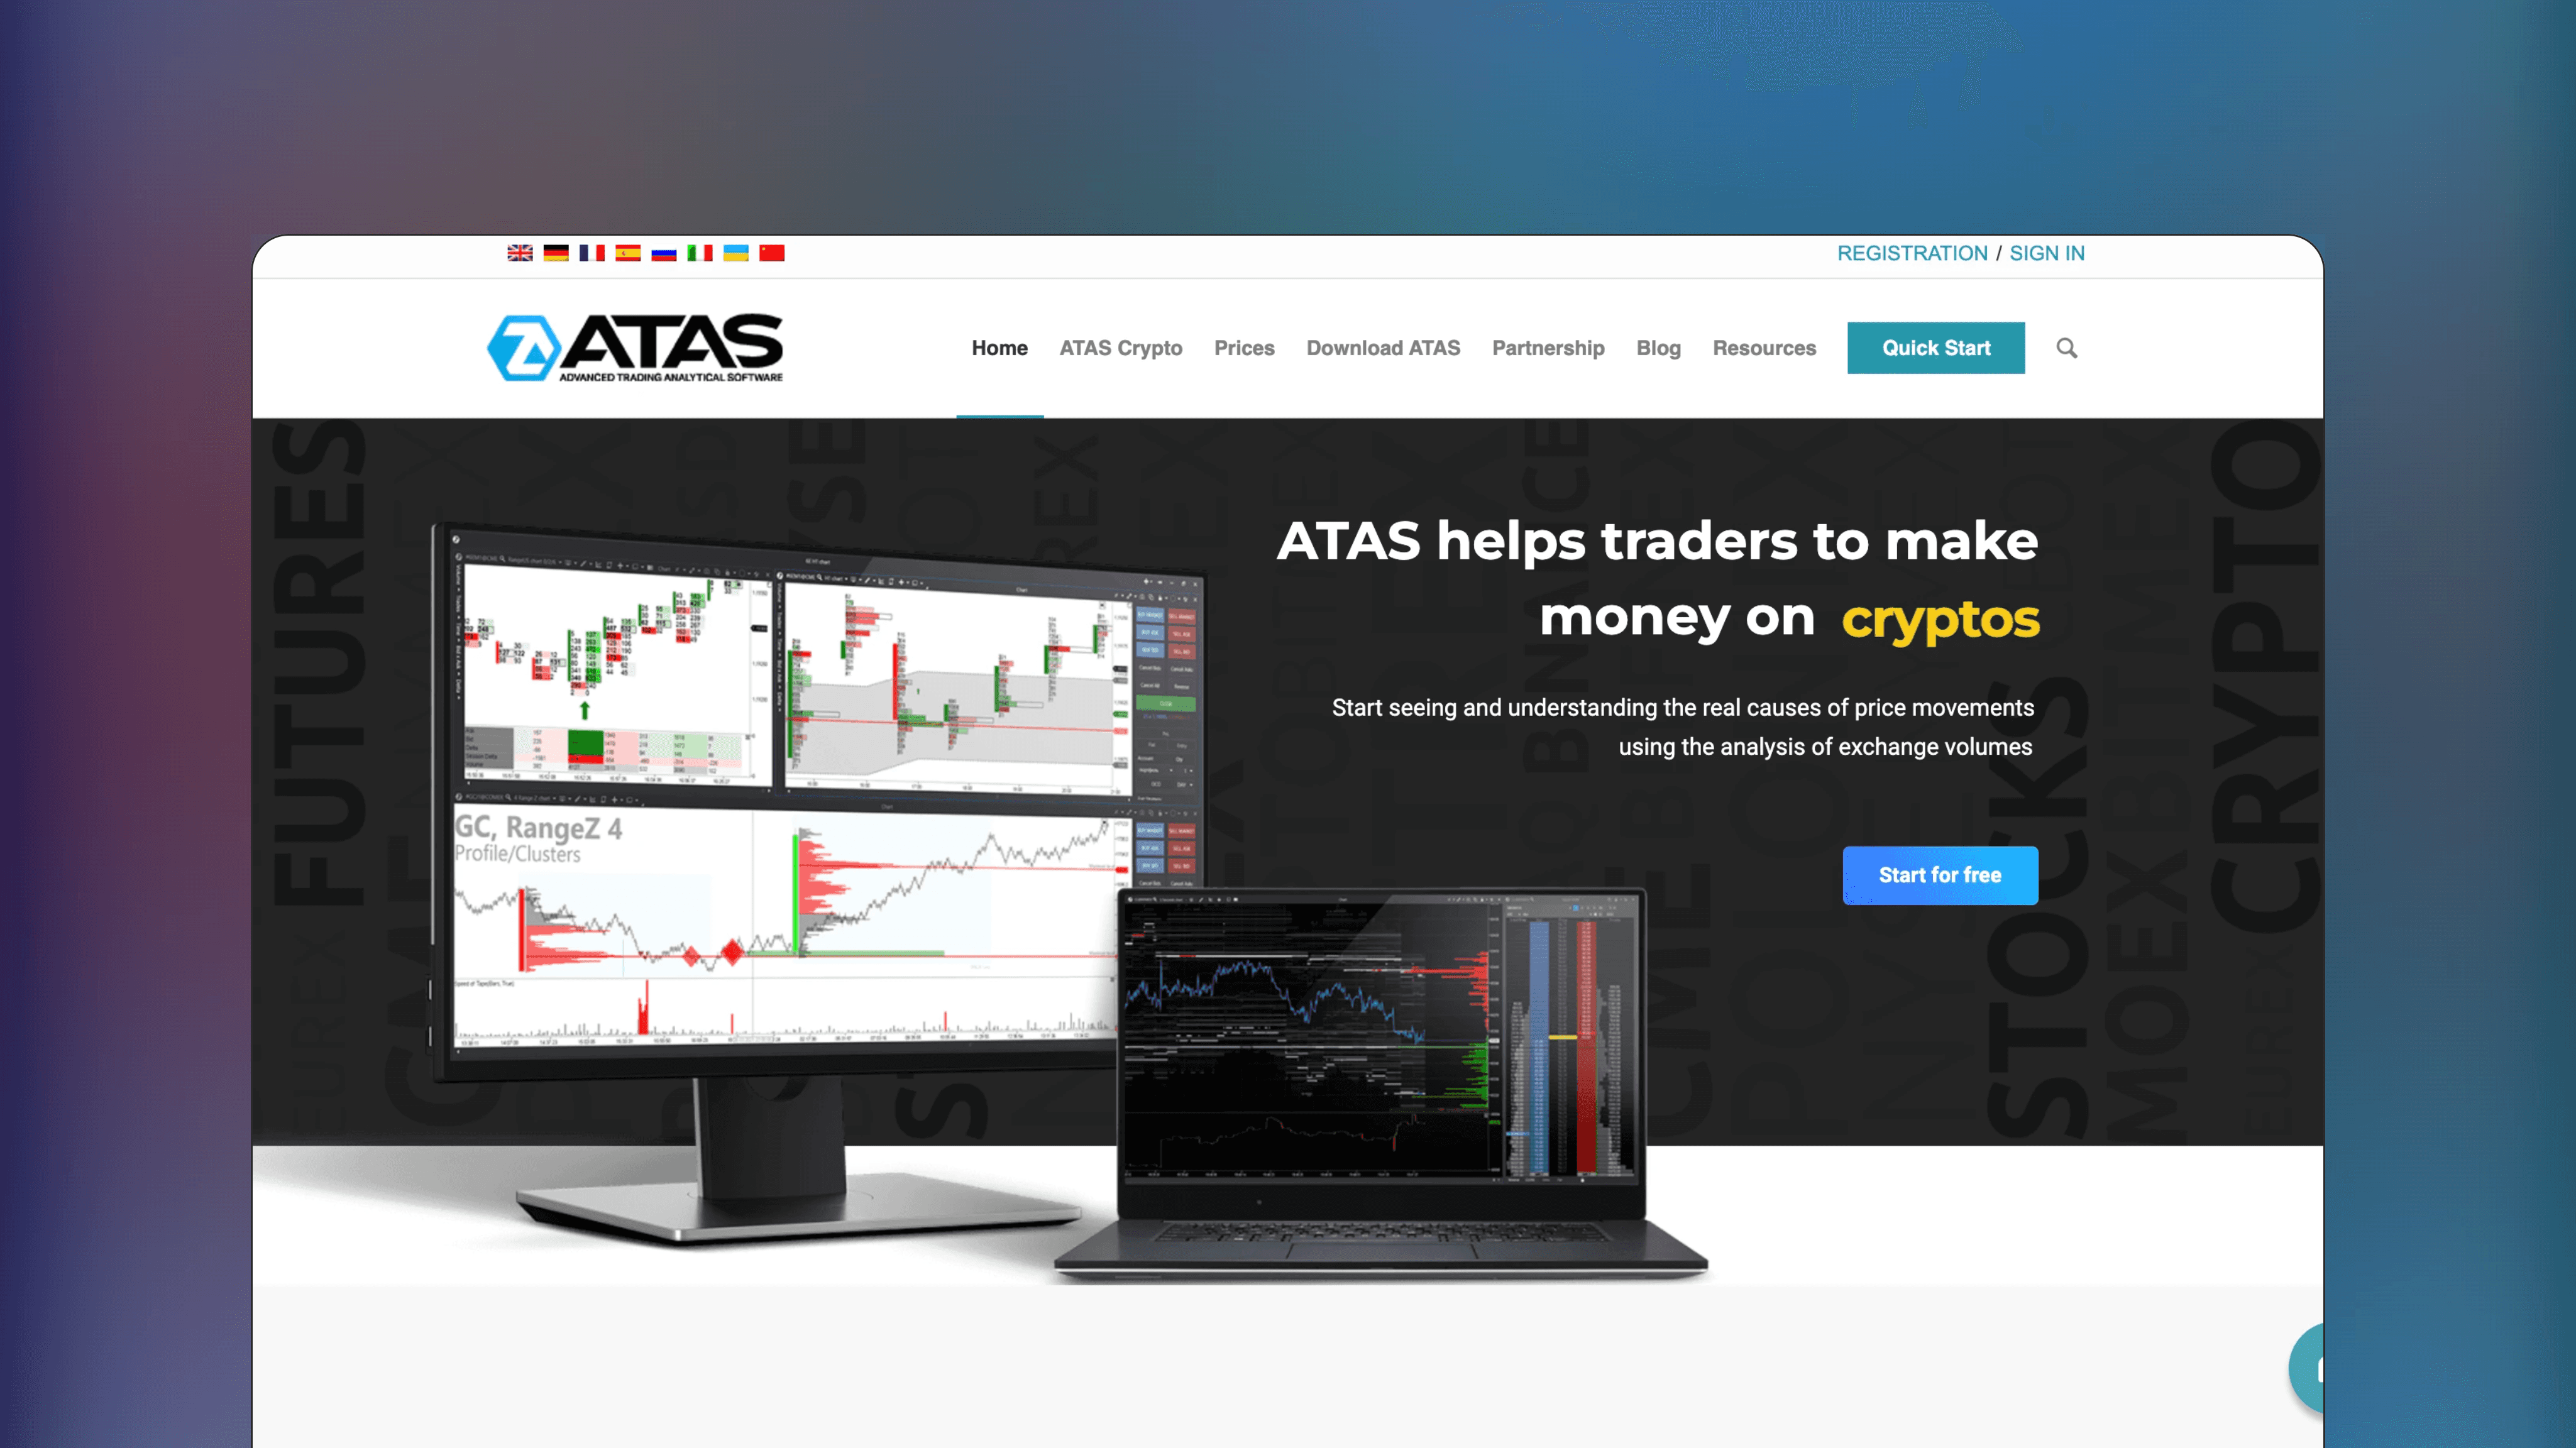
Published by ATAS


Track liquidations with visual heatmaps
Use liquidation bubbles and heatmaps to see where leveraged positions got forced out. These levels often mark significant turning points in price.
Analyze order flow through footprints and profiles
Volume footprints break down each candle by traded volume per price. See whether a move was driven by aggressive buyers, passive sellers or a combination.
Access real-time orderbook visualization
DOM analysis and cluster charts reveal where limit orders sit and how they interact with market orders in real time across supported markets.
What makes ATAS different from standard charting platforms?
ATAS focuses specifically on order flow analysis. Its core strength is visualizing buyer and seller interaction at each price level through footprints, heatmaps and cluster charts. Standard platforms focus on price; ATAS focuses on the mechanics behind price.
What markets does ATAS support?
ATAS supports stocks, futures and cryptocurrency markets through connections to various data providers and exchanges. This allows traders to apply consistent order flow methodology across asset classes using the same toolset.
Is ATAS suitable for beginners?
ATAS is a professional-grade tool with a learning curve. Beginners may find the depth of features overwhelming initially. However, traders committed to learning order flow analysis will find ATAS provides comprehensive tools for that methodology.
⭐️
⭐️
⭐️
⭐️
⭐️


🔥
New Listings
Featured this week


📟
Similar Listings
Traders also viewed
All

📟
Paid
Technical Analysis Platform
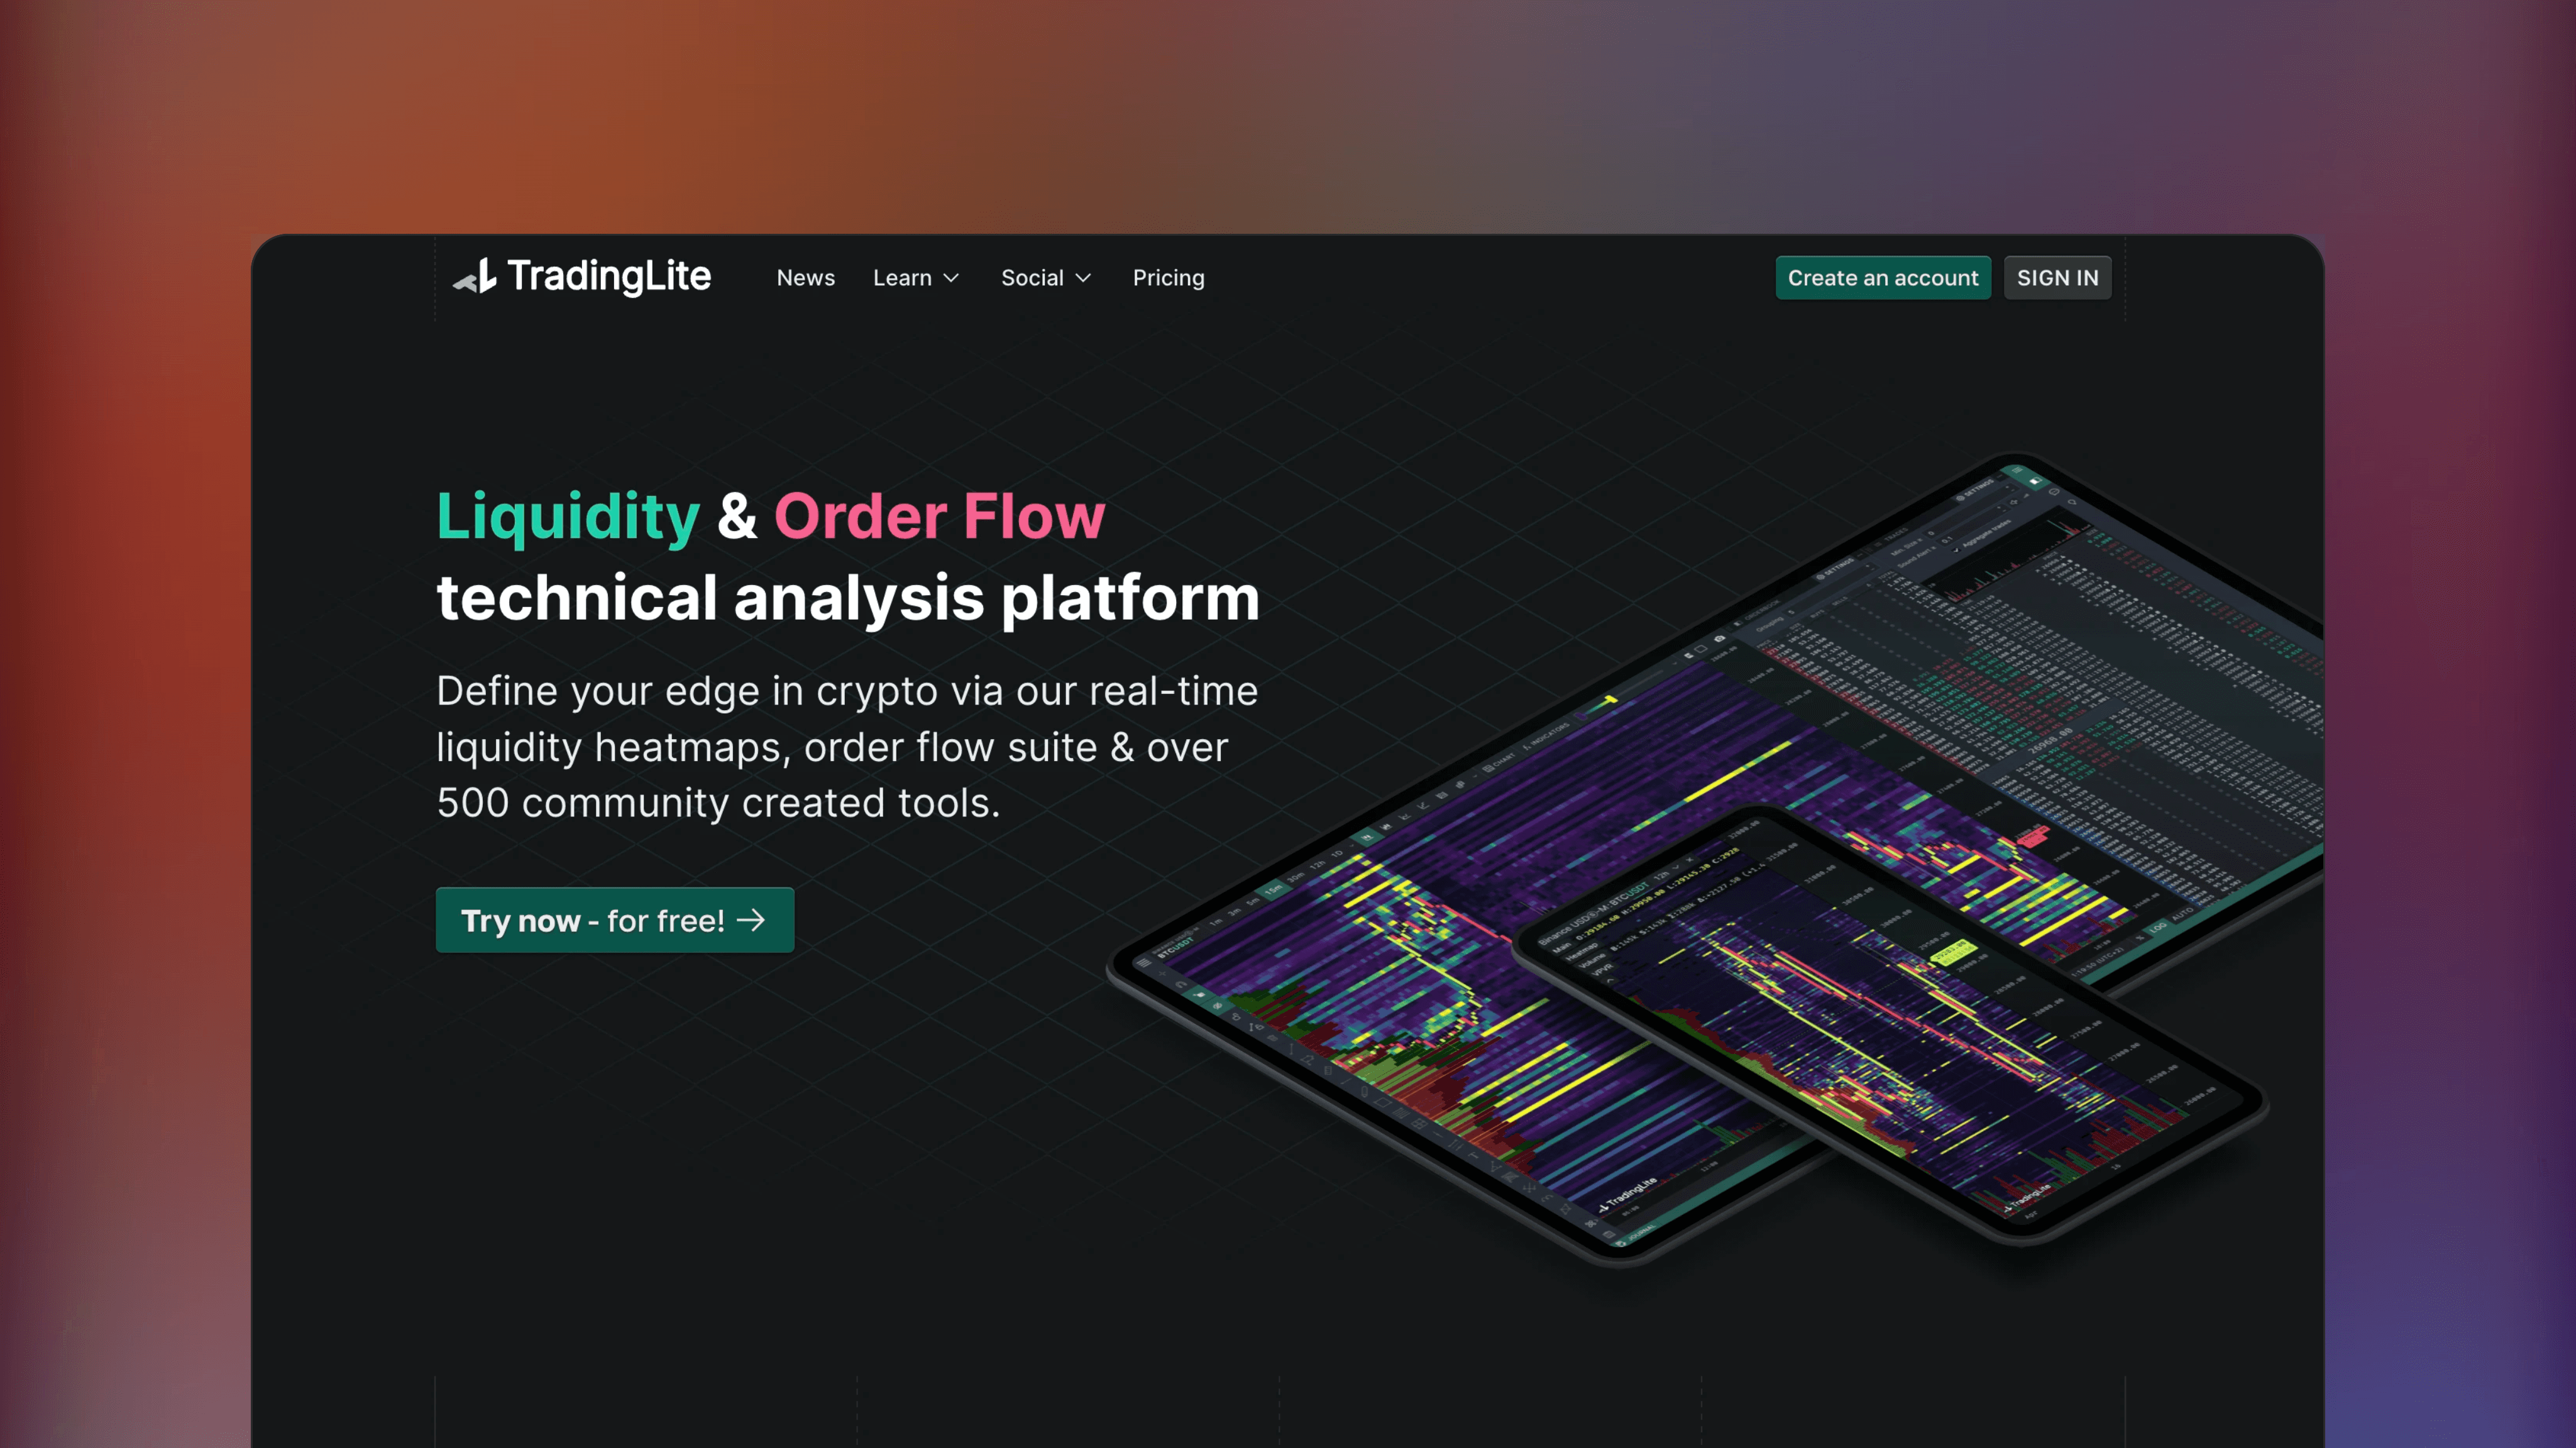
TradingLite
🌐
✅
🏅
TradingLite is a web-based platform for cryptocurrency orderflow analysis, offering advanced tools like liquidity heatmaps, volume profiles, footprints and hundreds of community created indicators.
📟
Free*
Technical Analysis Platform
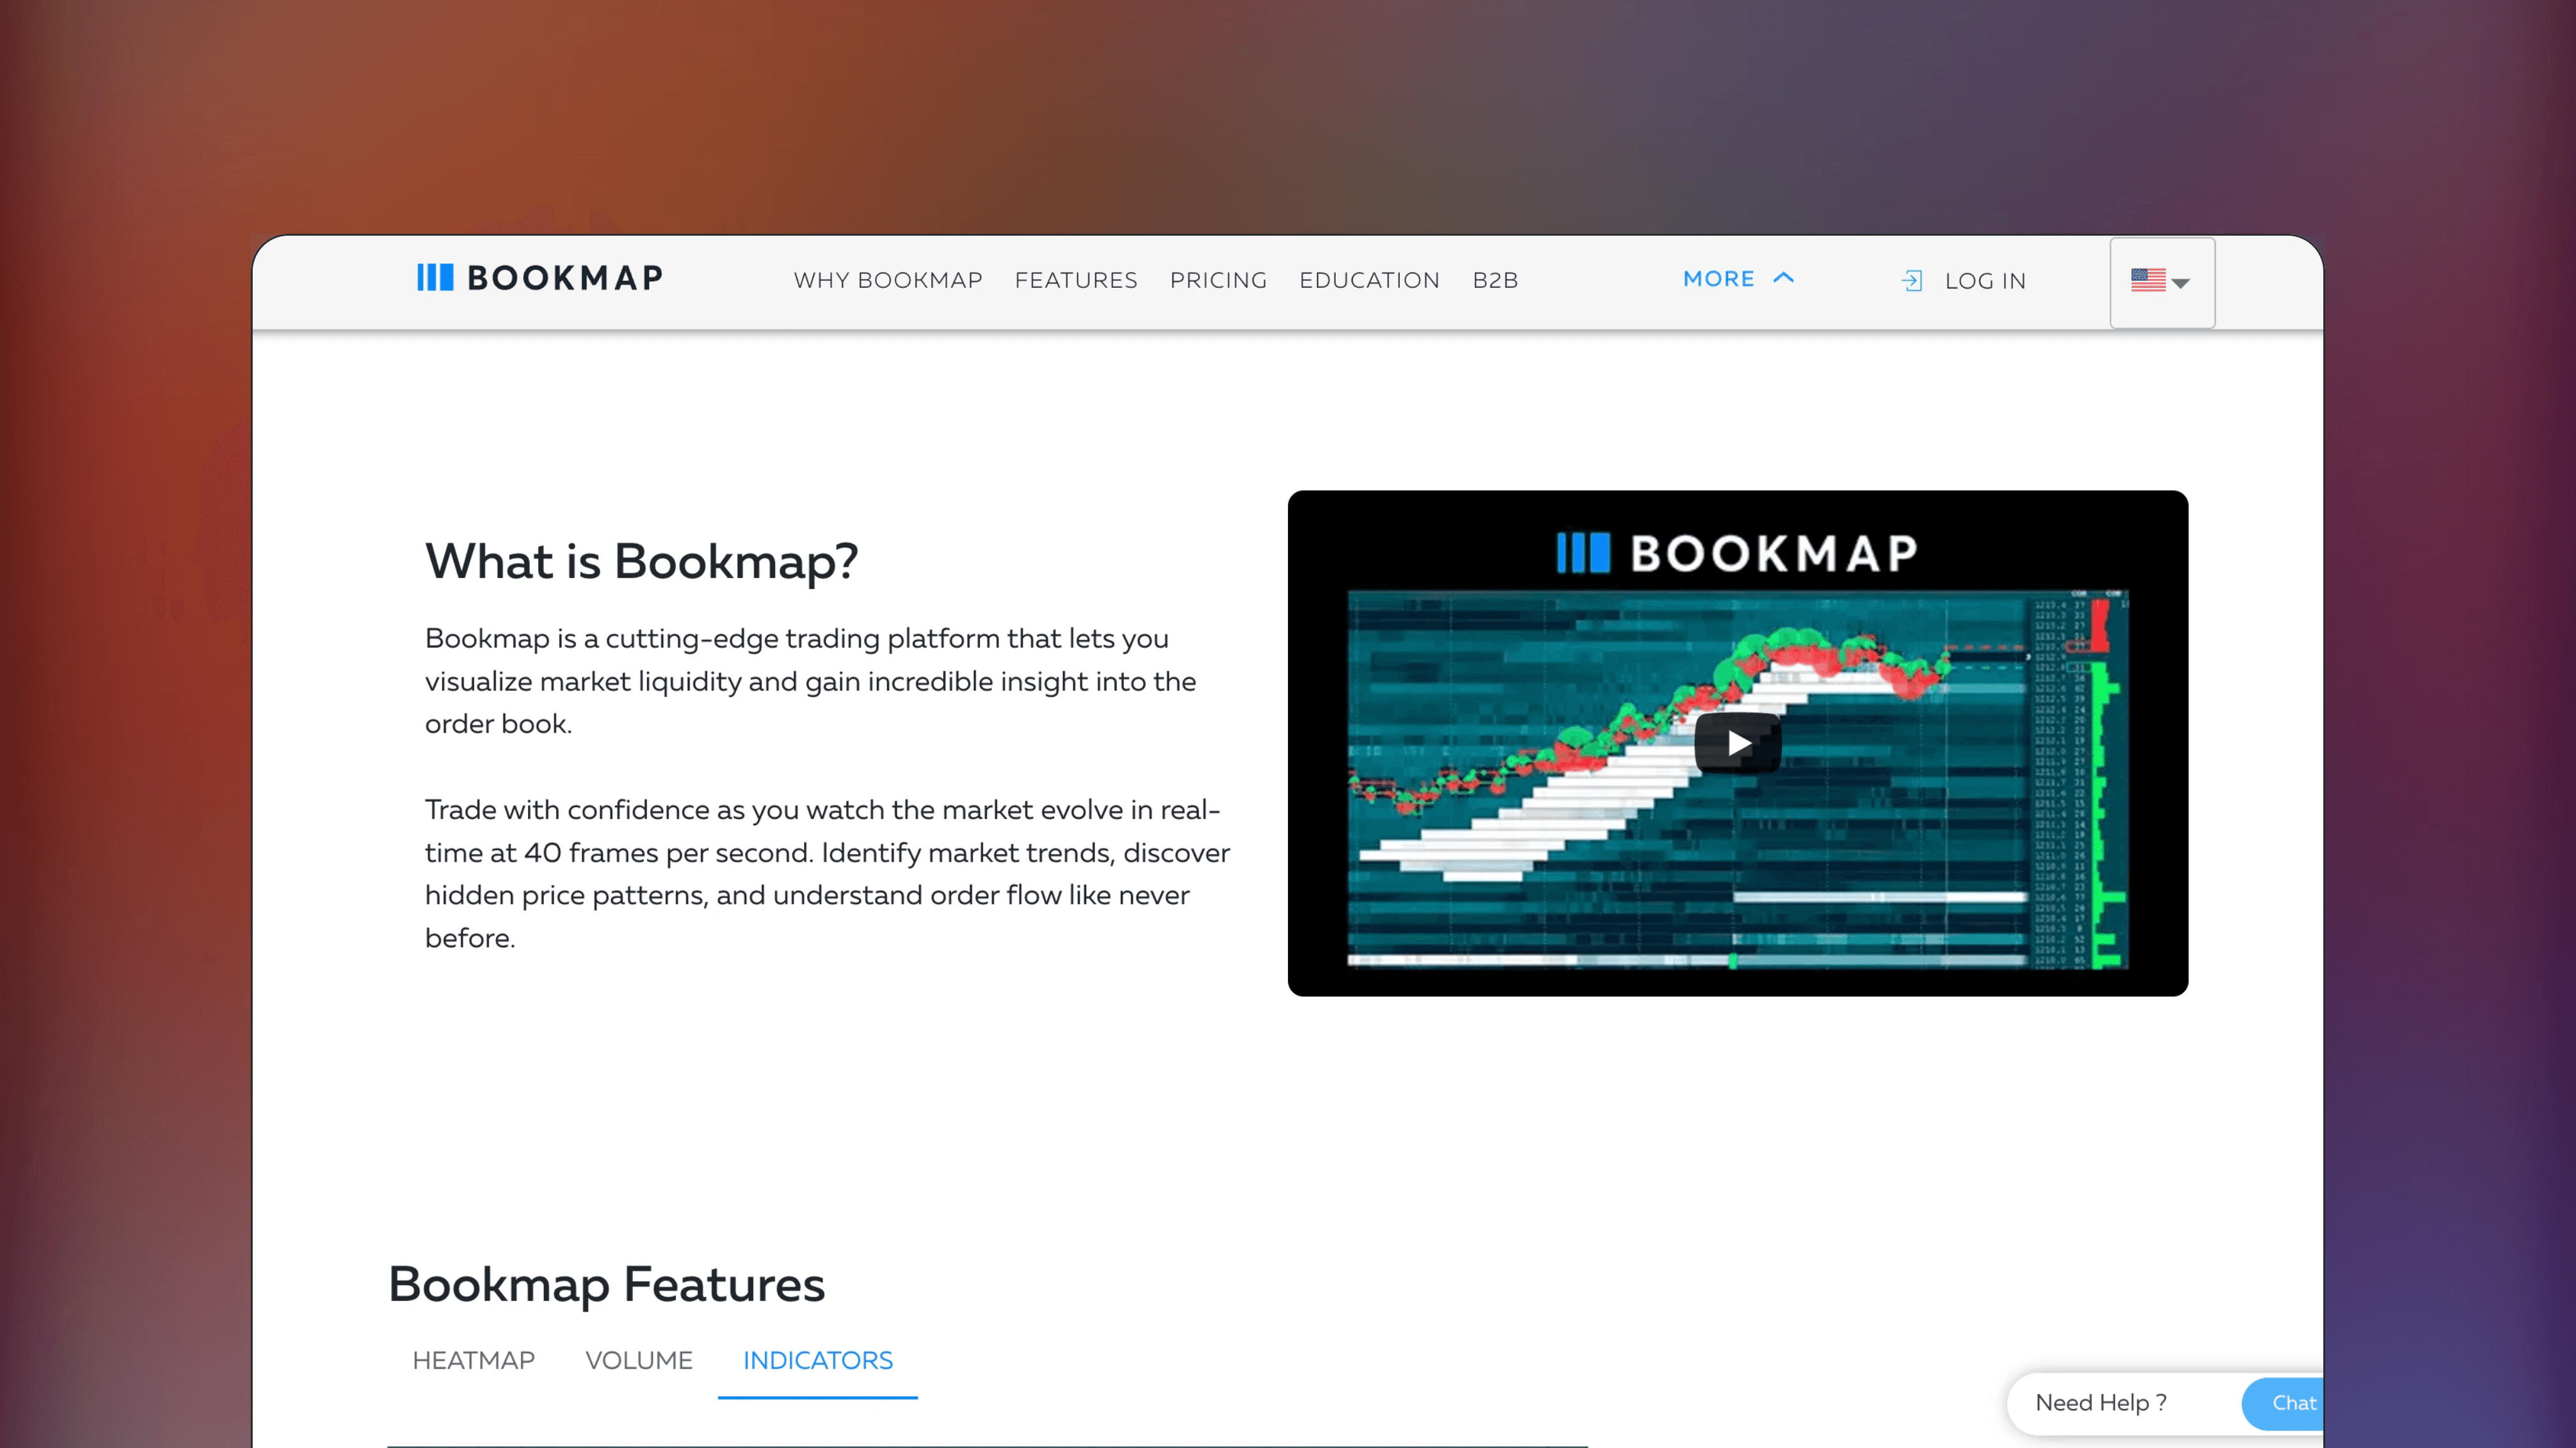
Bookmap
🌐
✅
🏅
Bookmap hosts a range of advanced order flow tools like liquidity heatmaps, liquidation bubbles and volume profiles with real-time and accurate orderbook data.
📟
Paid
Technical Analysis Platform
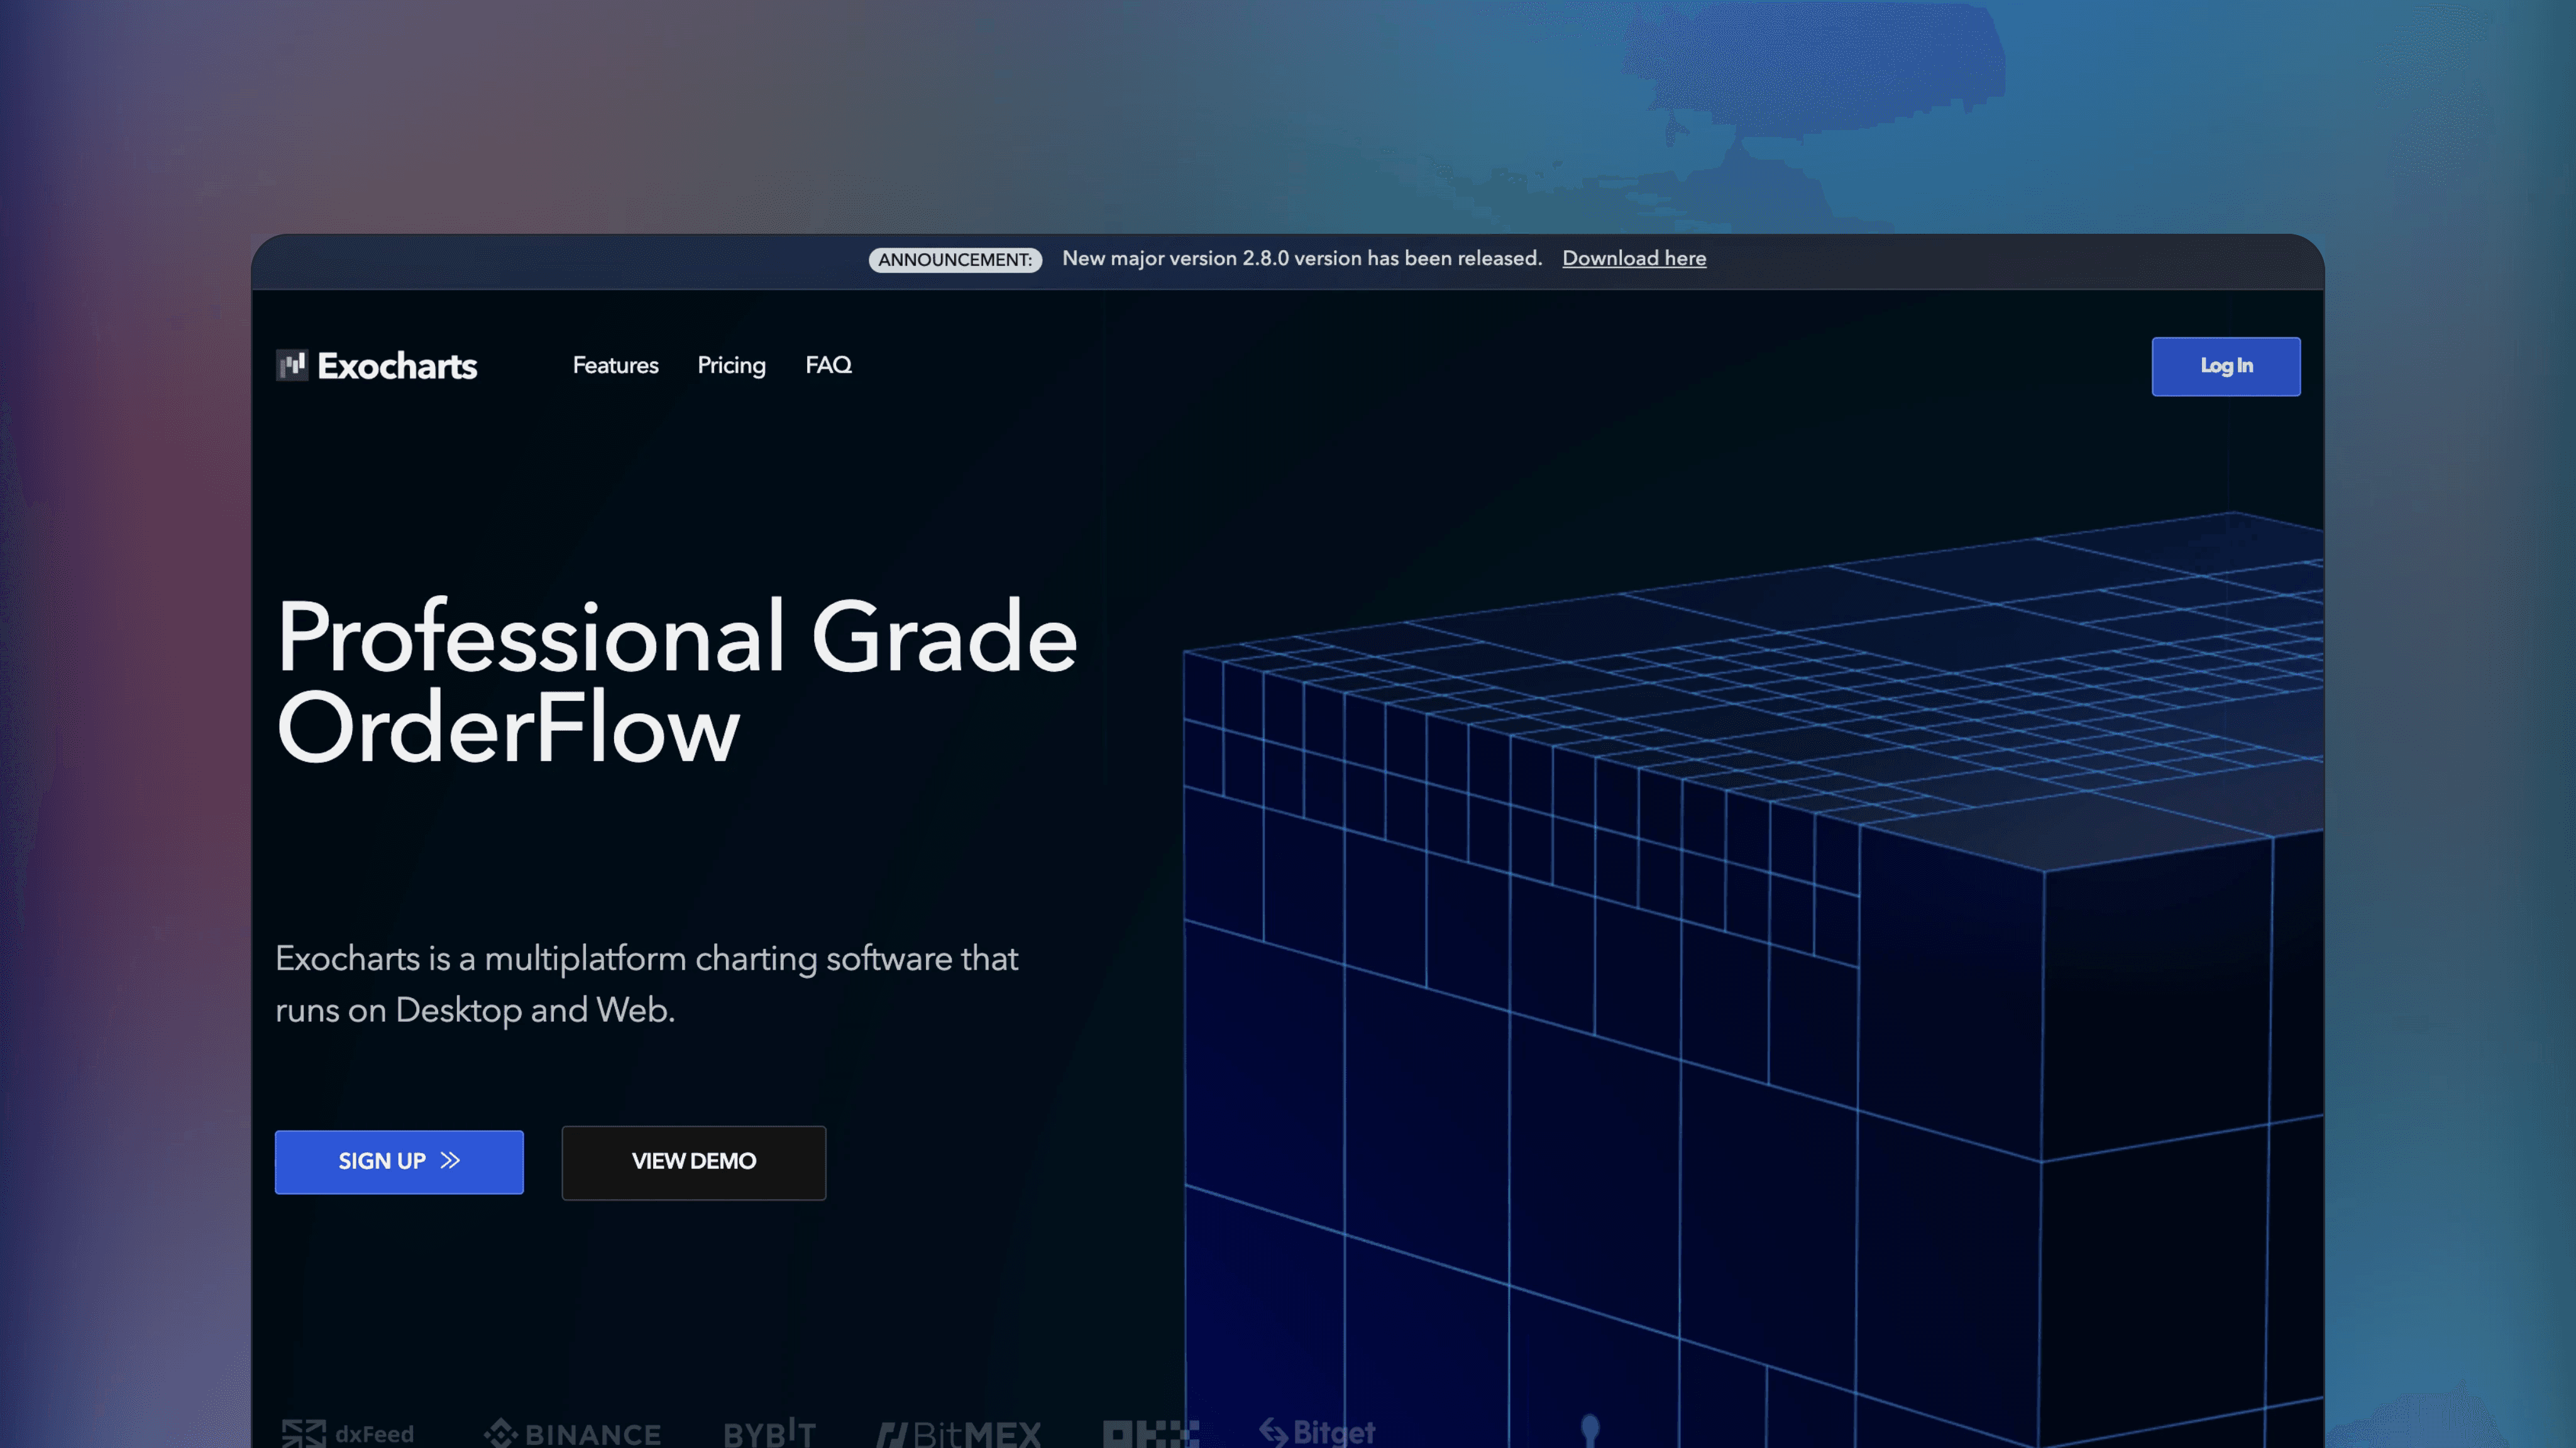
Exocharts
🌐
✅
🏅
Exocharts provides advanced orderflow tools like volume profiles, DOM ladder and volume footprint for cryptocurrency and legacy markets. Available in both web and desktop versions.
📟
Paid
Technical Analysis Platform
Sierra Charts
🌐
✅
🏅
Sierra Charts is a desktop trading platform offering advanced orderflow tools like cumulative volume delta, volume profile and footprints based on true order book data.
📟
Paid
Technical Analysis Platform
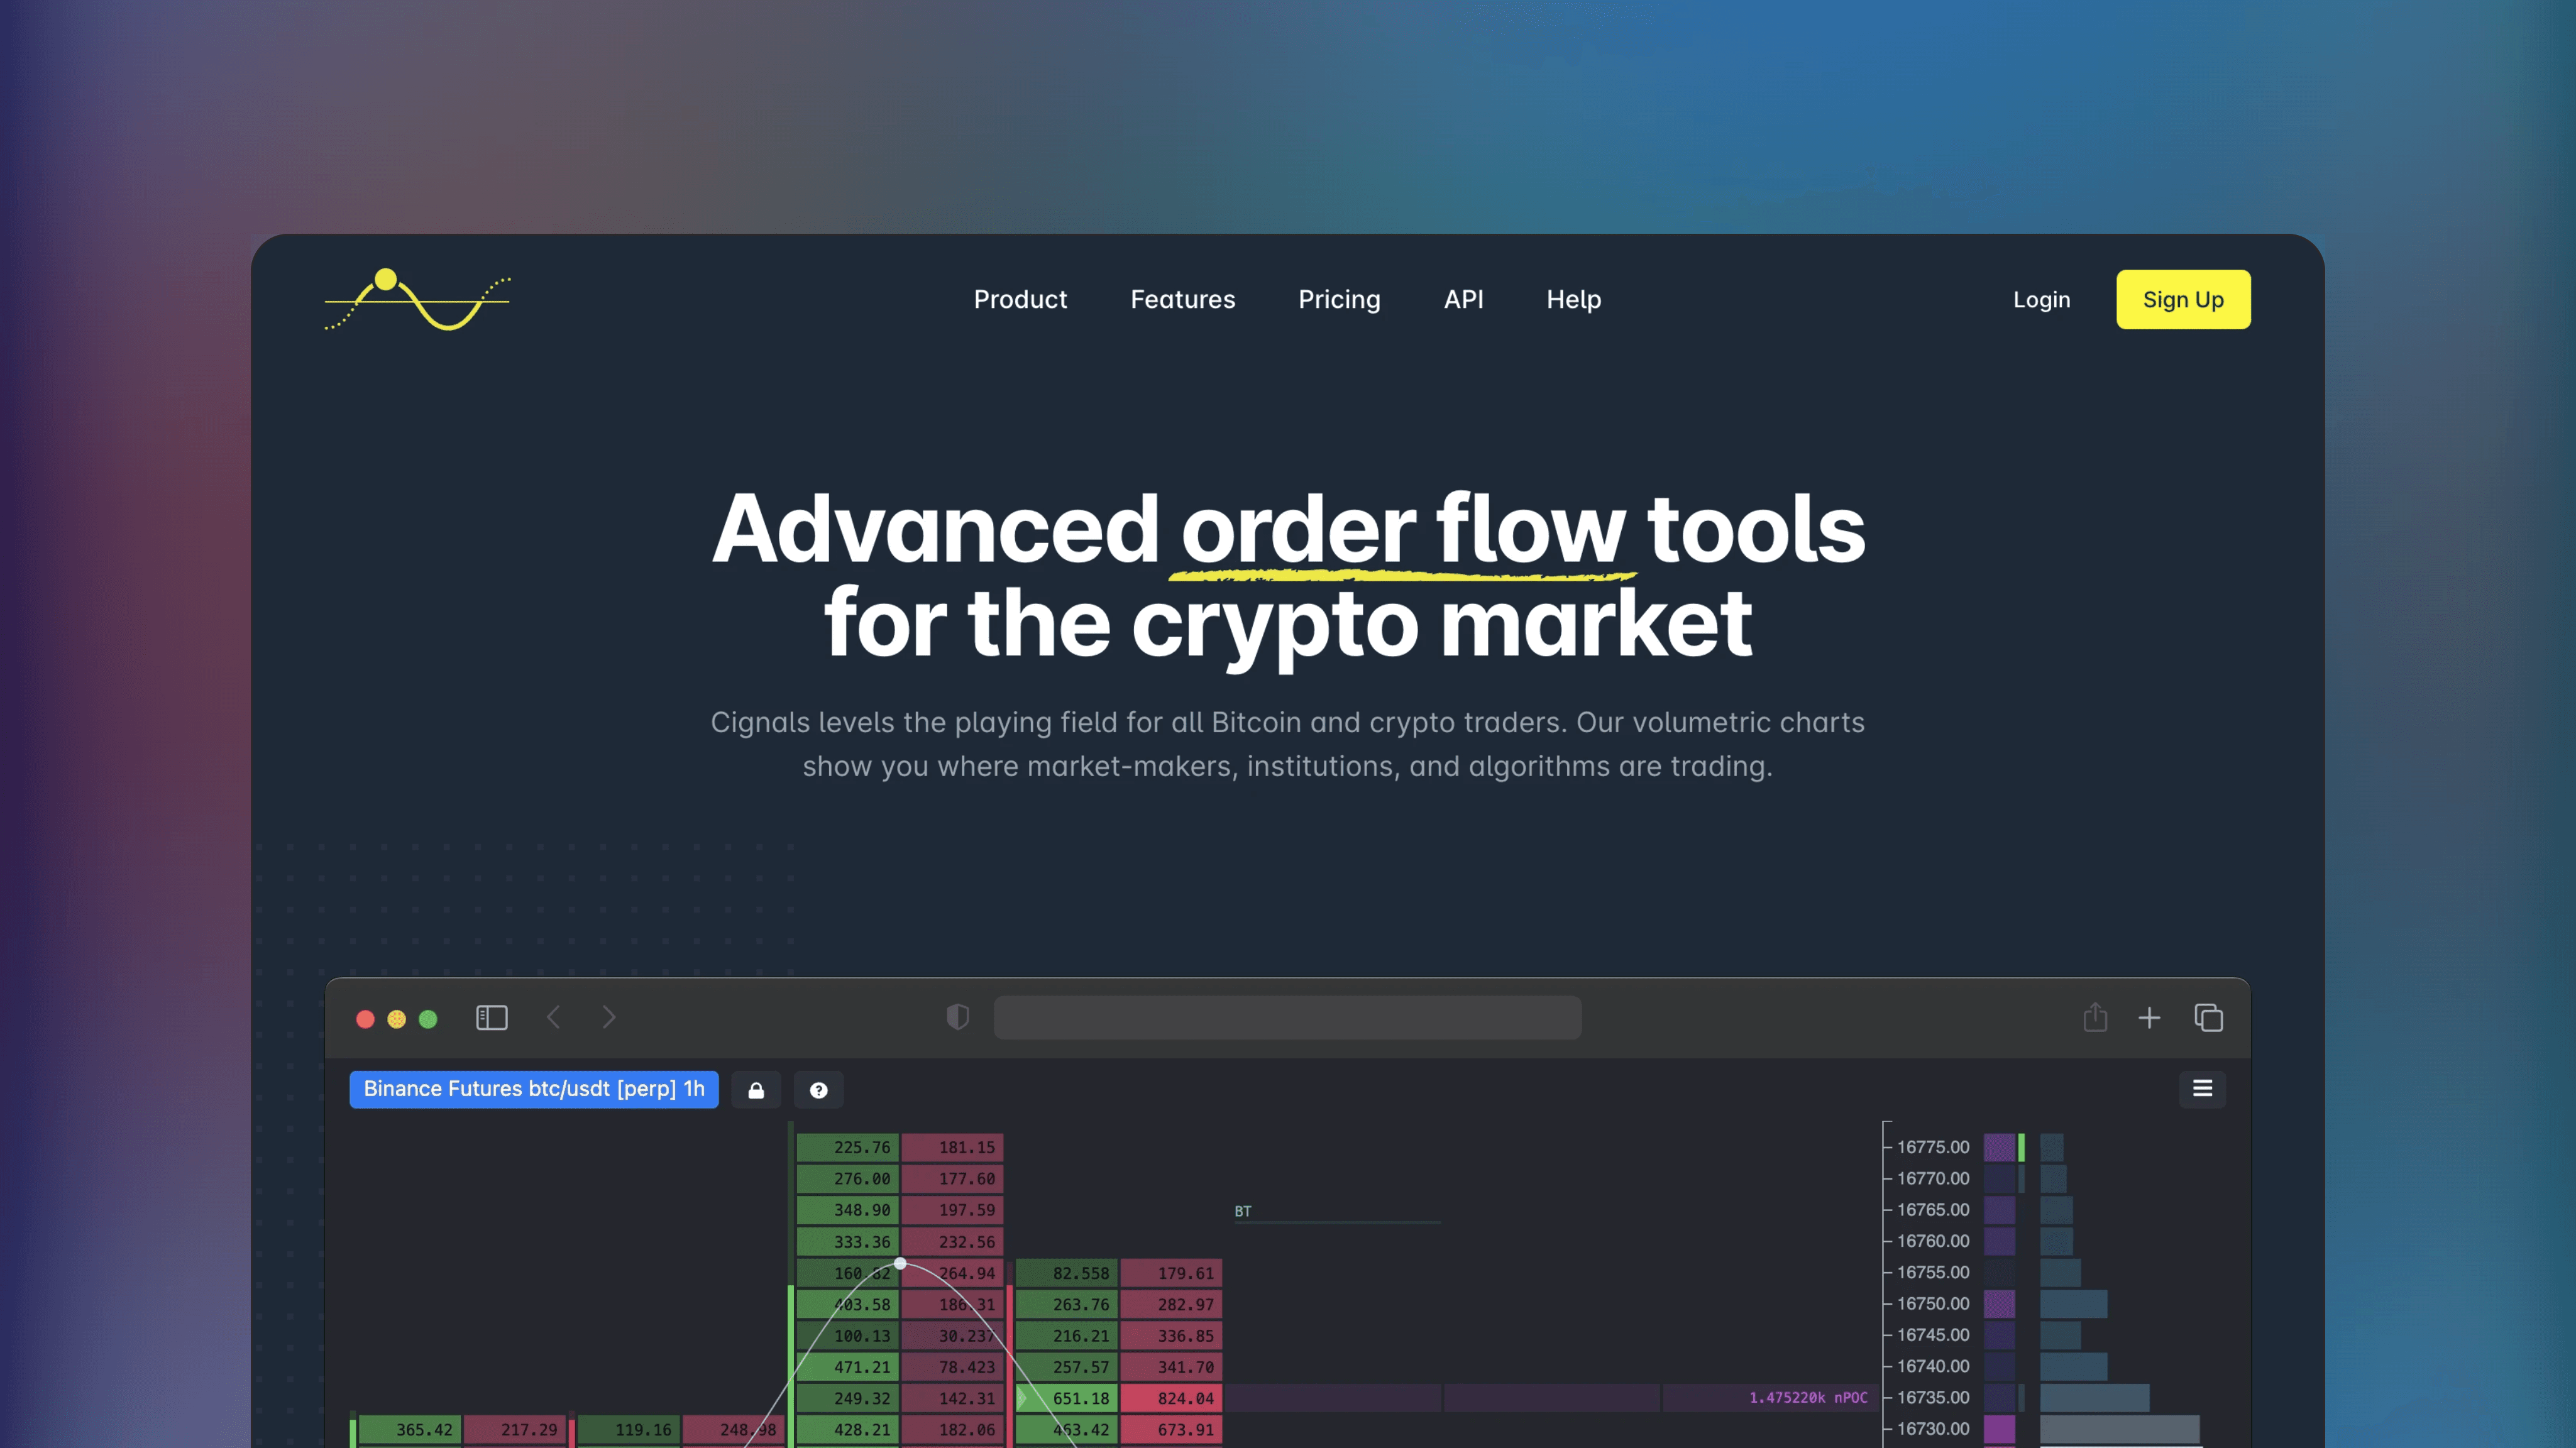
Cignals
🌐
✅
Cignals offers advanced order flow tools like volume profiles, DOM ladder and volume footprint for cryptocurrency markets with direct integration to cryptocurrency exchanges.
📟
Free*
Technical Analysis Platform
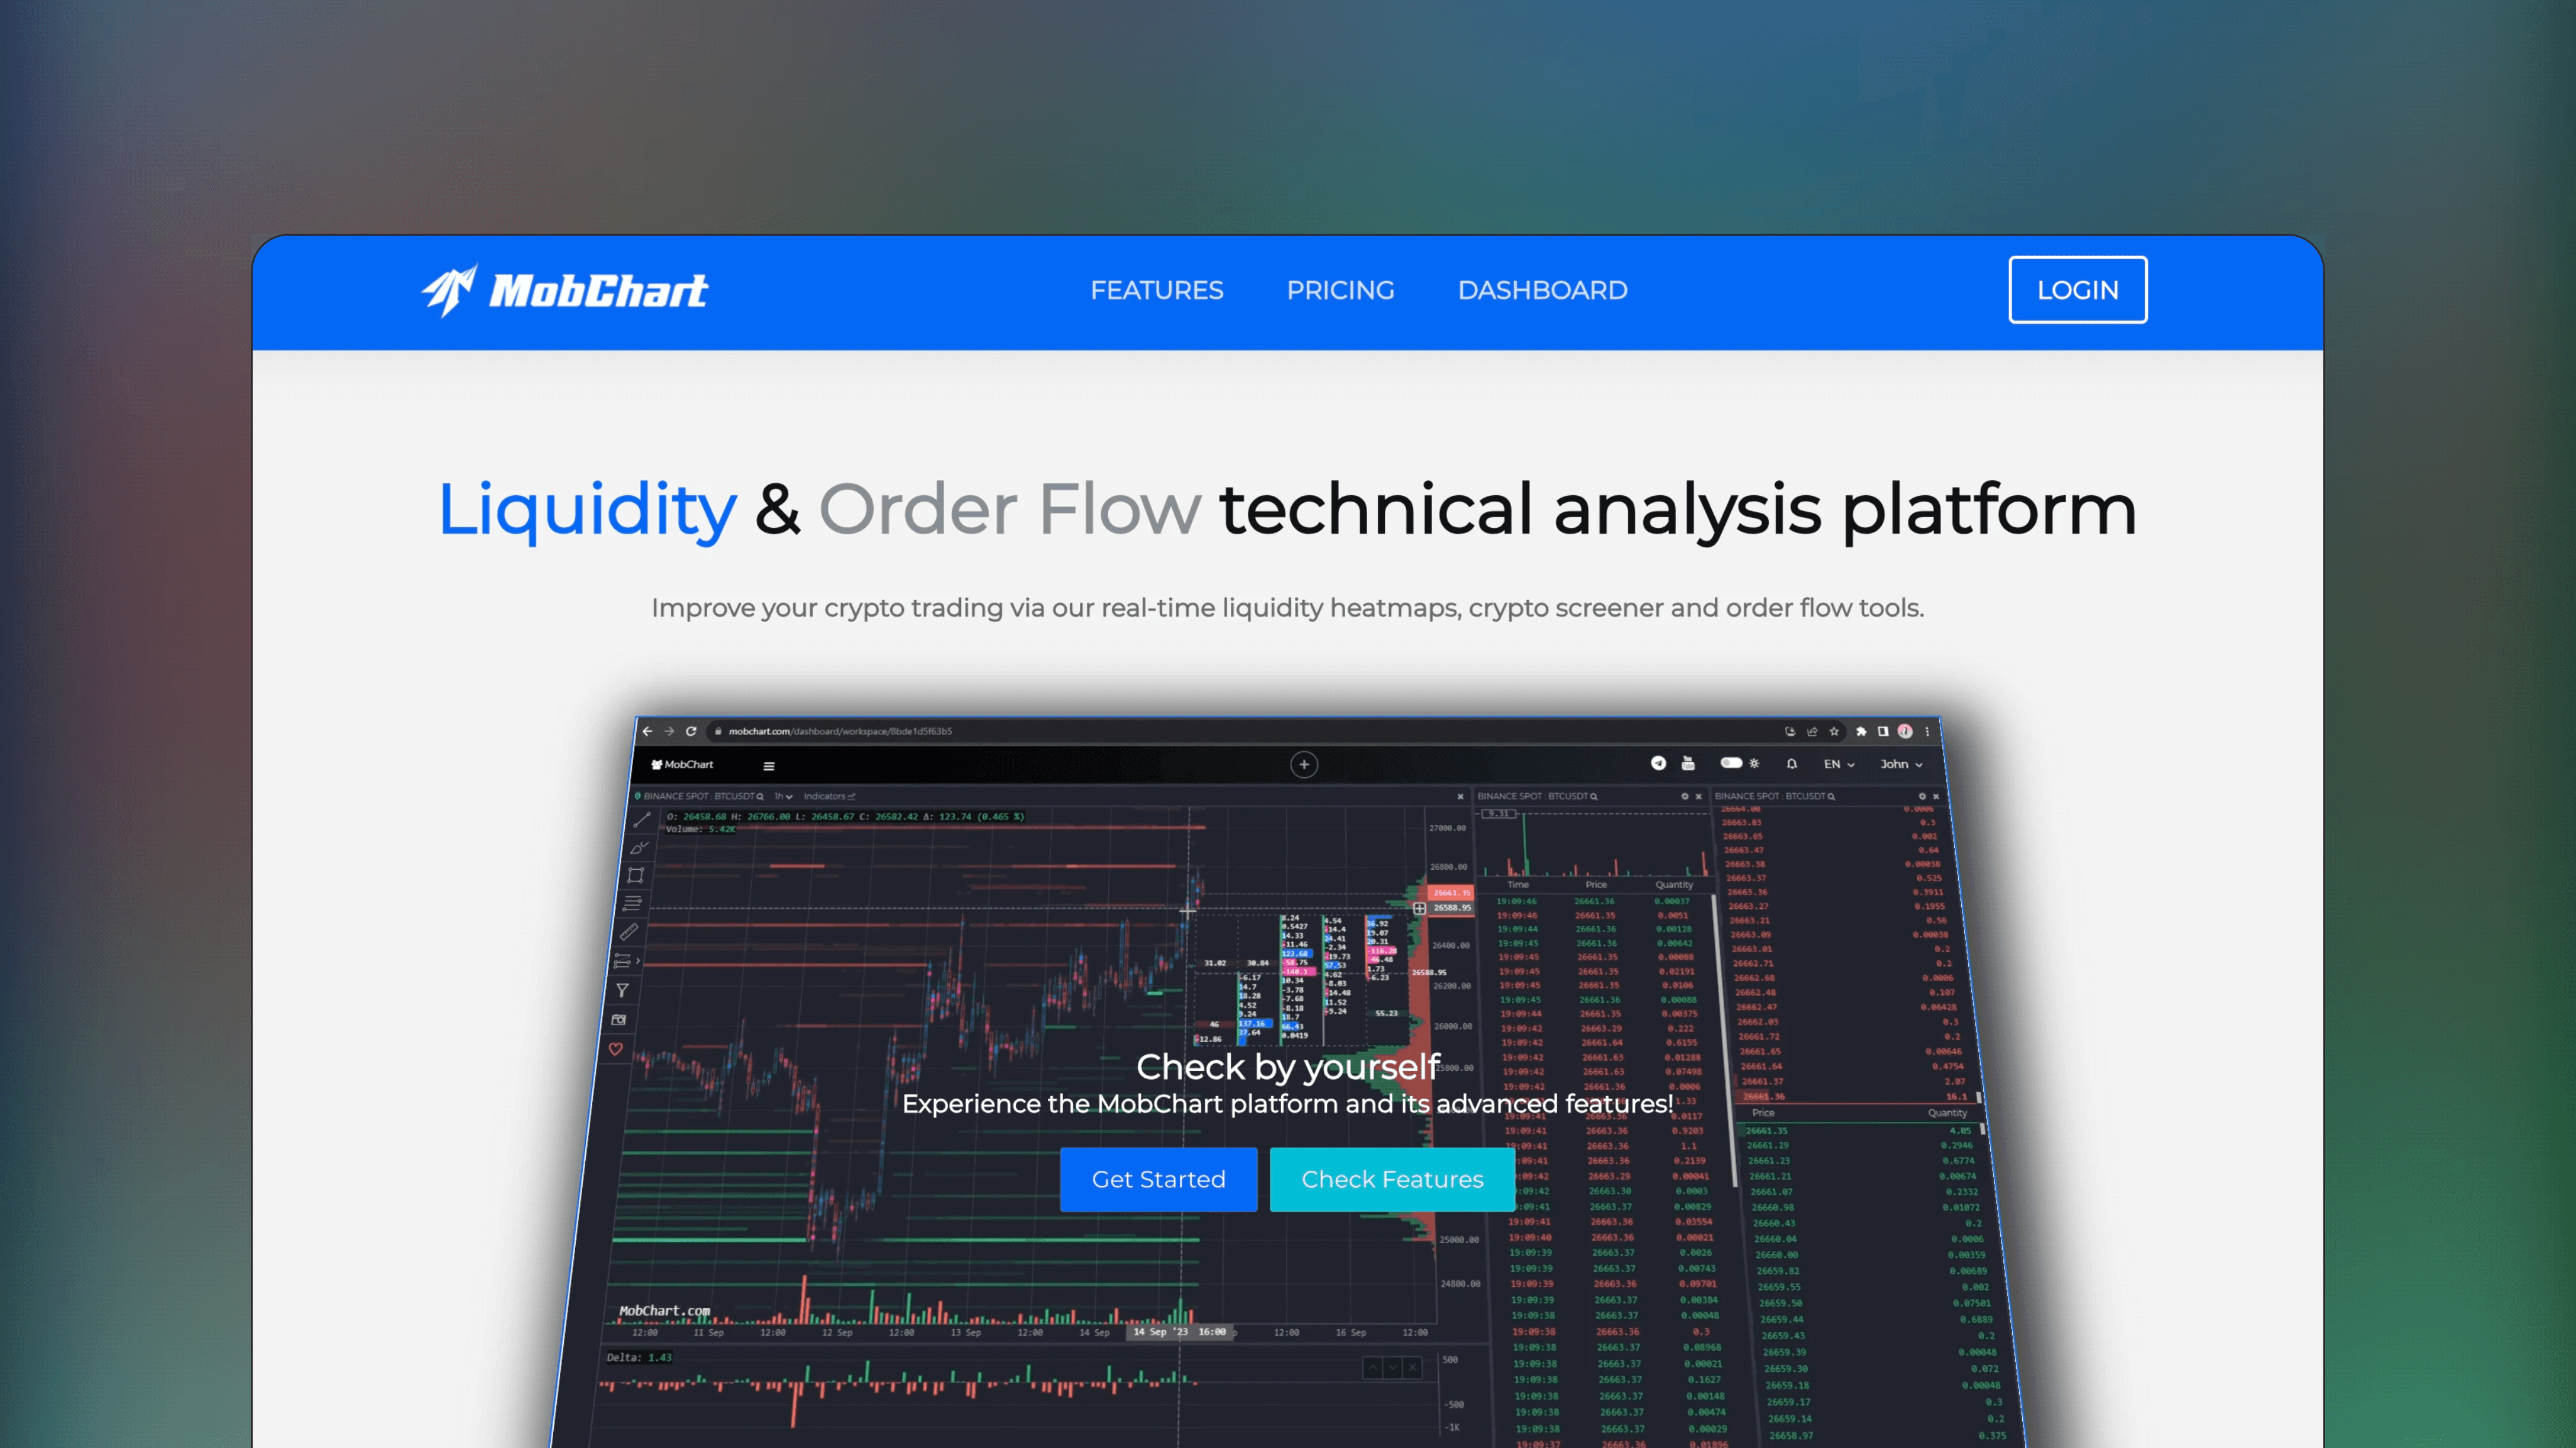
MobChart
🌐
✅
MobChart is a platform offering basic orderflow capabilities, such as volume profile, volume delta and liquidity heatmap for cryptocurrencies. The platform also offers screeners for scanning volume events across the markets. Free and paid options available.
📟
Paid
Technical Analysis Platform
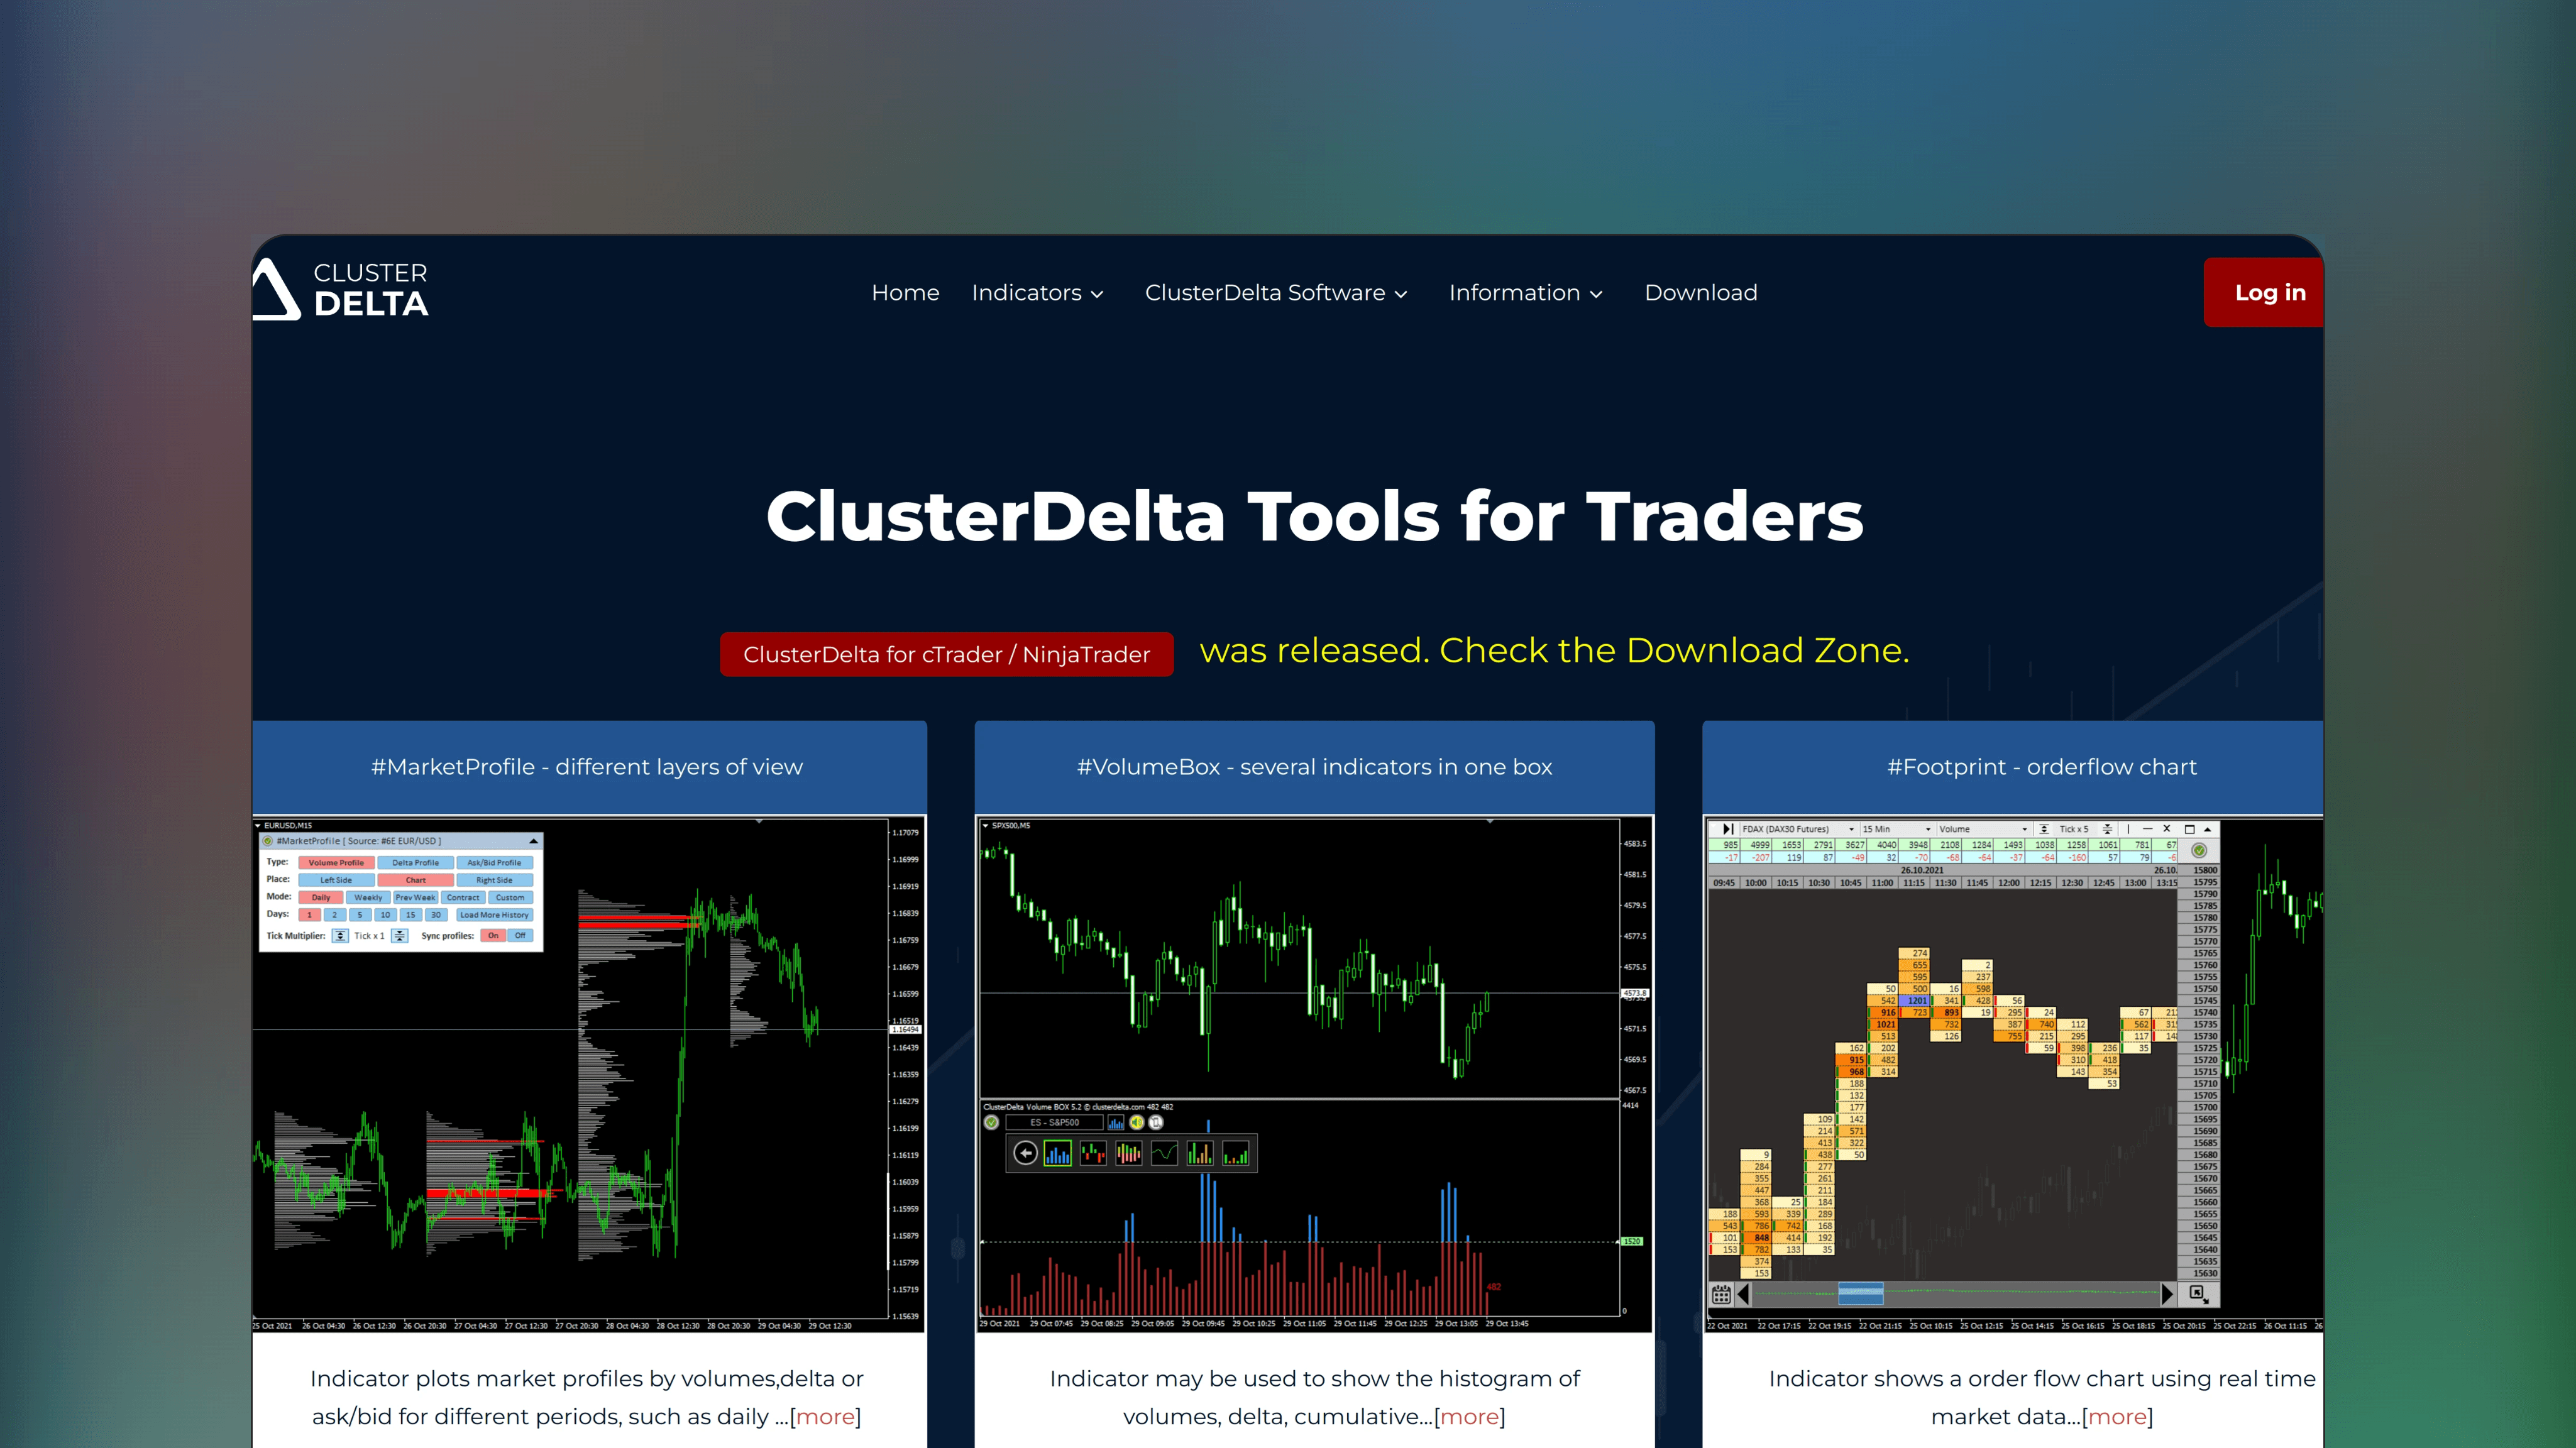
ClusterDelta
🌐
✅
ClusterDelta features advanced order flow tools like volume profiles, DOM ladder and volume footprint with customizable charts and various indicators for technical analysis.
📟
Free*
Technical Analysis Platform
PipFlow
🌐
✅
PipFlow provides a variety of advanced order flow tools like volume footprint, liquidity heatmap, market profile and real-time Level II data analysis. For futures, stocks and cryptocurrencies on multiple devices.