

From TradersList Editors
From TradersList Editors
Gain insights into overall market trends and individual stock performance by visualizing real-time candles for top S&P 500 stocks.
Gain insights into overall market trends and individual stock performance by visualizing real-time candles for top S&P 500 stocks.


TradingView Indicator
TradingView Indicator
Top 40 S&P 500 Constituents Indicator: Real-Time Side-by-Side Stock Performance Tracking
Top 40 S&P 500 Constituents Indicator: Real-Time Side-by-Side Stock Performance Tracking

by iravan on TradingView
by iravan on TradingView
🤖
🤖
Top 40 constituents of S&P 500 Index
Top 40 constituents of S&P 500 Index
Top 40 constituents of S&P 500 Index is a free TradingView Indicator presenting real-time candle data for the top 40 S&P 500 stocks side-by-side, highlighting broad market breadth and depth in a given time frame.
Top 40 constituents of S&P 500 Index is a free TradingView Indicator presenting real-time candle data for the top 40 S&P 500 stocks side-by-side, highlighting broad market breadth and depth in a given time frame.

Get on TradingView
This indicator is available on TradingView web charting platform. Signing up for a free account is required, no downloads.
Get on TradingView
This indicator is available on TradingView web charting platform. Signing up for a free account is required, no downloads.
🔑
Open Source
Listing has publically available source code that can be audited and modified as needed.
🔑
Open Source
Listing has publically available source code that can be audited and modified as needed.
💸
Free Access
All features of this listing are fully free to use with no pricing tiers. Simply start using.
💸
Free Access
All features of this listing are fully free to use with no pricing tiers. Simply start using.
✅
Robust Theory
Concepts and theories mentioned in listing are based on generally approved and well established notions.
✅
Robust Theory
Concepts and theories mentioned in listing are based on generally approved and well established notions.
🌐
Popular Topic
Concepts and theories mentioned in listing are popular topics in web search
🌐
Popular Topic
Concepts and theories mentioned in listing are popular topics in web search
Published by iravan on TradingView
Published by iravan on TradingView
Real-Time Index Component Tracking
The S&P 500 is driven by its largest holdings. This indicator displays real-time candle data for the top 40 constituents by market capitalization, giving traders direct visibility into the stocks that have the most influence on the index's direction without needing to open dozens of separate charts.
Why the Top 40 Matter Most
The S&P 500 is market-cap weighted, meaning the largest companies move the index far more than smaller ones. The top 40 stocks typically represent over 50% of the total index weight. Monitoring them reveals whether a broad market move is driven by genuine breadth or just a handful of mega-caps.


Breadth Analysis at a Glance
When most of the top 40 are green while the index is flat, it may signal hidden weakness in the rest of the index. Conversely, if only a few mega-caps are rising and the majority are red, the rally lacks participation - a condition that often precedes a pullback in the broader market.
Sector Concentration Insights
The top 40 list reveals which sectors dominate the index at any given time. Heavy concentration in technology names, for example, means the S&P 500 is effectively a proxy for tech performance. Tracking these constituents helps traders understand what they are actually exposed to when trading the index.
Market breadth at glance
Market breadth at glance
This indicator displays real-time candle data for the top 40 S&P 500 stocks side-by-side. Since these constituents represent over 50% of index weight, monitoring them reveals whether broad moves are driven by genuine breadth or just a handful of mega-caps.
This indicator displays real-time candle data for the top 40 S&P 500 stocks side-by-side. Since these constituents represent over 50% of index weight, monitoring them reveals whether broad moves are driven by genuine breadth or just a handful of mega-caps.
Read Underlying Index Momentum
When most of the top 40 are green while the index is flat, hidden weakness exists elsewhere. If only a few mega-caps rise while the majority are red, the rally lacks participation.
Confirm Index Moves with Breadth
A broad market move confirmed by widespread green across top constituents carries more conviction than one driven by two or three names. Use breadth as confluence.
Identify Sector Concentration
The top 40 list reveals which sectors dominate the index. Heavy tech concentration means S&P 500 effectively tracks tech performance.
Common Questions About S&P 500 Constituent Analysis
Common Questions About S&P 500 Constituent Analysis
Tracking top S&P 500 constituents reveals how mega-cap stocks influence index movement and sector rotation. These questions address how to use constituent data for market breadth analysis and portfolio decisions.
Tracking top S&P 500 constituents reveals how mega-cap stocks influence index movement and sector rotation. These questions address how to use constituent data for market breadth analysis and portfolio decisions.
Why do the top stocks have such outsized influence on the index?
The S&P 500 is market-cap weighted, meaning larger companies like Apple and Microsoft move the index more than smaller constituents. A 1% move in a top-10 stock matters far more than the same move in a bottom-tier name.
How do I identify when index movement is broad versus concentrated?
Compare top constituent performance against equal-weighted measures. When the index rises but most constituents fall, gains are concentrated in few names. Healthy rallies show participation across many stocks rather than dependence on leaders.
Should I trade the index or individual top constituents?
Index products offer diversification and lower single-stock risk. Trading constituents allows targeting specific setups and sectors. Many traders use index analysis for bias then execute on individual names showing the best technical setups.
🌐
🌐
Web sentiment
Web sentiment
Reviewers of TradingView, for analyzing Top 40 constituents of S&P 500 Index, are highly positive, praising its ease of use, flexibility, and features as vital trading tools.
Reviewers of TradingView, for analyzing Top 40 constituents of S&P 500 Index, are highly positive, praising its ease of use, flexibility, and features as vital trading tools.
Source: Online Discussion
Source: Online Discussion
Source: Online Discussion
✍️
✍️
TradersList Reviews (5)
TradersList Reviews (5)
TradersList Community has given this listing four stars, indicating a well trusted listing with great utility value. This listing is one of the better ones on TradersList.
TradersList Community has given this listing four stars, indicating a well trusted listing with great utility value. This listing is one of the better ones on TradersList.
⭐️
⭐️
⭐️
⭐️
⭐️
Source: TradersList Reviews
Source: TradersList Reviews


Bookmark
Saved here
🤖
Get Indicator
Find Indicator
Review
Review Indicator
✍️
⭐️
⭐️
⭐️
⭐️
⭐️
3
Comments
Read on Telegram
Listing by third party publisher. Not financial advice.
Risk Disclosure


Share Listing
🤖
🤖
Get Indicator
Get Indicator
Find Indicator
Find Indicator
✍️
Review
Review
Review Indicator
Review Indicator
⭐️
⭐️
⭐️
⭐️
⭐️
Saved here
Bookmark
Listing by third party publisher. Not financial advice.
Listing by third party publisher. Not financial advice.
Risk Disclosure
Risk Disclosure
Share
🤖
3


🤖
3
🤖
3
✍️
By Author
More by iravan
🤖
by iravan

Free
TradingView Indicator
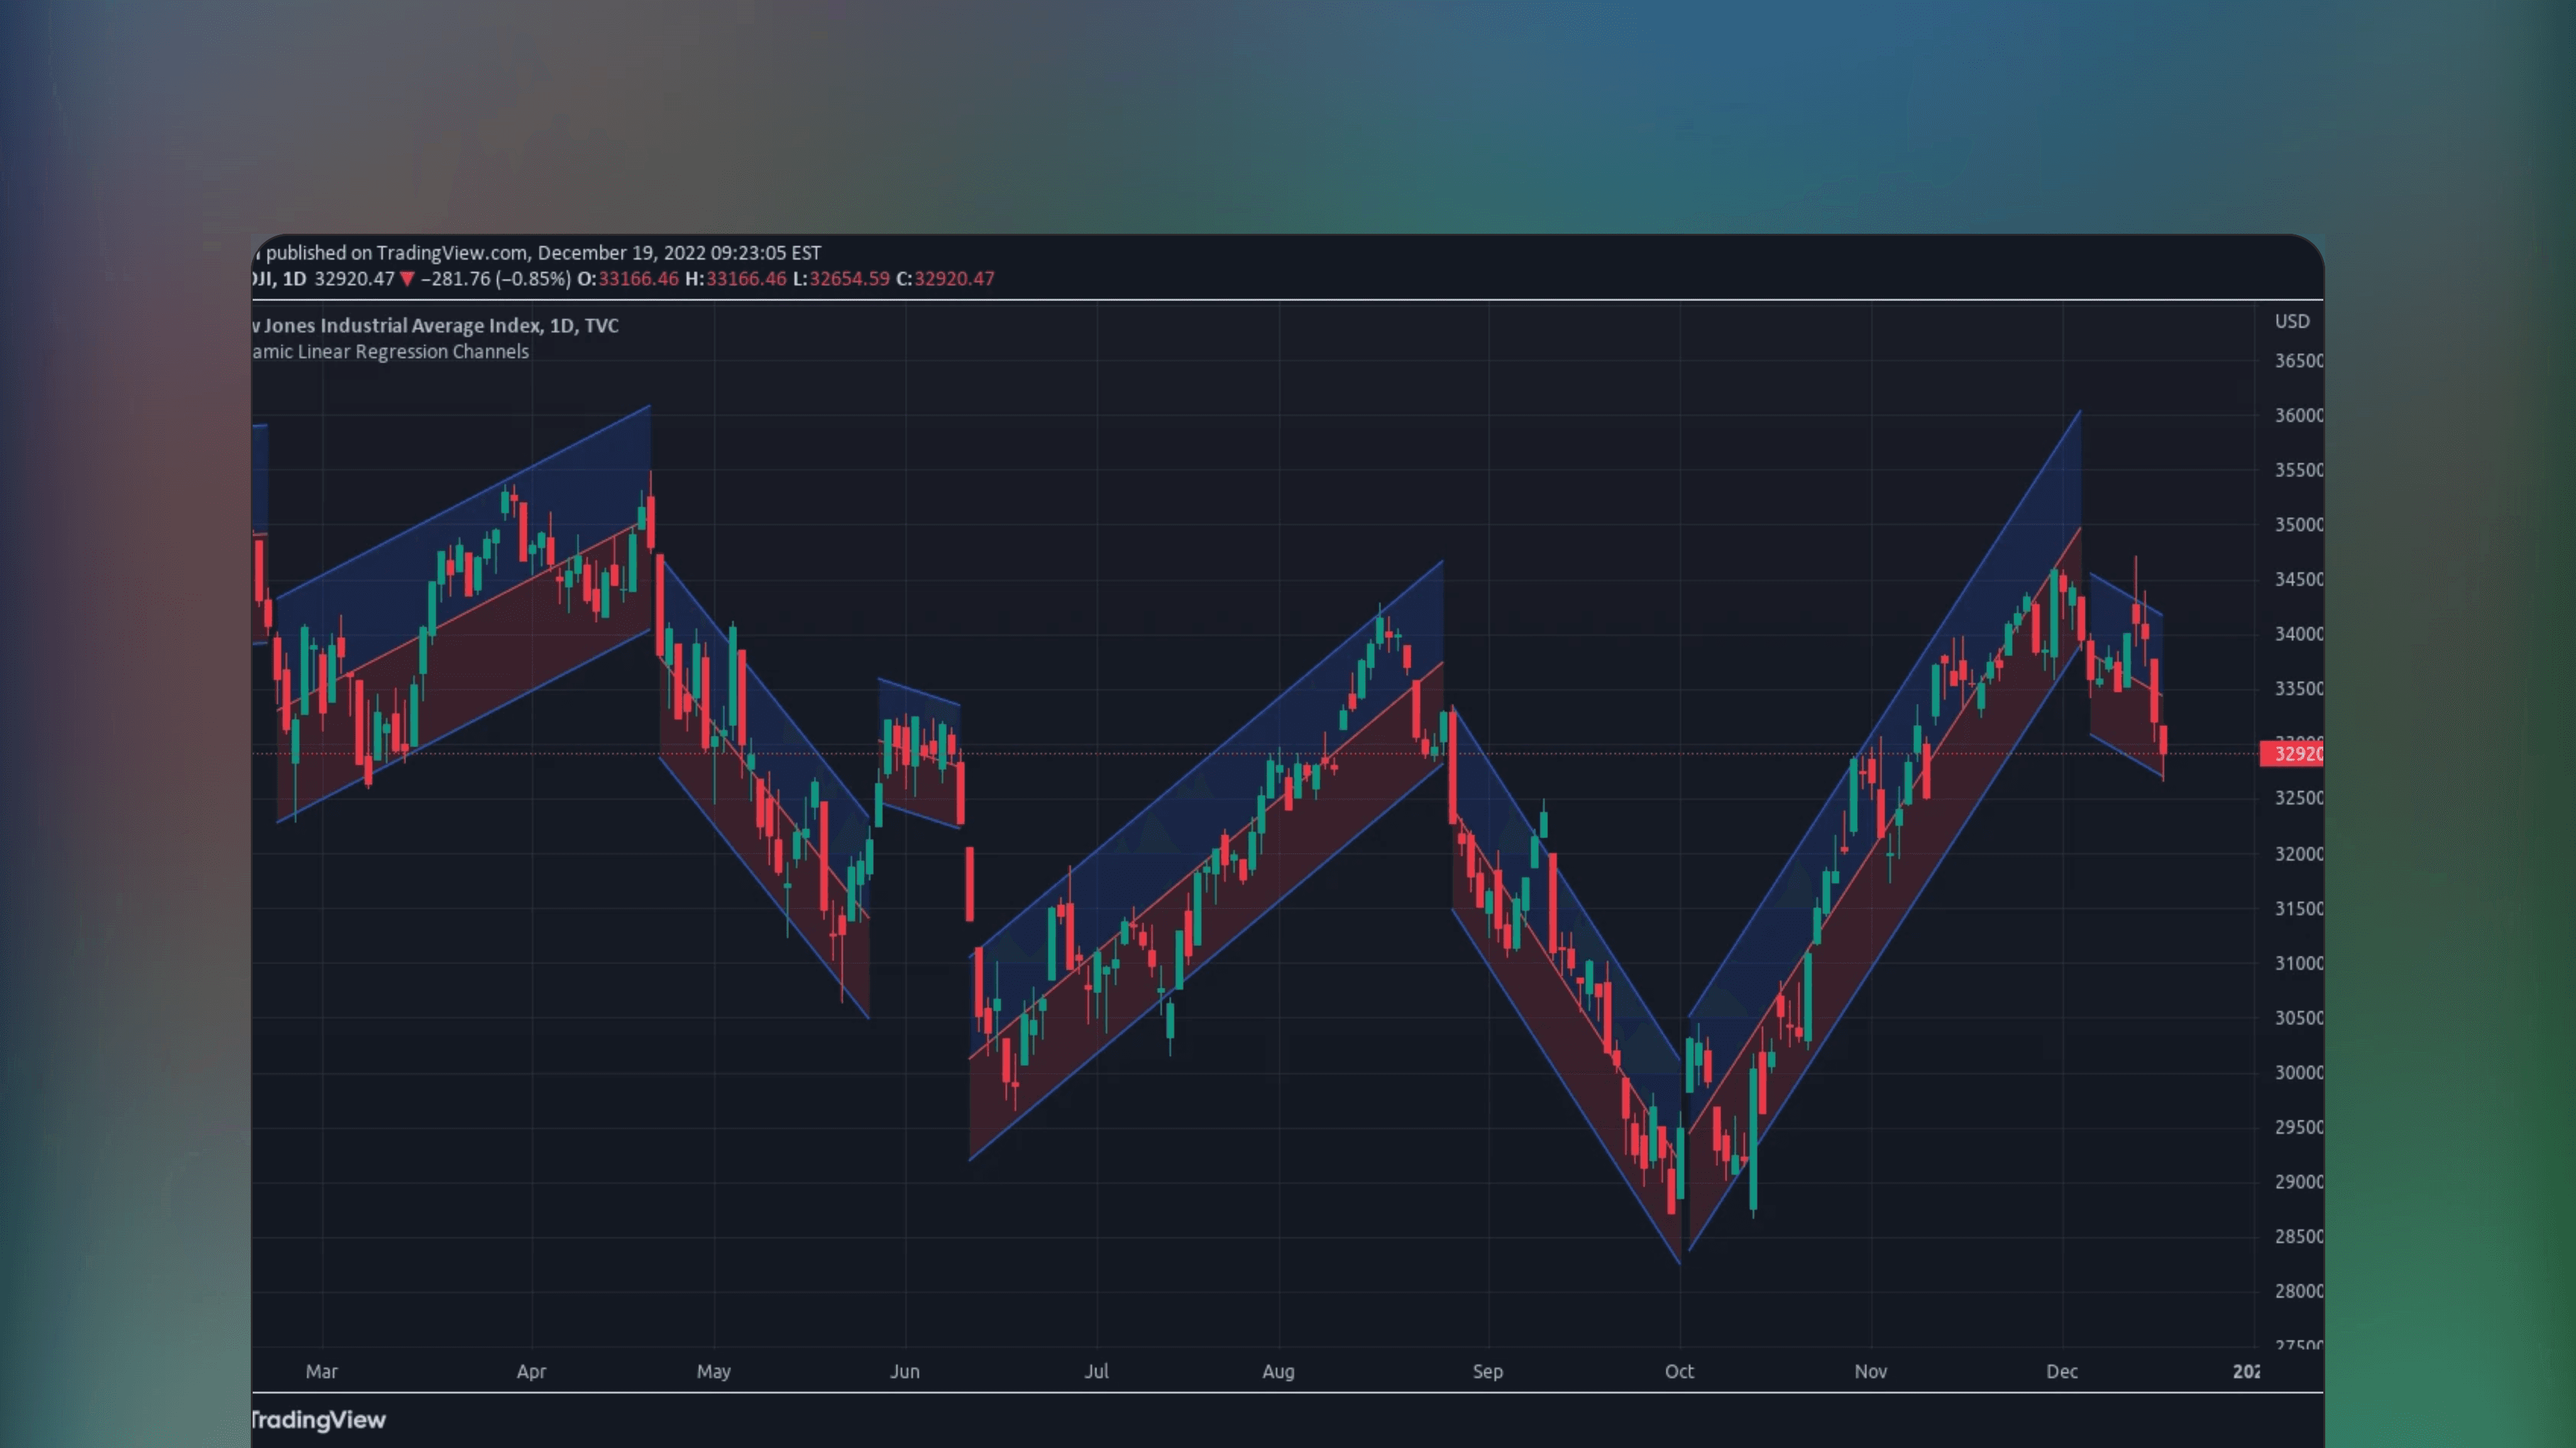
Dynamic Linear Regression Channels
🔑
✅
Dynamic Linear Regression Channels is a TradingView Indicator that calculates linear regression channels based on real-time price movements, generating new support/resistance channels when previous ones are broken.
🤖
by iravan

Free
TradingView Indicator
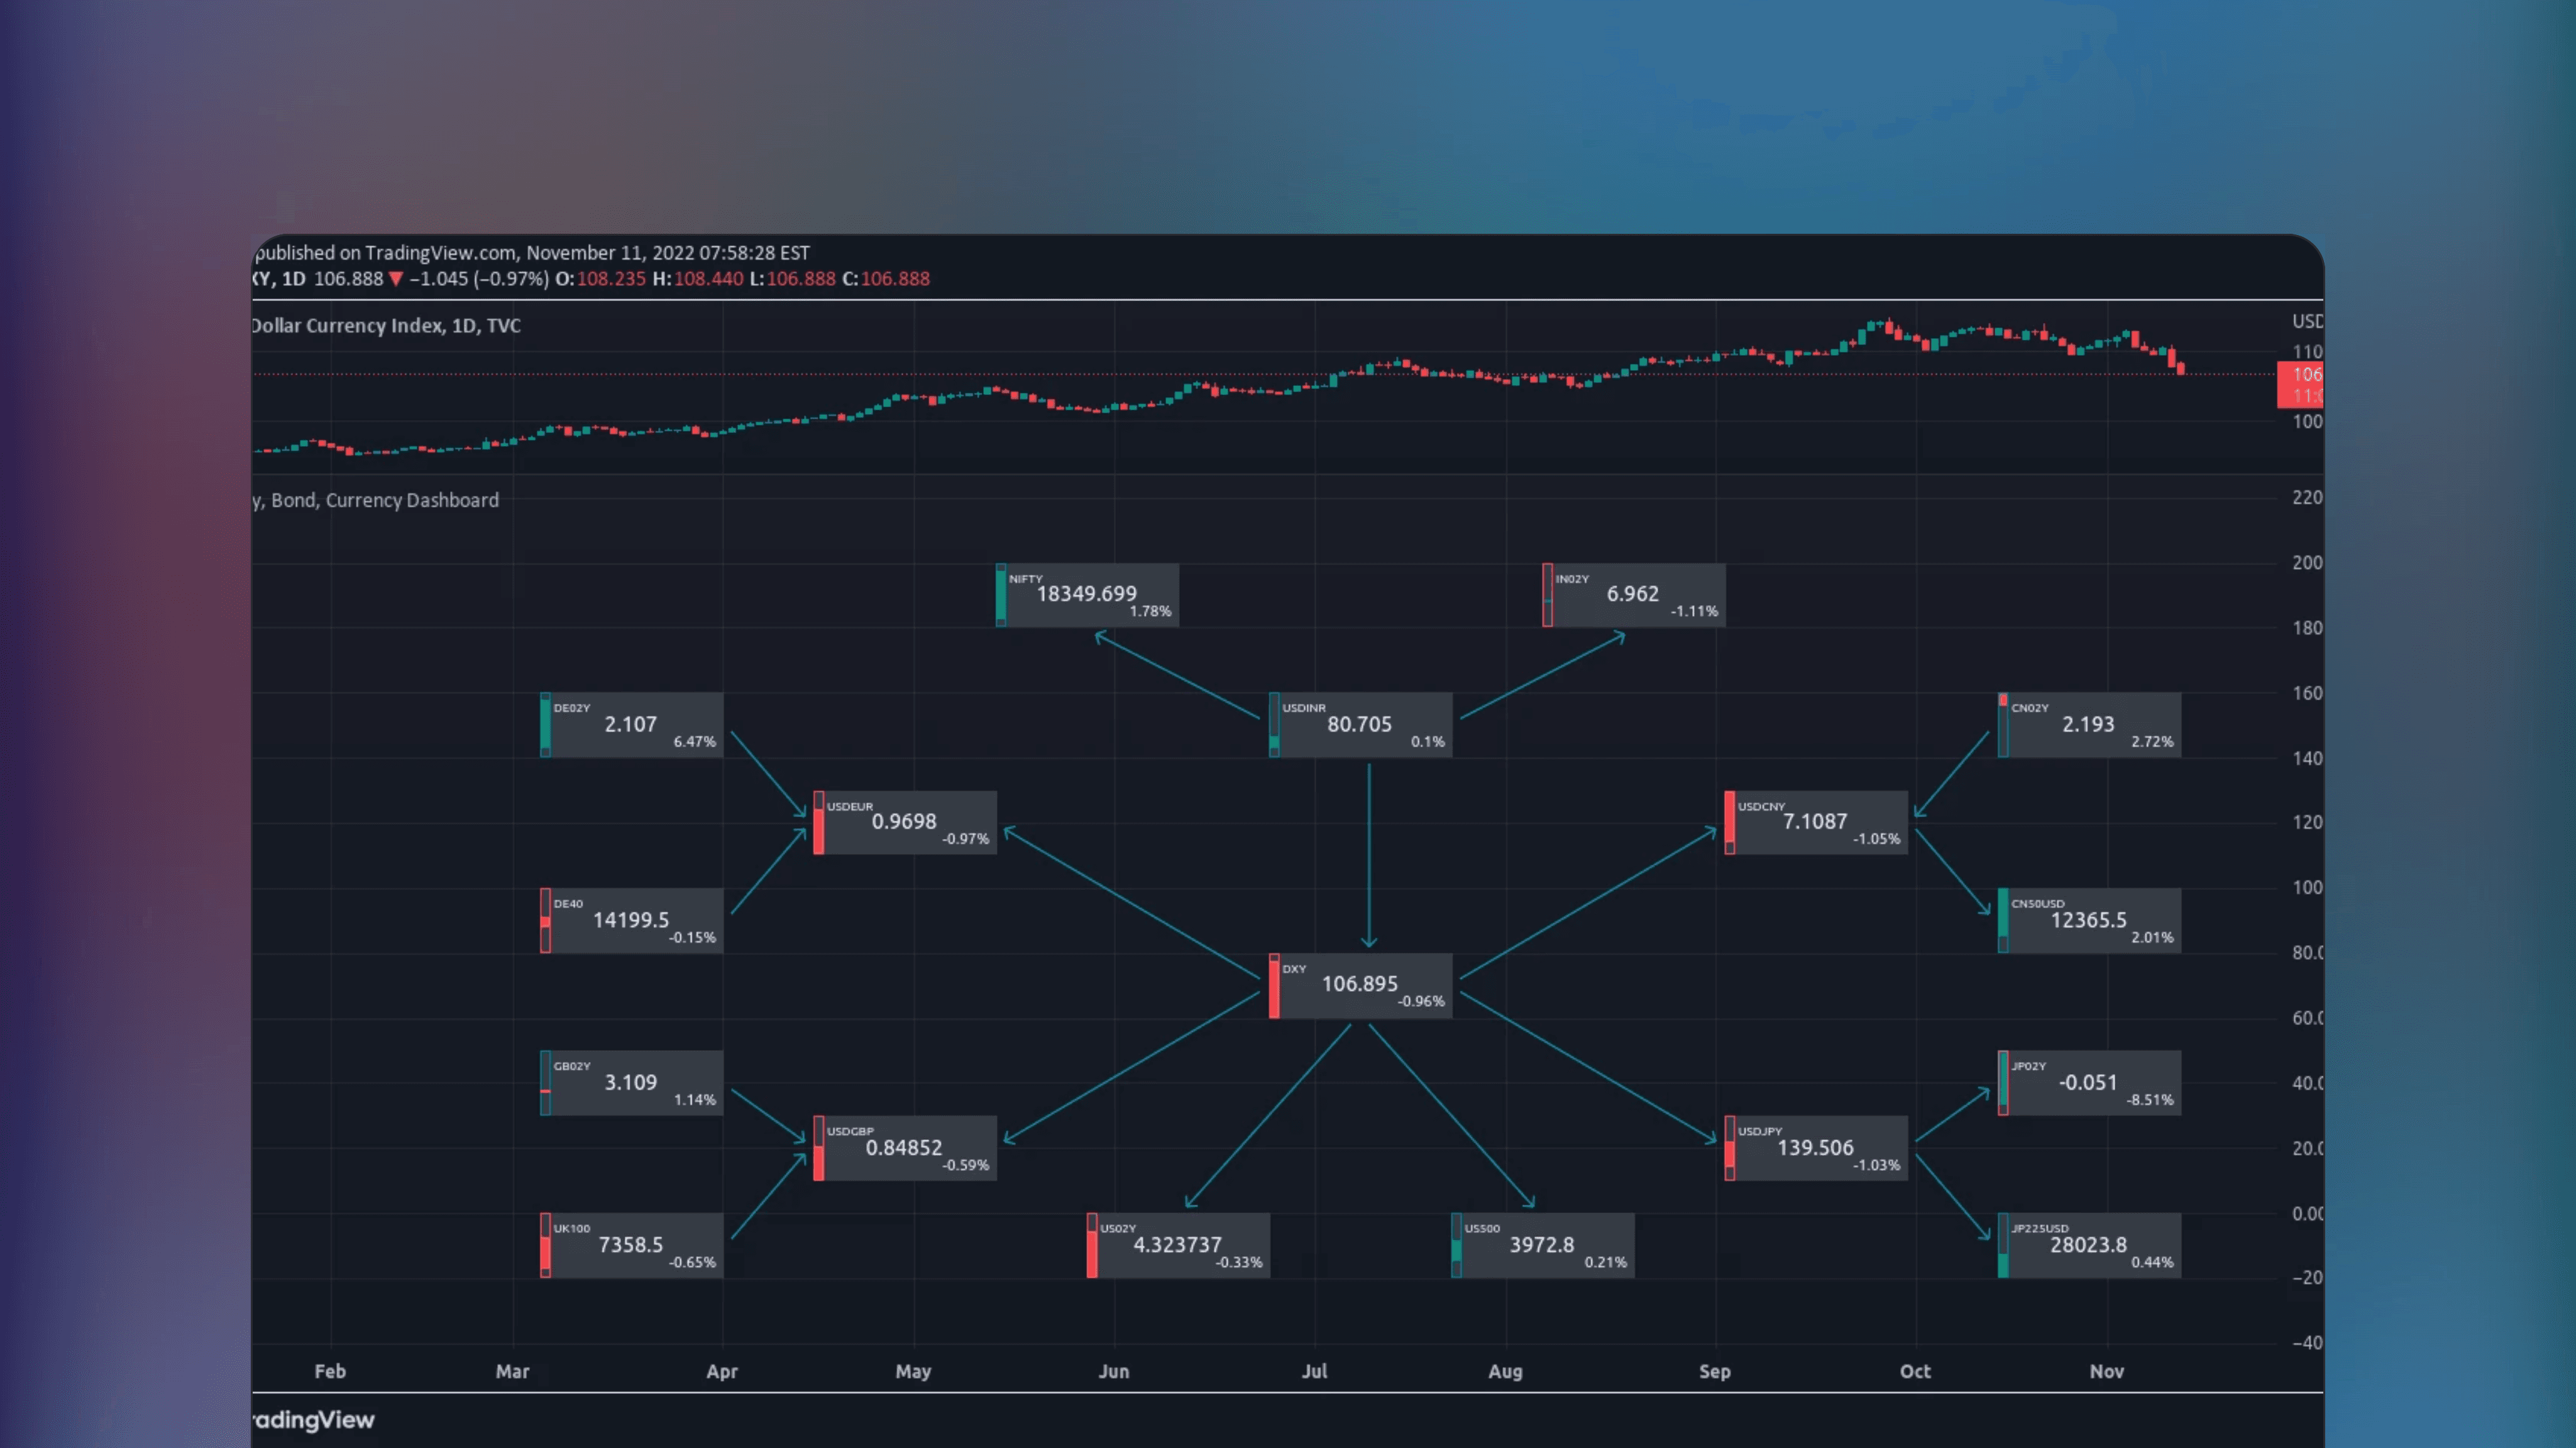
Equity Bond Currency Dashboard
🔑
🌐
✅
Equity Bond Currency Dashboard is a TradingView Indicator that visualizes demand-flow between equities, bonds and currencies across six countries, allowing track of institutional money flows and visuals for interconnected market dynamics.
🤖
by iravan
Free
TradingView Indicator
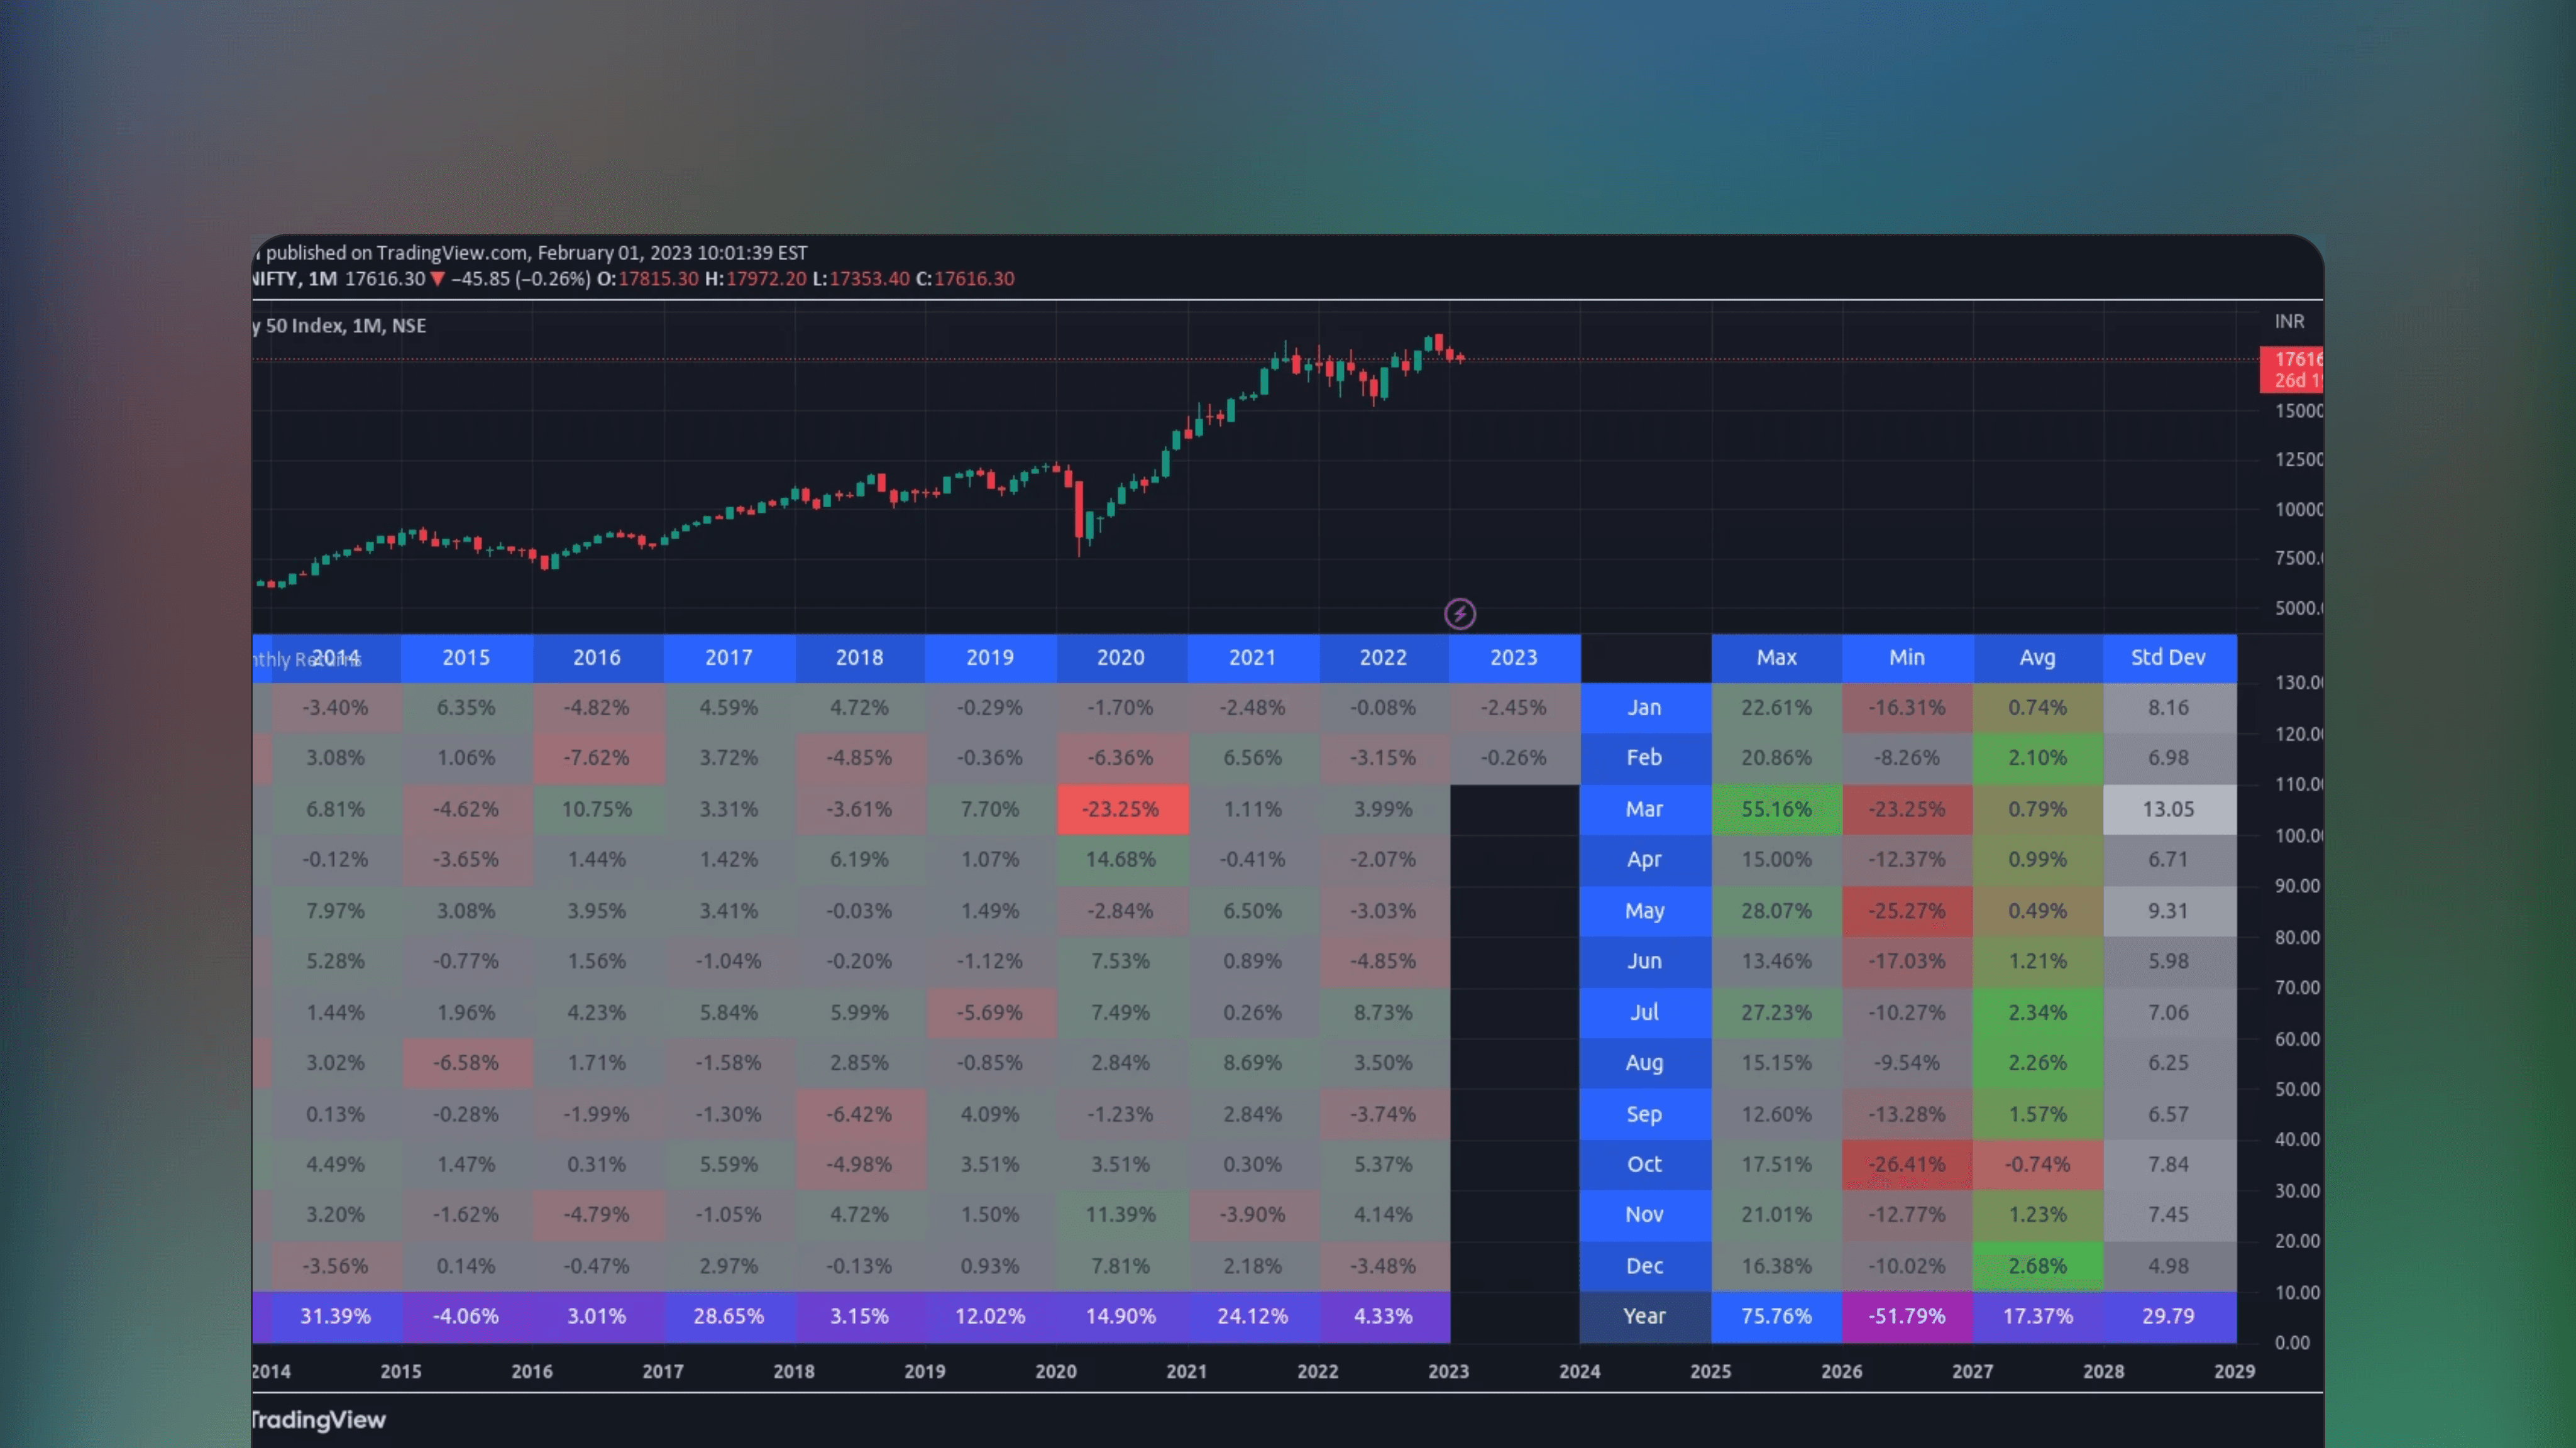
Monthly Returns
🔑
🌐
✅
🏅
Monthly Returns is a free TradingView indicator that displays monthly and yearly investment returns in a table, including maximum, minimum and average returns as well as standard deviations, providing a statistical summary of performance.
Load More
🤖
by iravan
Free
TradingView Indicator
Dynamic Linear Regression Channels
🔑
✅
Dynamic Linear Regression Channels is a TradingView Indicator that calculates linear regression channels based on real-time price movements, generating new support/resistance channels when previous ones are broken.
🤖
by iravan
Free
TradingView Indicator
Equity Bond Currency Dashboard
🔑
🌐
✅
Equity Bond Currency Dashboard is a TradingView Indicator that visualizes demand-flow between equities, bonds and currencies across six countries, allowing track of institutional money flows and visuals for interconnected market dynamics.
Load More
🔥
New Listings
Featured this week

🤖
by allanster
Free
TradingView Indicator
Growing or Waning Patterns [Alerts]
New
🔑
🌐
Growing or Waning Patterns [Alerts] is a TradingView indicator that detects reversal signals based on three candle body patterns. The patterns are classified as increasing or decreasing depending on bullish and bearish states. Additional features include alerts and trend filter.

📟
Free*
Trade Analytics Platform
TRDR.IO
New
🌐
✅
🏅
TRDR.IO is a crypto orderflow platform providing various tools visualizing crypto exchange order book activity. See bid-ask imbalances, buy and sell demand as well as order book depth in real-time with intuitive visual overlays. Additional features include alerts and scanning crypto markets for orderflow events.

🤖
by LeviathanCapital
Free
TradingView Indicator
Swing Levels and Liquidity - By Leviathan
New
🔑
🌐
✅
Swing Levels and Liquidity is a TradingView Indicator that displays swing high and low levels with volume traded at the pivots. Once formed, these levels likely retain liquidity that traders can expect to produce support and resistance in price when swept.
🤖
by allanster
Free
TradingView Indicator
Growing or Waning Patterns [Alerts]
New
🔑
🌐
Growing or Waning Patterns [Alerts] is a TradingView indicator that detects reversal signals based on three candle body patterns. The patterns are classified as increasing or decreasing depending on bullish and bearish states. Additional features include alerts and trend filter.
📟
Free*
Trade Analytics Platform
TRDR.IO
New
🌐
✅
🏅
TRDR.IO is a crypto orderflow platform providing various tools visualizing crypto exchange order book activity. See bid-ask imbalances, buy and sell demand as well as order book depth in real-time with intuitive visual overlays. Additional features include alerts and scanning crypto markets for orderflow events.
Load More
🤖
Similar Listings
Traders also viewed
All


🤖
by jdehorty
Free
TradingView Indicator
Machine Learning: Lorentzian Classification
🔑
✅
🏅
Machine Learning: Lorentzian Classification is an Indicator that uses the Lorentzian Distance Classifier machine learning algorithm to categorize historical price data for predicting future price movements.

🤖
by sbtnc
Free
TradingView Indicator
Tops & Bottoms - Time of Day Report
🔑
🌐
✅
Tops & Bottoms - Time of Day Report is an Indicator that tracks and reports daily market tops and bottoms by time of day, analyzing their timing and frequency for statistical edge based on simple time periods.
🤖
by iravan
Free
TradingView Indicator
Equity Bond Currency Dashboard
🔑
🌐
✅
Equity Bond Currency Dashboard is a TradingView Indicator that visualizes demand-flow between equities, bonds and currencies across six countries, allowing track of institutional money flows and visuals for interconnected market dynamics.

🤖
by KioseffTrading
Free
TradingView Indicator
Fundamentals Graphing [Kioseff Trading]
🔑
✅
🏅
Fundamentals Graphing [Kioseff Trading] is a TradingView indicator that displays essential fundamental metrics for up to 40 stocks. It allows users to compare various key financial metrics like earnings and revenue for easy benchmarking.

🤖
by Zeiierman
Free
TradingView Indicator
Day/Week/Month Metrics (Zeiierman)
🔑
🌐
✅
Day/Week/Month Metrics (Zeiierman) is a TradingView indicator that computes daily, weekly and monthly performance. This indicator displays edge metrics, depicting how often an asset is likely to be bullish or bearish in a given time period.

🤖
by KioseffTrading
Free
TradingView Indicator
Monte Carlo Simulation - Your Strategy [Kioseff Trading]
🔑
🌐
✅
🏅
Monte Carlo Simulation - Your Strategy by Kioseff Trading is a free TradingView indicator that leverages Monte Carlo simulations to analyze the variability and potential outcomes of your inputted trading strategies or the assets displayed on your chart. Calculate your luck factor using this indicator.

🤖
by KioseffTrading
Free
TradingView Indicator
The Next Pivot [Kioseff Trading]
🔑
🌐
🏅
The Next Pivot [Kioseff Trading] is a TradingView indicator that employs similarity measures to compare historical price sequences with current data, formulating potential paths for future price action.

🤖
by KioseffTrading
Free
TradingView Indicator
(Quartile Vol.; Vol. Aggregation; Range US Bars; Gaps) [Kioseff]
🔑
🏅
The (Quartile Vol.; Vol. Aggregation; Range US Bars; Gaps) [Kioseff] Indicator is a TradingView tool that analyzes price action and volume by breaking volume into aggregated quartiles for noise filtered price and volume analysis.
![TradingView chart interface displaying the Seasonality [TFO] statistics indicator panel showing average asset performance across daily, monthly and quarterly timeframes based on a 252-day trading calendar.](https://framerusercontent.com/images/nvPXFfuC5h7lkcLmxaOhlHbStb8.png?width=4098&height=2304)
🤖
by tradeforopp
Free
TradingView Indicator
Seasonality [TFO]
🔑
🌐
✅
🏅
Seasonality [TFO] is a TradingView indicator that analyzes an asset's average performance across daily, monthly, and quarterly timeframes. It uses a 252-trading day calendar, aggregating daily data into 21-day months and 63-day quarters for gauging seasonal trends.

🤖
by KioseffTrading
Free
TradingView Indicator
Crypto Terminal [Kioseff Trading]
🔑
🌐
🏅
Crypto Terminal [Kioseff Trading] is a TradingView indicator that uses on-chain data to provide real-time cryptocurrency statistics directly on your Tradingview charts.

🤖
by toodegrees
Free
TradingView Indicator
Seasonal Open Interest° by toodegrees
🔑
🌐
✅
🏅
Seasonal Open Interest° by toodegrees is a TradingView Indicator that displays the daily number of outstanding futures contracts for specific commodities and markets, based on Open Interest data released after each trading day.

🤖
by pAulseperformance
Free
TradingView Indicator
Portfolio Backtester Engine
🔑
🌐
✅
🏅
Portfolio Backtester Engine is a TradingView indicator that enables backtesting trading strategies across multiple symbols simultaneously. Adapted from PineCoders’ engine, it retains all key functionalities while offering simultaneous backtesting in one go.

🤖
by KioseffTrading
Free
TradingView Indicator
Portfolio Laboratory [Kioseff Trading]
🔑
✅
Portfolio Laboratory [Kioseff Trading] is a free TradingView Indicator that analyzes historical portfolio performance using weighted percentage changes and provides comparison to popular indices as well as various risk metrics.

🤖
by reees
Free
TradingView Indicator
Harmonic Pattern Detection, Prediction, and Backtesting Tool
🔑
🌐
The Harmonic Pattern Detection, Prediction, and Backtesting Tool is a free TradingView indicator that automatically identifies and predicts harmonic XABCD patterns and allows users to backtest signals generated by them.
![TradingView price chart displaying the Captain Backtest Model [TFO] indicator on the NQ 5m timeframe highlighting the 10:00 to 14:00 EST trading window and statistical breakout setups](https://framerusercontent.com/images/3M4FGdZiXeXPv2u1vJZtccXkOeE.png?width=4098&height=2304)
🤖
by tradeforopp
Free
TradingView Indicator
Captain Backtest Model [TFO]
🔑
Captain Backtest Model [TFO] is a TradingView indicator using a systematic model to capture market breakouts during the 10:00-14:00 EST with three simple steps constituting a "trading setup". This systematic rule is backtested over historical data, allowing data-driven insights on model performance.

🤖
by MUQWISHI
Free
TradingView Indicator
Annual Returns % Comparison [By MUQWISHI]
🔑
🌐
✅
🏅
Annual Returns % Comparison [By MUQWISHI] is a free TradingView indicator that benchmarks the historical annual percentage change between two symbols using a simple to understand column visualization.

🤖
by SegaRKO
Free
TradingView Indicator
Black-Scholes Options Pricing Model
🔑
🌐
✅
The Black-Scholes Options Pricing Model is a TradingView indicator that applies the Black-Scholes formula to determine the theoretical value of options. Features all important greeks, such as Delta, Gamma, Theta, Vanna and more.

🤖
by toodegrees
Free
TradingView Indicator
ICT Commitment of Traders° by toodegrees
🔑
🌐
✅
The ICT Commitment of Traders° by toodegrees is a TradingView indicator that analyzes weekly CFTC Commitment of Traders reports, displaying the long and short positions of three key market participants: commercial traders, large traders and small speculators.

🤖
by toodegrees
Free
TradingView Indicator
Interest Rate and GDP Dashboard by toodegrees
🔑
🌐
✅
🏅
Interest Rate and GDP Dashboard by toodegrees is a TradingView Indicator that aggregates interest rates and GDP data from major Central Banks into one view for timely nsights into key economic metrics.
![TradingView price chart displaying the AR Forecast Scatterplot [SS] indicator visualizing autoregressive forecasts as a scatterplot of potential price outcomes and statistical ranges](https://framerusercontent.com/images/h2fN8rx6z7CcyNxtZqArYu9O5M.png?width=4098&height=2304)
🤖
by Steversteves
Free
TradingView Indicator
AR Forecast Scatterplot [SS]
🔑
✅
AR Forecast Scatterplot [SS] is a free TradingView Indicator that calculates and visualizes forecasted trends using statistical methods based on historical price data.

🤖
by ChartPrime
Free
TradingView Indicator
Risk Reward Optimiser [ChartPrime]
🔑
🌐
🏅
Risk Reward Optimiser [ChartPrime] is a TradingView Indicator that automates the optimization of risk-reward ratios using a variety of different benchmarks.

🤖
by MUQWISHI
Free
TradingView Indicator
Treasury Yields Heatmap [By MUQWISHI]
🔑
🌐
✅
Treasury Yields Heatmap by MUQWISHI is a TradingView indicator that displays treasury yield rates over time and indicates the yield curve status - normal, flat, or inverted. Users can customize starting period, timeframe and reference country for bond data.

🤖
by roamin129
Free
TradingView Indicator
AMDX Time Zone
🔑
AMDX Time Zone is a TradingView indicator based on Accumulation and Manipulation theory, highlighting extreme price levels within specific time zones and trading sessions, also known as kill zones.

🤖
by BarefootJoey
Free
TradingView Indicator
Astro: Planetary Aspect Table
🔑
Astro: Planetary Aspect Table is a free TradingView indicator that maps planetary angles between, showing their positions in an easy to read dashboard. An experimental indicator displaying potential celestial influences on Earth events and financial markets.

🤖
by MUQWISHI
Free
TradingView Indicator
Financial Data Spreadsheet [By MUQWISHI]
🔑
🌐
✅
🏅
Financial Data Spreadsheet by MUQWISHI is a TradingView indicator displaying spreadsheet-like tables of key financial metrics from income statements to cash flow statements, based on most recent reporting period.
🤖
by iravan
Free
TradingView Indicator
Monthly Returns
🔑
🌐
✅
🏅
Monthly Returns is a free TradingView indicator that displays monthly and yearly investment returns in a table, including maximum, minimum and average returns as well as standard deviations, providing a statistical summary of performance.

🤖
by ILuvMarkets
Free
TradingView Indicator
NSE Sector Performance
🔑
🌐
NSE Sector Performance displays various stock market sector performance metrics from daily, weekly, quarterly and annual timeframes. Indicator includes additional metrics such as 250 day high/low and distance of current price from these points. Supports user selected custom sectors.

🤖
by Zeiierman
Free
TradingView Indicator
Dividend Calendar (Zeiierman)
🔑
🌐
✅
🏅
Dividend Calendar (Zeiierman) is a TradingView indicator that provides a schedule of expected dividend payouts from public companies.

🤖
by loxx
Free
TradingView Indicator
Black Scholes Option Pricing Model w/ Greeks [Loxx]
🔑
🌐
✅
🏅
Black Scholes Option Pricing Model w/ Greeks [Loxx] is a TradingView indicator that uses the Black Scholes Merton model to automatically calculate option Greeks, displayed in a user-friendly dashboard format.

🤖
by QuantNomad
Free
TradingView Indicator
Portfolio Performance
🔑
🌐
✅
Portfolio Performance is a free TradingView Indicator that computes your portfolio’s performance using various performance metrics and returns over different periods of time.
🤖
by jdehorty
Free
TradingView Indicator
Machine Learning: Lorentzian Classification
🔑
✅
🏅
Machine Learning: Lorentzian Classification is an Indicator that uses the Lorentzian Distance Classifier machine learning algorithm to categorize historical price data for predicting future price movements.
🤖
by sbtnc
Free
TradingView Indicator
Tops & Bottoms - Time of Day Report
🔑
🌐
✅
Tops & Bottoms - Time of Day Report is an Indicator that tracks and reports daily market tops and bottoms by time of day, analyzing their timing and frequency for statistical edge based on simple time periods.
🤖
by iravan
Free
TradingView Indicator
Equity Bond Currency Dashboard
🔑
🌐
✅
Equity Bond Currency Dashboard is a TradingView Indicator that visualizes demand-flow between equities, bonds and currencies across six countries, allowing track of institutional money flows and visuals for interconnected market dynamics.
🤖
by KioseffTrading
Free
TradingView Indicator
Fundamentals Graphing [Kioseff Trading]
🔑
✅
🏅
Fundamentals Graphing [Kioseff Trading] is a TradingView indicator that displays essential fundamental metrics for up to 40 stocks. It allows users to compare various key financial metrics like earnings and revenue for easy benchmarking.
🤖
by Zeiierman
Free
TradingView Indicator
Day/Week/Month Metrics (Zeiierman)
🔑
🌐
✅
Day/Week/Month Metrics (Zeiierman) is a TradingView indicator that computes daily, weekly and monthly performance. This indicator displays edge metrics, depicting how often an asset is likely to be bullish or bearish in a given time period.
🤖
by KioseffTrading
Free
TradingView Indicator
Monte Carlo Simulation - Your Strategy [Kioseff Trading]
🔑
🌐
✅
🏅
Monte Carlo Simulation - Your Strategy by Kioseff Trading is a free TradingView indicator that leverages Monte Carlo simulations to analyze the variability and potential outcomes of your inputted trading strategies or the assets displayed on your chart. Calculate your luck factor using this indicator.
🤖
by KioseffTrading
Free
TradingView Indicator
The Next Pivot [Kioseff Trading]
🔑
🌐
🏅
The Next Pivot [Kioseff Trading] is a TradingView indicator that employs similarity measures to compare historical price sequences with current data, formulating potential paths for future price action.
🤖
by KioseffTrading
Free
TradingView Indicator
(Quartile Vol.; Vol. Aggregation; Range US Bars; Gaps) [Kioseff]
🔑
🏅
The (Quartile Vol.; Vol. Aggregation; Range US Bars; Gaps) [Kioseff] Indicator is a TradingView tool that analyzes price action and volume by breaking volume into aggregated quartiles for noise filtered price and volume analysis.
🤖
by tradeforopp
Free
TradingView Indicator
Seasonality [TFO]
🔑
🌐
✅
🏅
Seasonality [TFO] is a TradingView indicator that analyzes an asset's average performance across daily, monthly, and quarterly timeframes. It uses a 252-trading day calendar, aggregating daily data into 21-day months and 63-day quarters for gauging seasonal trends.
🤖
by KioseffTrading
Free
TradingView Indicator
Crypto Terminal [Kioseff Trading]
🔑
🌐
🏅
Crypto Terminal [Kioseff Trading] is a TradingView indicator that uses on-chain data to provide real-time cryptocurrency statistics directly on your Tradingview charts.
🤖
by toodegrees
Free
TradingView Indicator
Seasonal Open Interest° by toodegrees
🔑
🌐
✅
🏅
Seasonal Open Interest° by toodegrees is a TradingView Indicator that displays the daily number of outstanding futures contracts for specific commodities and markets, based on Open Interest data released after each trading day.
🤖
by pAulseperformance
Free
TradingView Indicator
Portfolio Backtester Engine
🔑
🌐
✅
🏅
Portfolio Backtester Engine is a TradingView indicator that enables backtesting trading strategies across multiple symbols simultaneously. Adapted from PineCoders’ engine, it retains all key functionalities while offering simultaneous backtesting in one go.
🤖
by KioseffTrading
Free
TradingView Indicator
Portfolio Laboratory [Kioseff Trading]
🔑
✅
Portfolio Laboratory [Kioseff Trading] is a free TradingView Indicator that analyzes historical portfolio performance using weighted percentage changes and provides comparison to popular indices as well as various risk metrics.
🤖
by reees
Free
TradingView Indicator
Harmonic Pattern Detection, Prediction, and Backtesting Tool
🔑
🌐
The Harmonic Pattern Detection, Prediction, and Backtesting Tool is a free TradingView indicator that automatically identifies and predicts harmonic XABCD patterns and allows users to backtest signals generated by them.
🤖
by tradeforopp
Free
TradingView Indicator
Captain Backtest Model [TFO]
🔑
Captain Backtest Model [TFO] is a TradingView indicator using a systematic model to capture market breakouts during the 10:00-14:00 EST with three simple steps constituting a "trading setup". This systematic rule is backtested over historical data, allowing data-driven insights on model performance.
🤖
by MUQWISHI
Free
TradingView Indicator
Annual Returns % Comparison [By MUQWISHI]
🔑
🌐
✅
🏅
Annual Returns % Comparison [By MUQWISHI] is a free TradingView indicator that benchmarks the historical annual percentage change between two symbols using a simple to understand column visualization.
🤖
by SegaRKO
Free
TradingView Indicator
Black-Scholes Options Pricing Model
🔑
🌐
✅
The Black-Scholes Options Pricing Model is a TradingView indicator that applies the Black-Scholes formula to determine the theoretical value of options. Features all important greeks, such as Delta, Gamma, Theta, Vanna and more.
🤖
by toodegrees
Free
TradingView Indicator
ICT Commitment of Traders° by toodegrees
🔑
🌐
✅
The ICT Commitment of Traders° by toodegrees is a TradingView indicator that analyzes weekly CFTC Commitment of Traders reports, displaying the long and short positions of three key market participants: commercial traders, large traders and small speculators.
🤖
by toodegrees
Free
TradingView Indicator
Interest Rate and GDP Dashboard by toodegrees
🔑
🌐
✅
🏅
Interest Rate and GDP Dashboard by toodegrees is a TradingView Indicator that aggregates interest rates and GDP data from major Central Banks into one view for timely nsights into key economic metrics.
🤖
by Steversteves
Free
TradingView Indicator
AR Forecast Scatterplot [SS]
🔑
✅
AR Forecast Scatterplot [SS] is a free TradingView Indicator that calculates and visualizes forecasted trends using statistical methods based on historical price data.
🤖
by jdehorty
Free
TradingView Indicator
Machine Learning: Lorentzian Classification
🔑
✅
🏅
Machine Learning: Lorentzian Classification is an Indicator that uses the Lorentzian Distance Classifier machine learning algorithm to categorize historical price data for predicting future price movements.
🤖
by sbtnc
Free
TradingView Indicator
Tops & Bottoms - Time of Day Report
🔑
🌐
✅
Tops & Bottoms - Time of Day Report is an Indicator that tracks and reports daily market tops and bottoms by time of day, analyzing their timing and frequency for statistical edge based on simple time periods.
🤖
by iravan
Free
TradingView Indicator
Equity Bond Currency Dashboard
🔑
🌐
✅
Equity Bond Currency Dashboard is a TradingView Indicator that visualizes demand-flow between equities, bonds and currencies across six countries, allowing track of institutional money flows and visuals for interconnected market dynamics.
🤖
by KioseffTrading
Free
TradingView Indicator
Fundamentals Graphing [Kioseff Trading]
🔑
✅
🏅
Fundamentals Graphing [Kioseff Trading] is a TradingView indicator that displays essential fundamental metrics for up to 40 stocks. It allows users to compare various key financial metrics like earnings and revenue for easy benchmarking.
🤖
by Zeiierman
Free
TradingView Indicator
Day/Week/Month Metrics (Zeiierman)
🔑
🌐
✅
Day/Week/Month Metrics (Zeiierman) is a TradingView indicator that computes daily, weekly and monthly performance. This indicator displays edge metrics, depicting how often an asset is likely to be bullish or bearish in a given time period.
🤖
by KioseffTrading
Free
TradingView Indicator
Monte Carlo Simulation - Your Strategy [Kioseff Trading]
🔑
🌐
✅
🏅
Monte Carlo Simulation - Your Strategy by Kioseff Trading is a free TradingView indicator that leverages Monte Carlo simulations to analyze the variability and potential outcomes of your inputted trading strategies or the assets displayed on your chart. Calculate your luck factor using this indicator.
🤖
by KioseffTrading
Free
TradingView Indicator
The Next Pivot [Kioseff Trading]
🔑
🌐
🏅
The Next Pivot [Kioseff Trading] is a TradingView indicator that employs similarity measures to compare historical price sequences with current data, formulating potential paths for future price action.
🤖
by KioseffTrading
Free
TradingView Indicator
(Quartile Vol.; Vol. Aggregation; Range US Bars; Gaps) [Kioseff]
🔑
🏅
The (Quartile Vol.; Vol. Aggregation; Range US Bars; Gaps) [Kioseff] Indicator is a TradingView tool that analyzes price action and volume by breaking volume into aggregated quartiles for noise filtered price and volume analysis.
🤖
by tradeforopp
Free
TradingView Indicator
Seasonality [TFO]
🔑
🌐
✅
🏅
Seasonality [TFO] is a TradingView indicator that analyzes an asset's average performance across daily, monthly, and quarterly timeframes. It uses a 252-trading day calendar, aggregating daily data into 21-day months and 63-day quarters for gauging seasonal trends.
🤖
by KioseffTrading
Free
TradingView Indicator
Crypto Terminal [Kioseff Trading]
🔑
🌐
🏅
Crypto Terminal [Kioseff Trading] is a TradingView indicator that uses on-chain data to provide real-time cryptocurrency statistics directly on your Tradingview charts.
Discover trading edge
Discover trading edge
Indicators, Platforms & Education
Indicators, Platforms & Education
TradersList
Discover trading edge
Join Telegram
Weekly listings
Join Telegram
Disclaimer
Our goal is to achieve greater transparency, guidance and safety in trading and investing by providing means to discover, research and discuss trading/investing related sites/services.
Content provided on this site is not financial advice, meant for educational purposes only. TradersList does not endorse or guarantee any result for listed sites/services. Do your own research.
Read full disclaimer
TradersList
Discover trading edge
Join Telegram
Disclaimer
Our goal is to achieve greater transparency, guidance and safety in trading and investing by providing means to discover, research and discuss trading/investing related sites/services.
Content provided on this site is not financial advice, meant for educational purposes only. TradersList does not endorse or guarantee any result for listed sites/services. Do your own research.
Read full disclaimer