

From TradersList Editors
From TradersList Editors
Enhance your trading accuracy with dynamic regression channels for trend detection, support and resistance, and mean reversion.
Enhance your trading accuracy with dynamic regression channels for trend detection, support and resistance, and mean reversion.


TradingView Indicator
TradingView Indicator
Dynamic Linear Regression Channels Indicator for TradingView: Auto-Updating Trend Detection Tool
Dynamic Linear Regression Channels Indicator for TradingView: Auto-Updating Trend Detection Tool
by iravan on TradingView
by iravan on TradingView
🤖
🤖
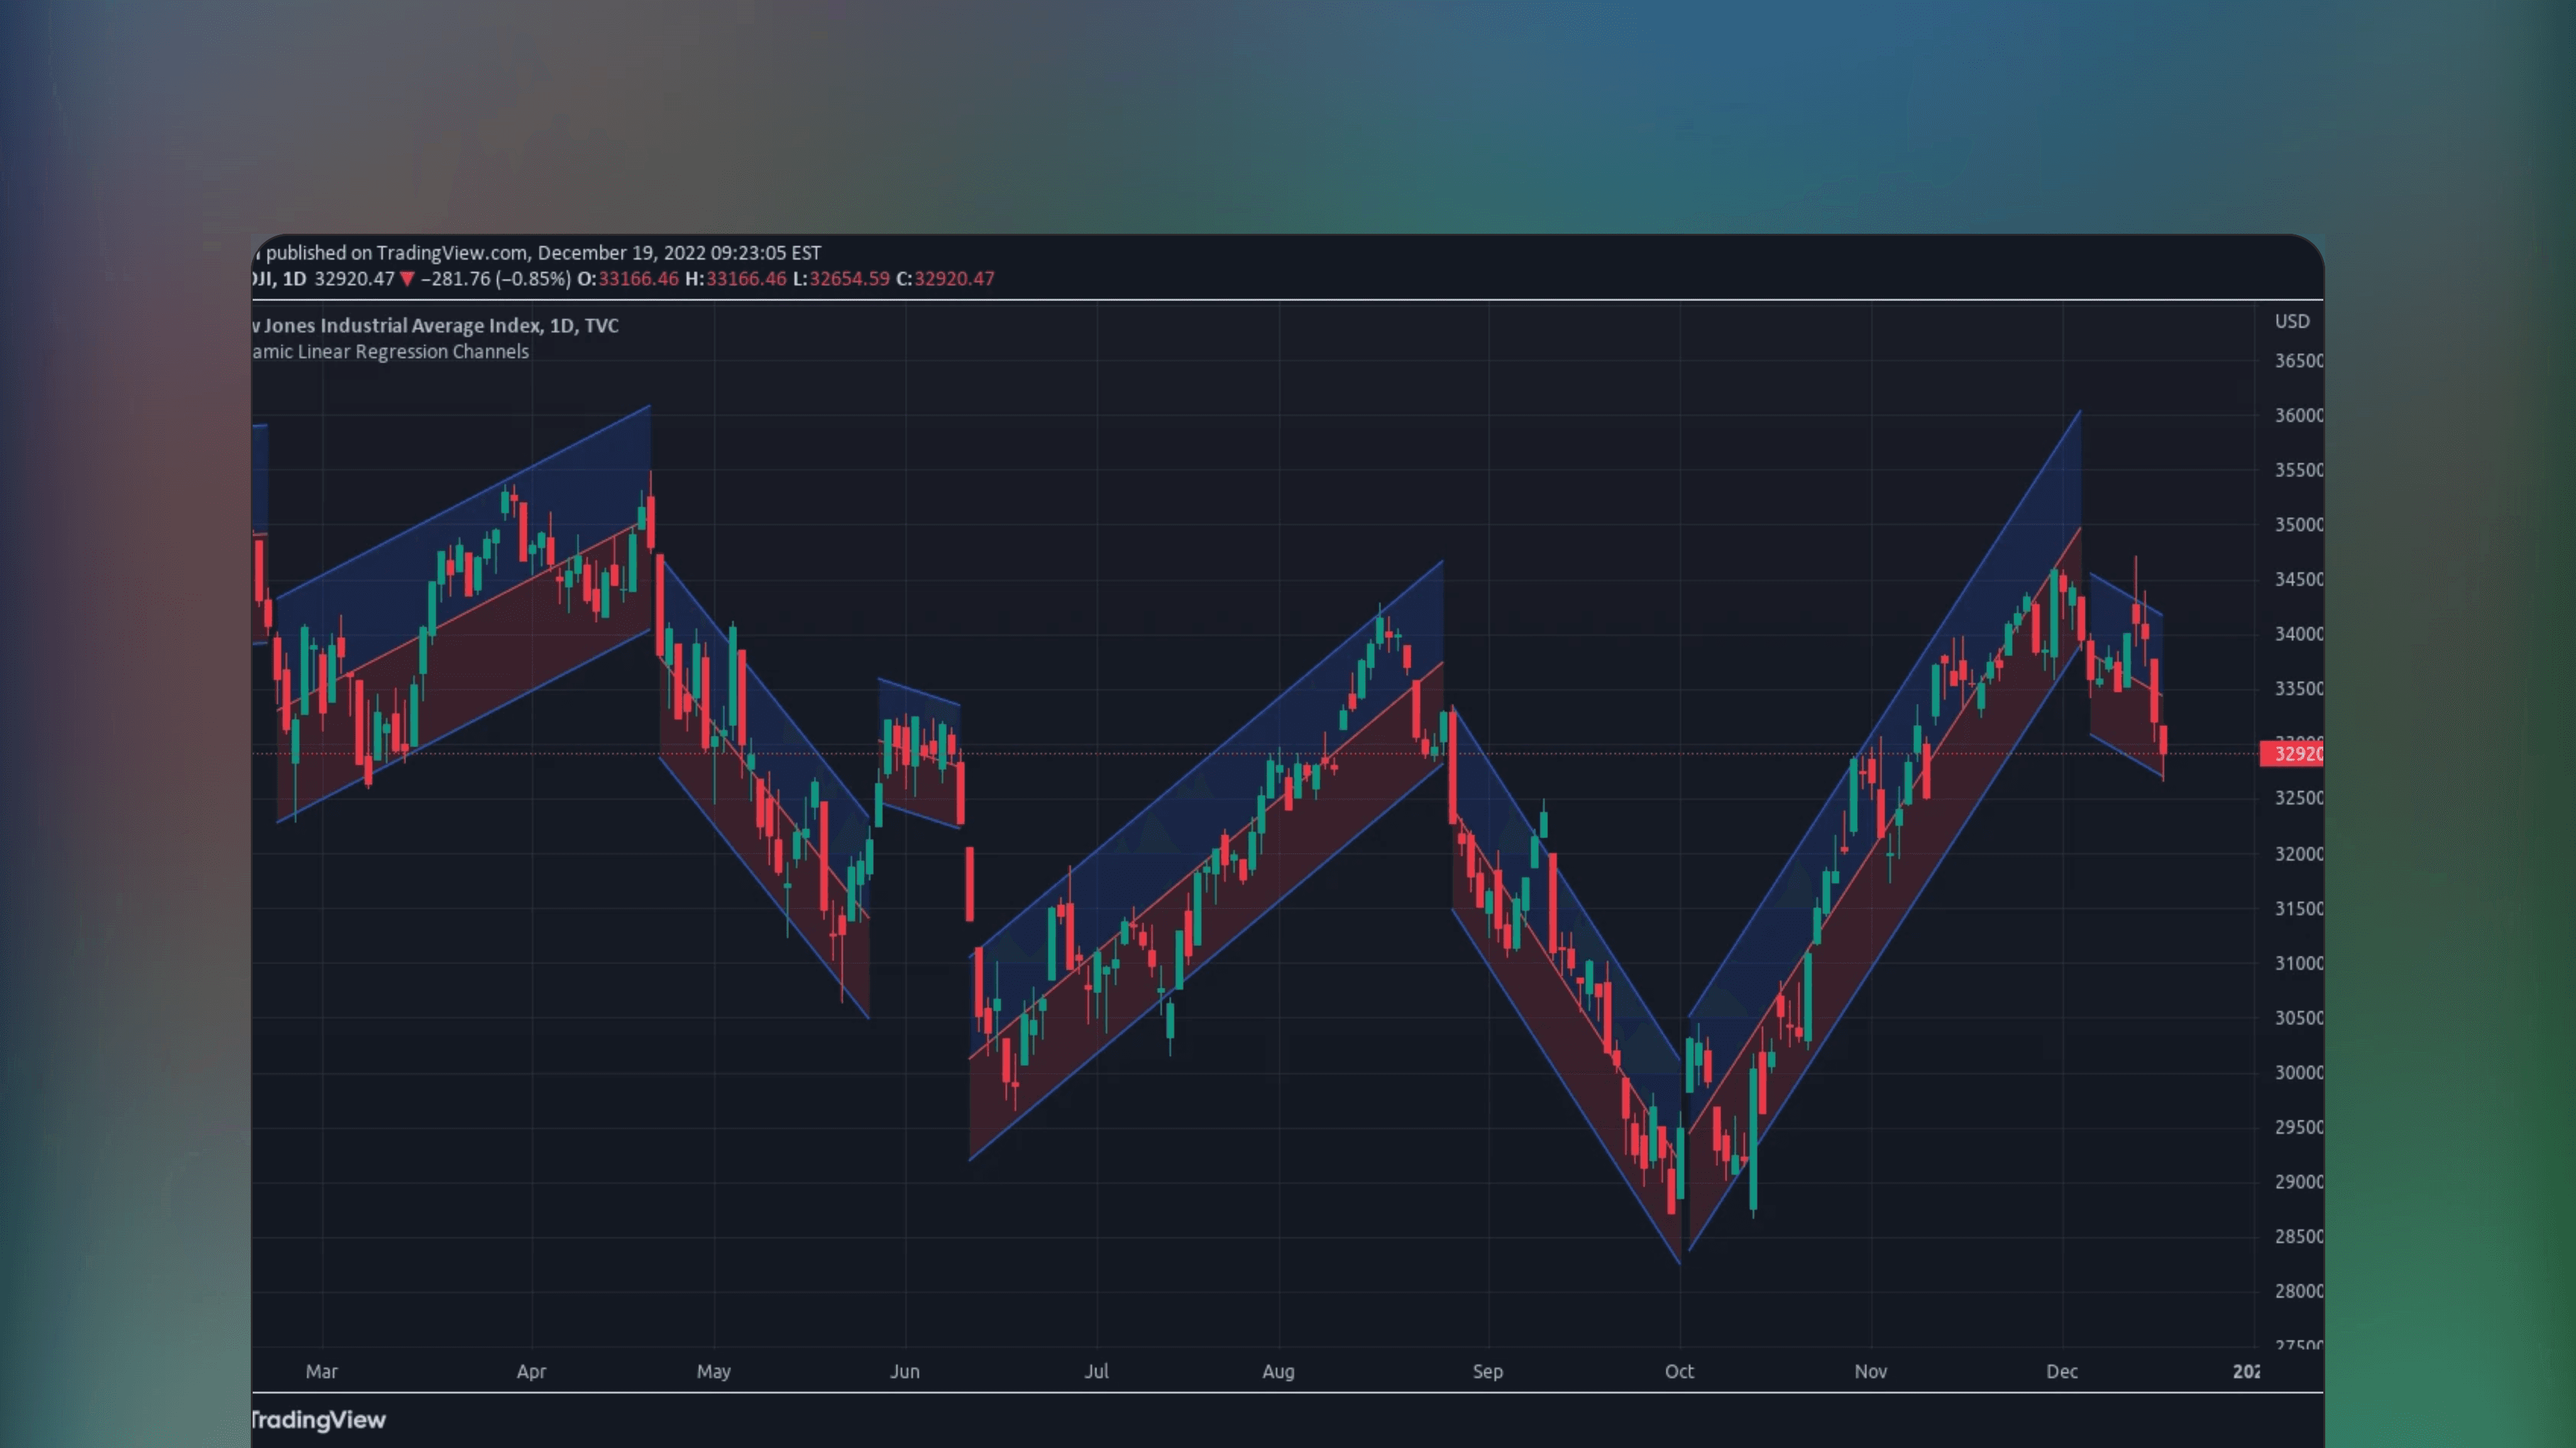
Dynamic Linear Regression Channels
Dynamic Linear Regression Channels
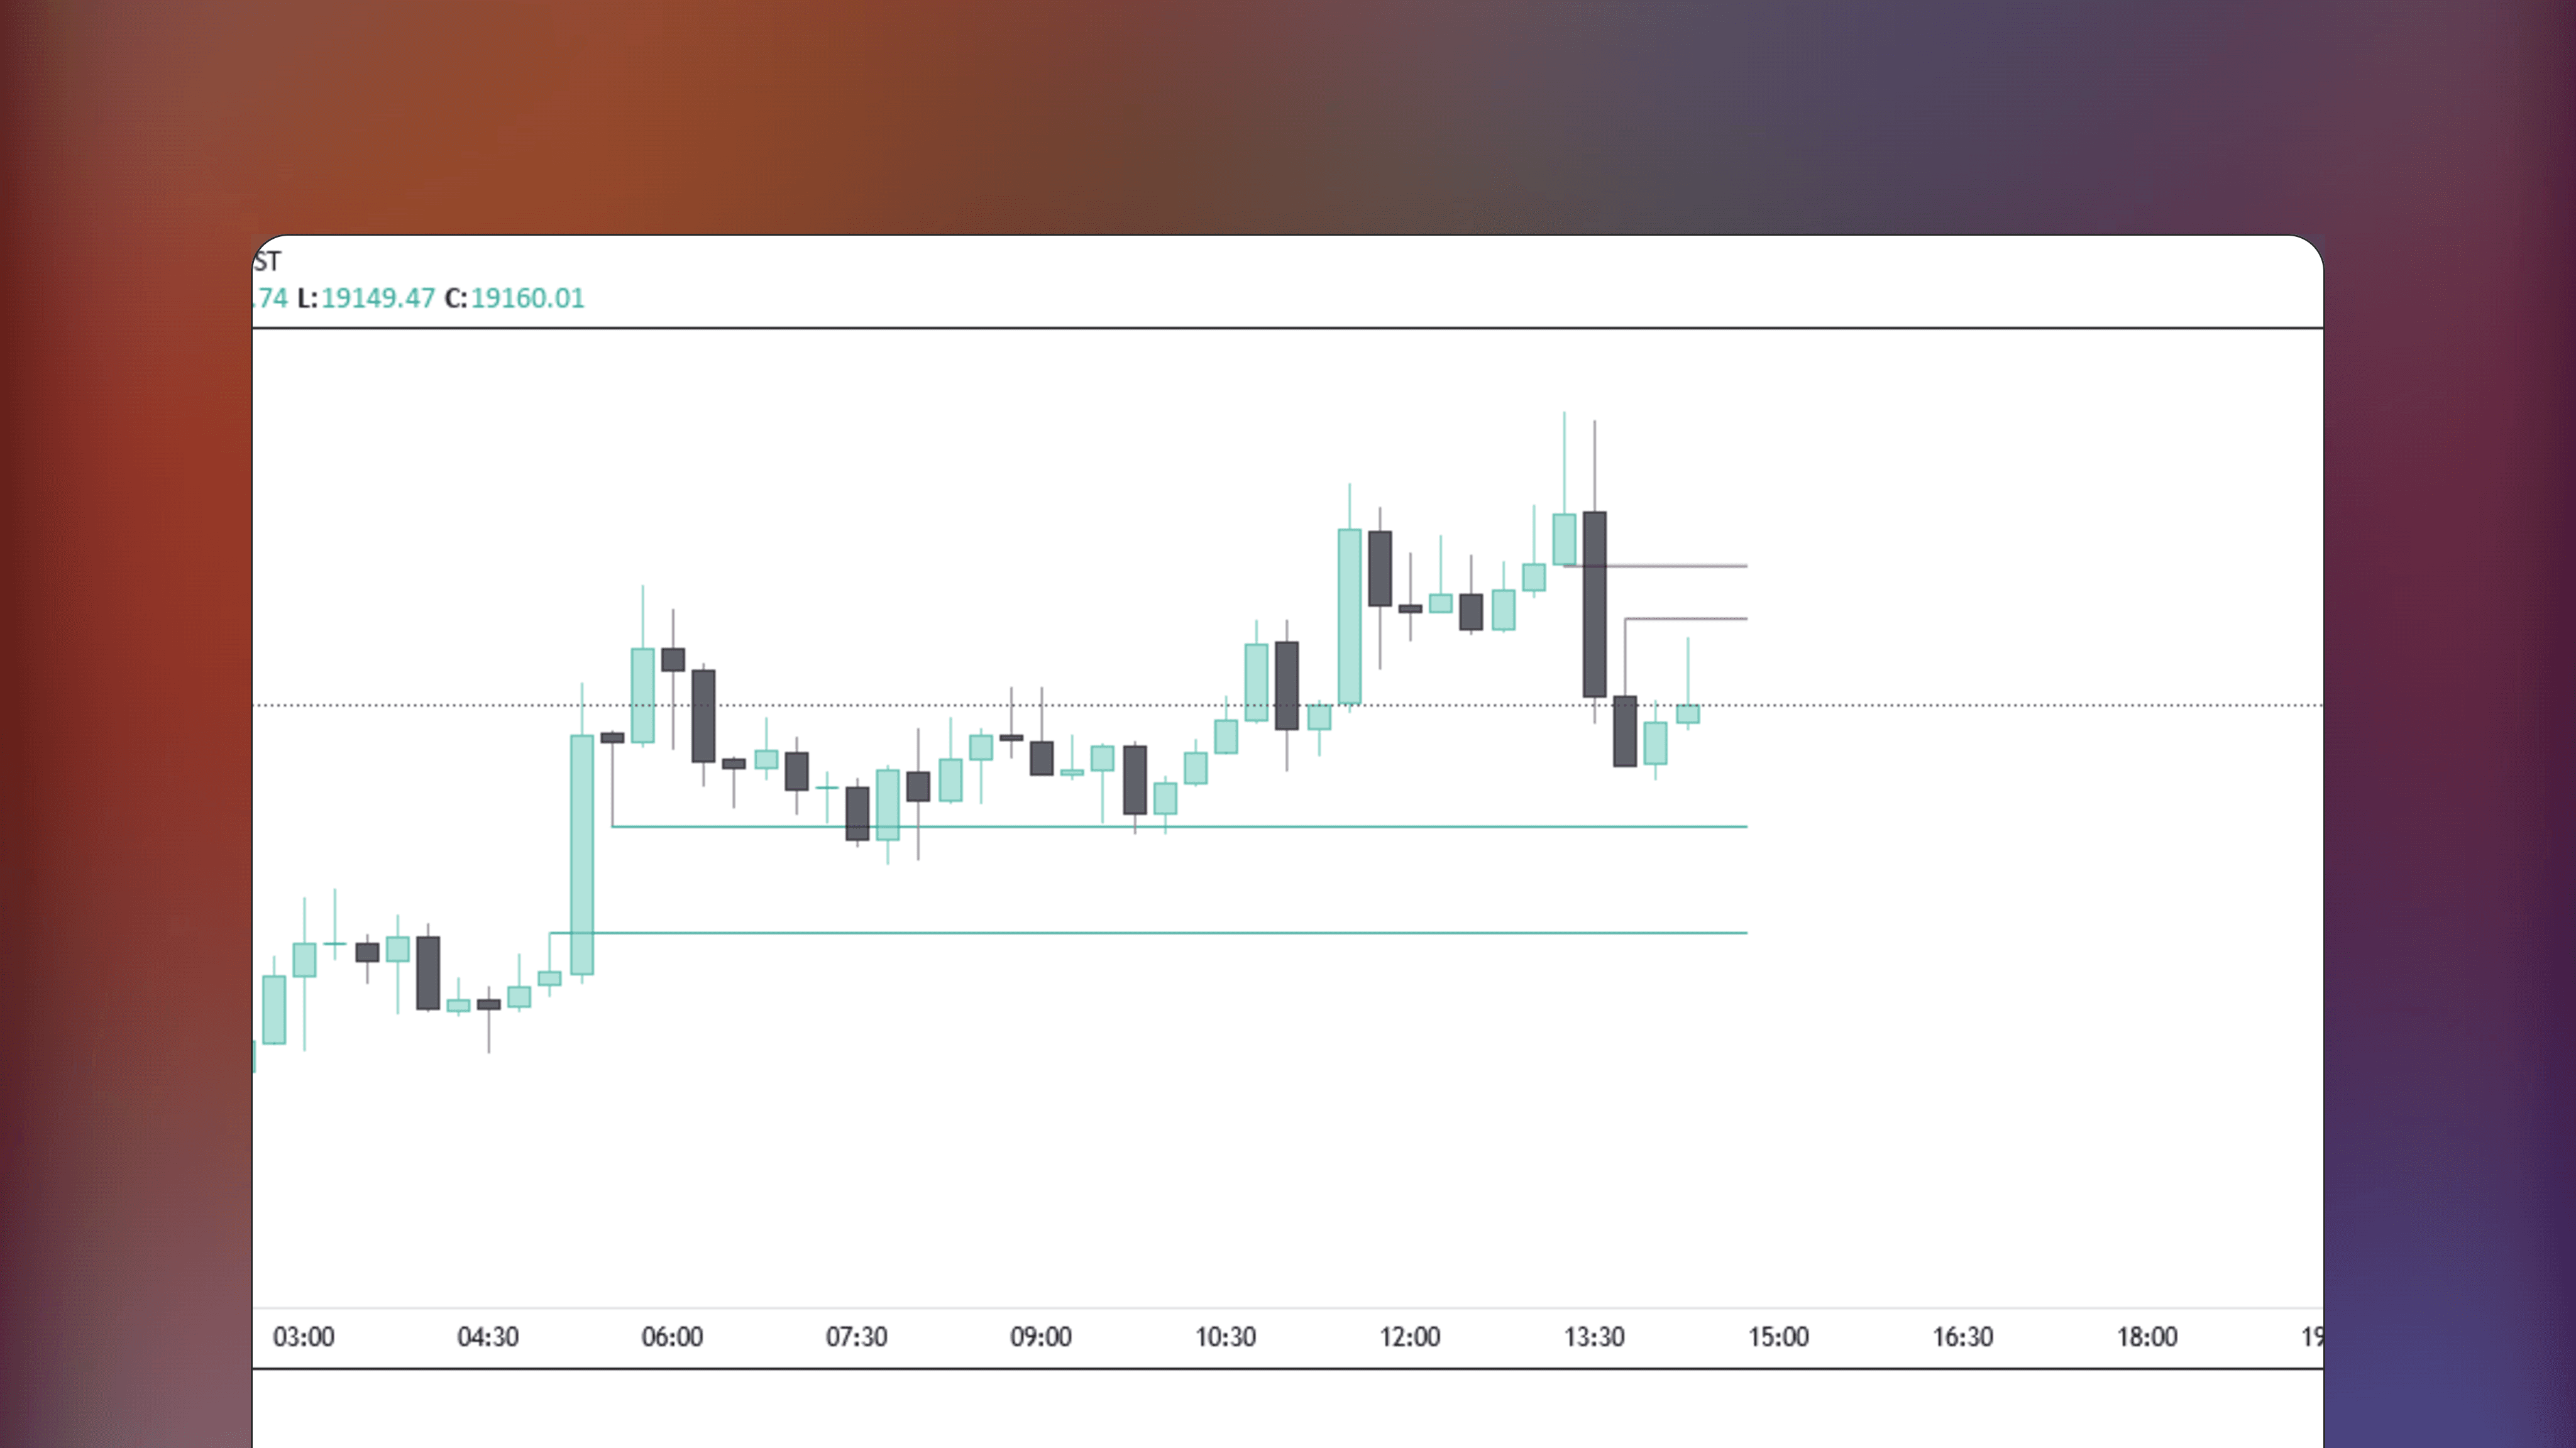
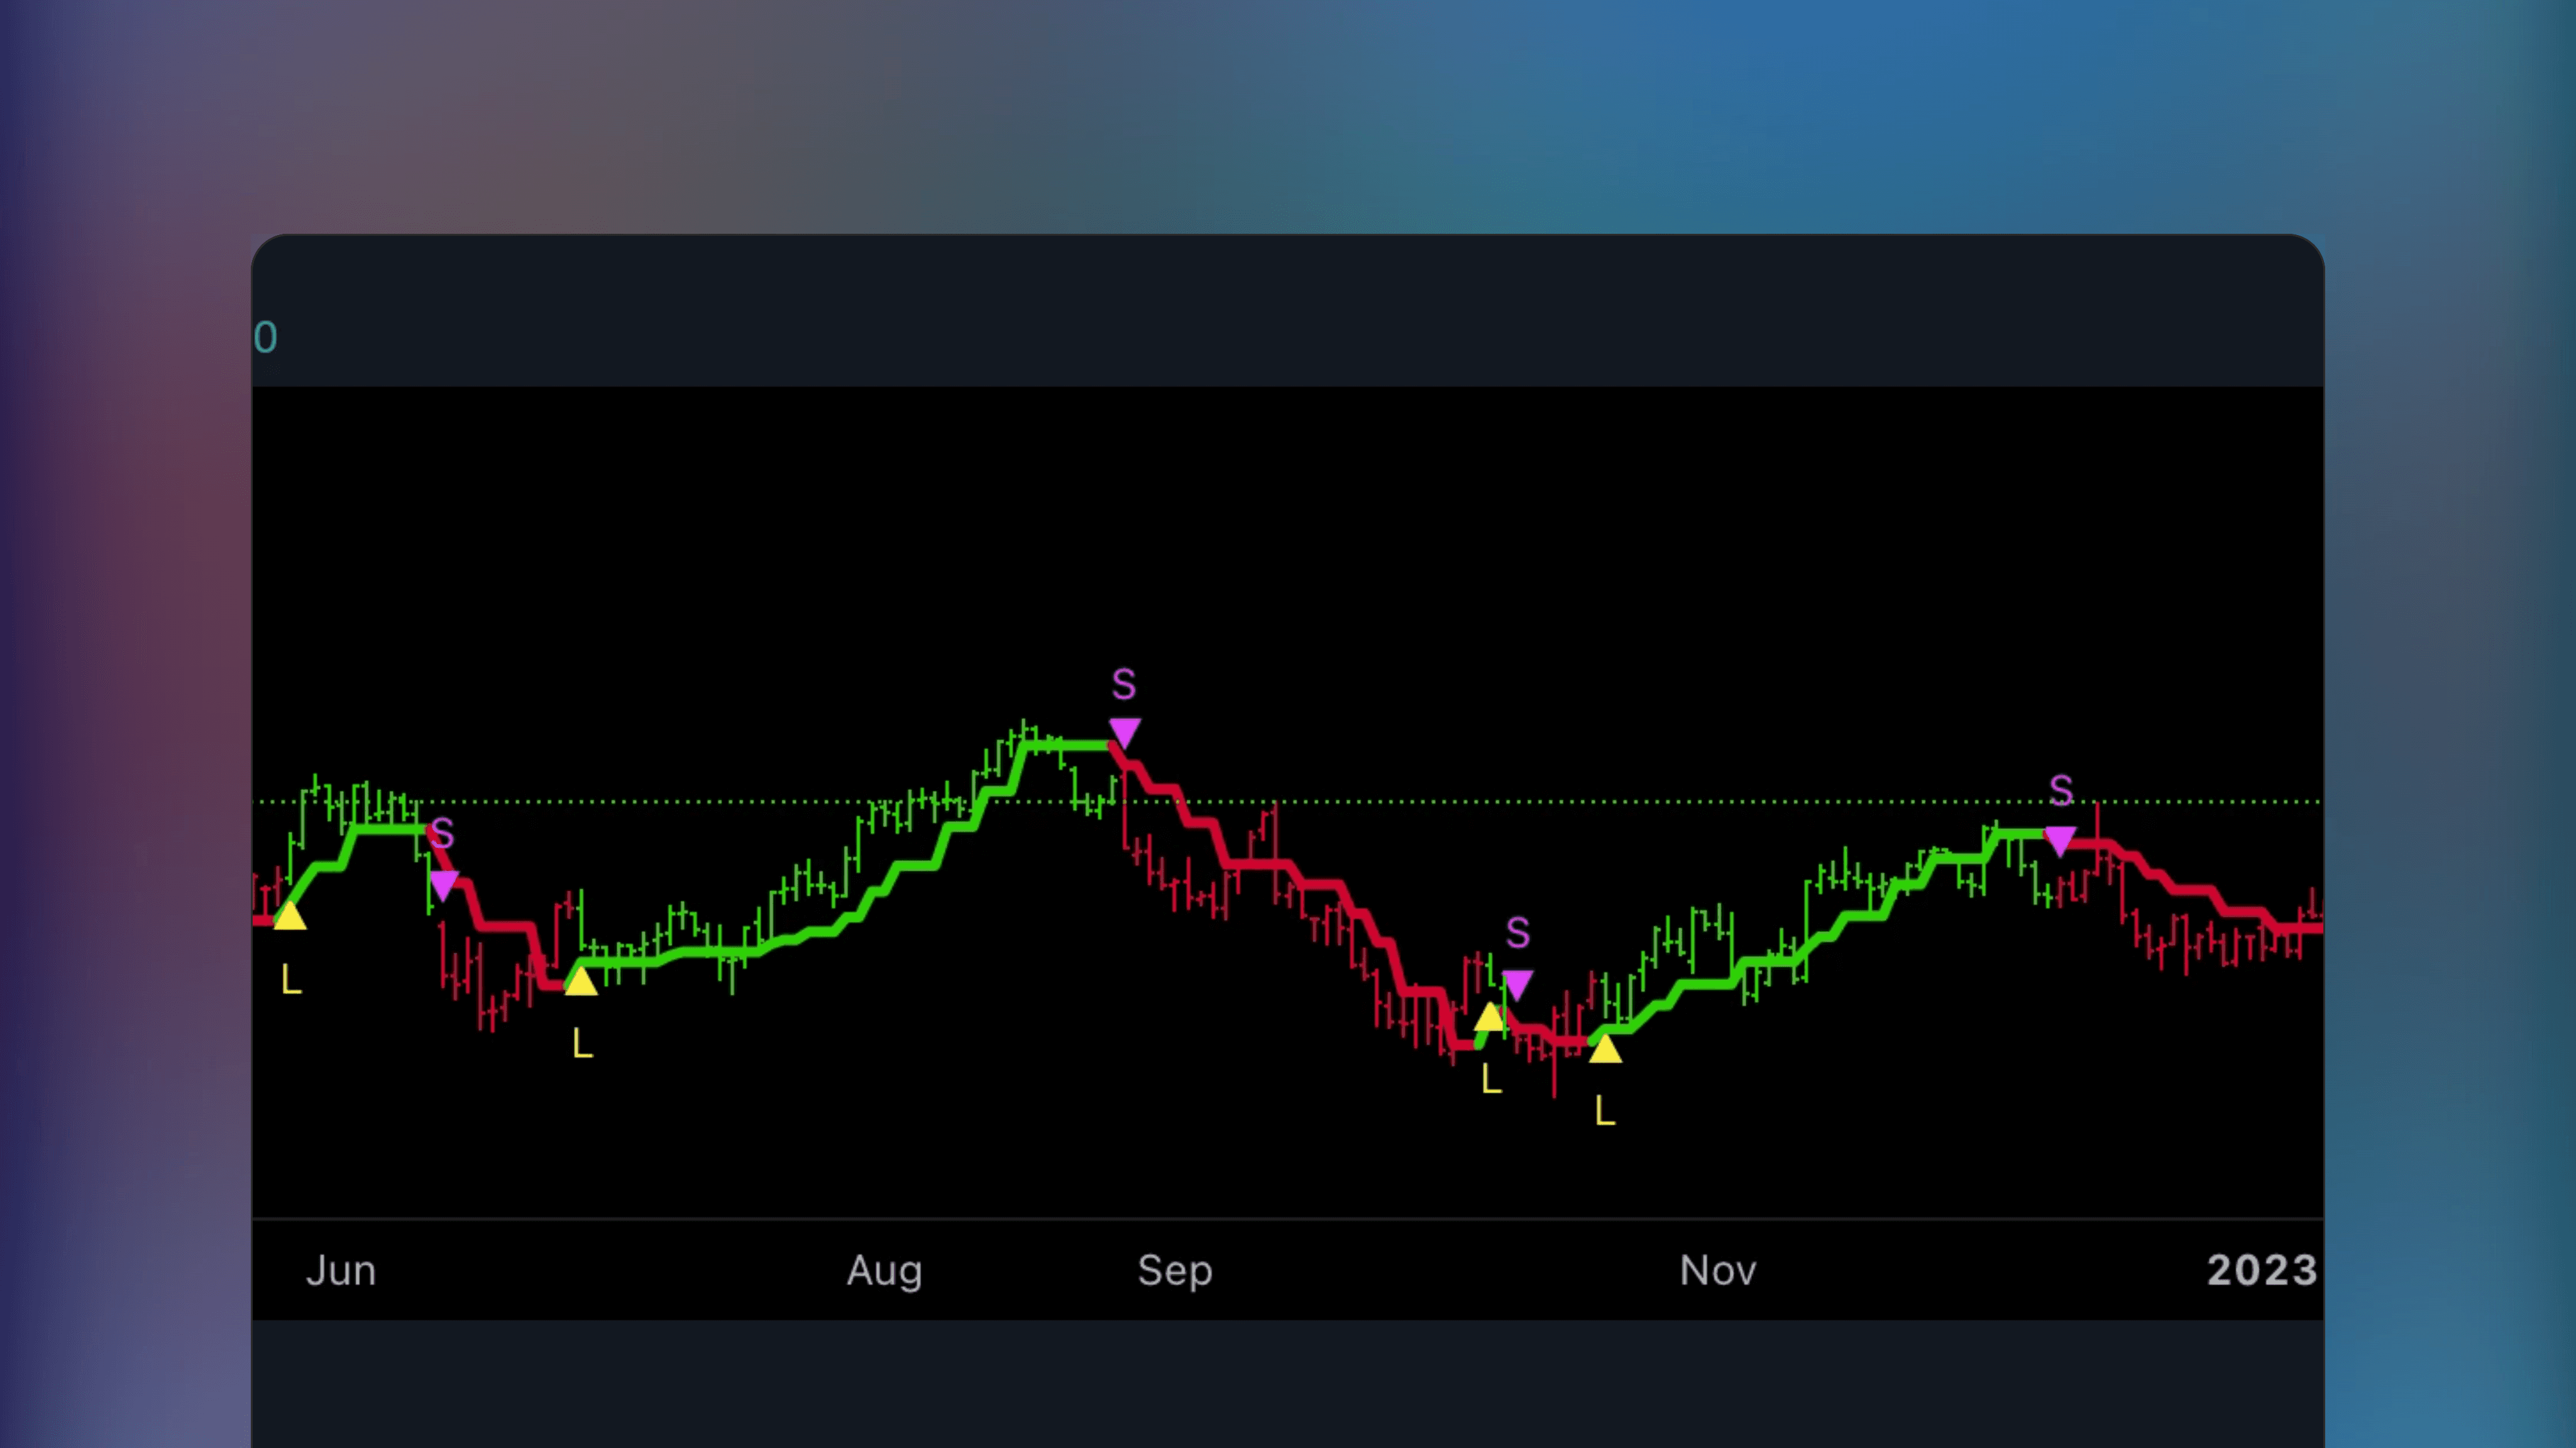
Dynamic Linear Regression Channels is a TradingView Indicator that calculates linear regression channels based on real-time price movements, generating new support/resistance channels when previous ones are broken.
Dynamic Linear Regression Channels is a TradingView Indicator that calculates linear regression channels based on real-time price movements, generating new support/resistance channels when previous ones are broken.

Get on TradingView
This indicator is available on TradingView web charting platform. Signing up for a free account is required, no downloads.
Get on TradingView
This indicator is available on TradingView web charting platform. Signing up for a free account is required, no downloads.
🔑
Open Source
Listing has publically available source code that can be audited and modified as needed.
🔑
Open Source
Listing has publically available source code that can be audited and modified as needed.
💸
Free Access
All features of this listing are fully free to use with no pricing tiers. Simply start using.
💸
Free Access
All features of this listing are fully free to use with no pricing tiers. Simply start using.
✅
Robust Theory
Concepts and theories mentioned in listing are based on generally approved and well established notions.
✅
Robust Theory
Concepts and theories mentioned in listing are based on generally approved and well established notions.
Published by iravan on TradingView
Published by iravan on TradingView
How Dynamic Regression Channels Work
Standard linear regression channels use a fixed lookback period, which can become stale as trends evolve. This indicator solves that by automatically generating new channels whenever price breaks through a previous one - keeping the analysis aligned with the current trend structure.
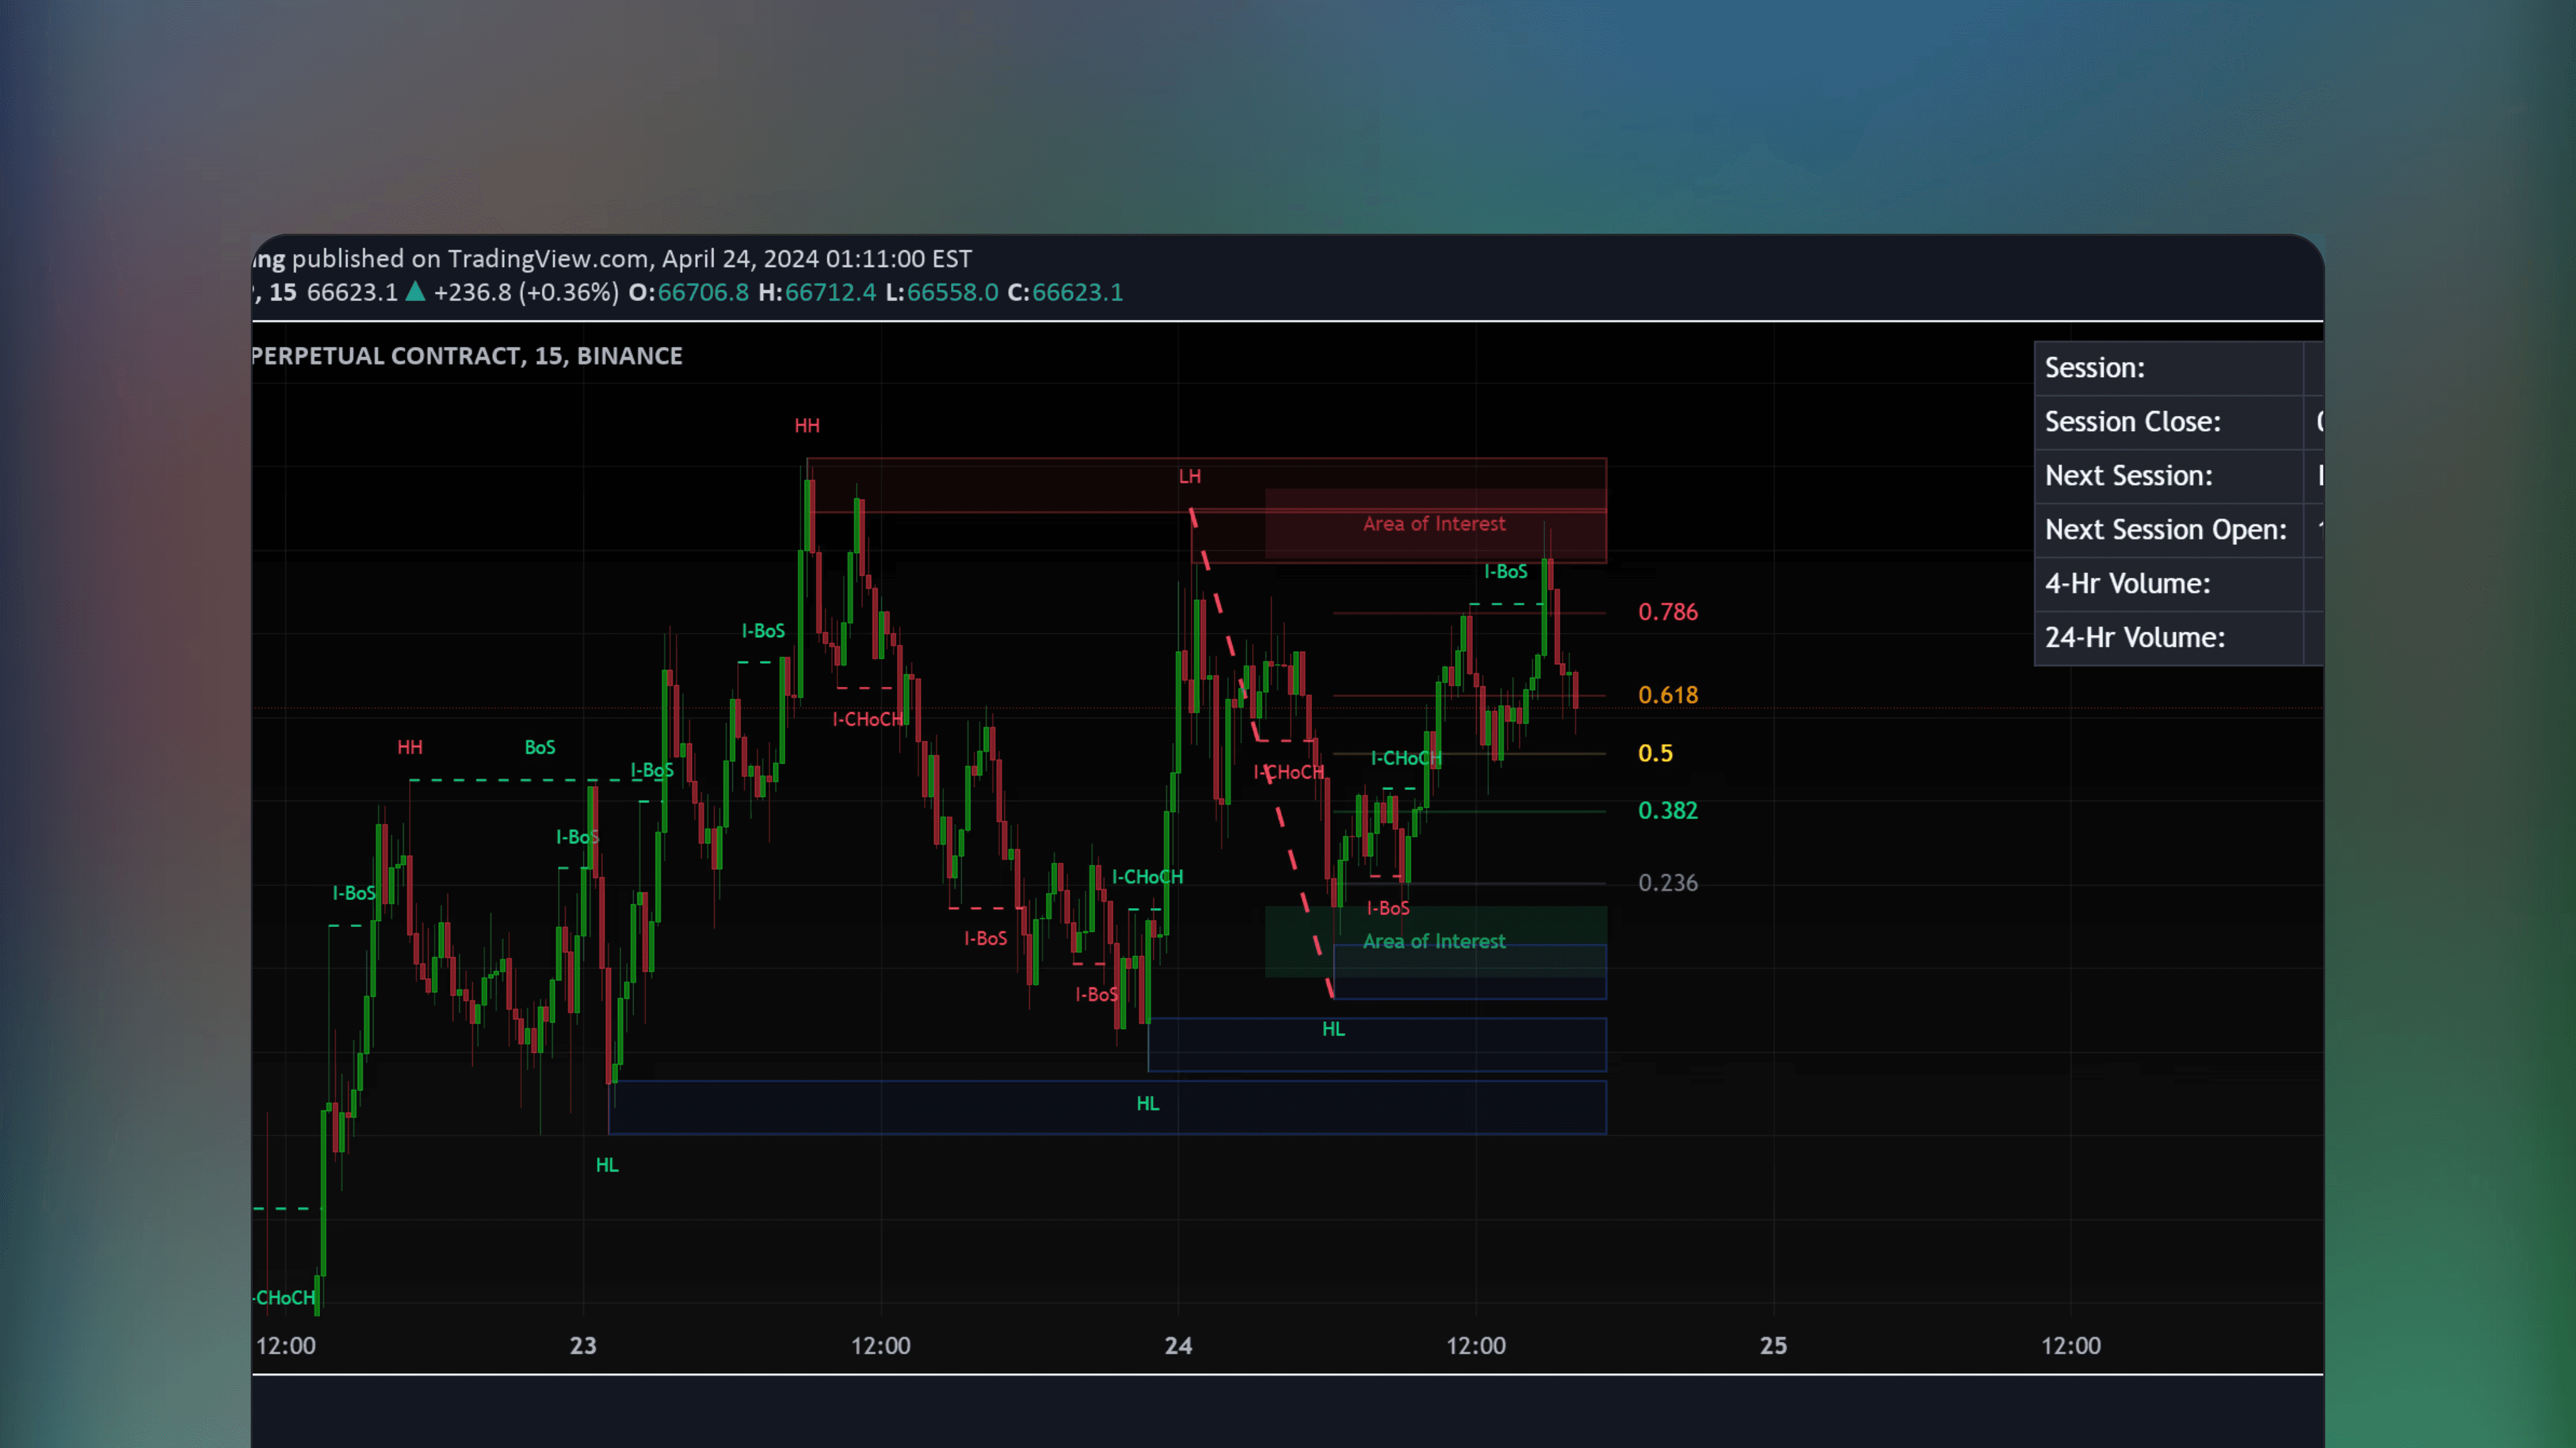
Trend Detection Through Channel Breaks
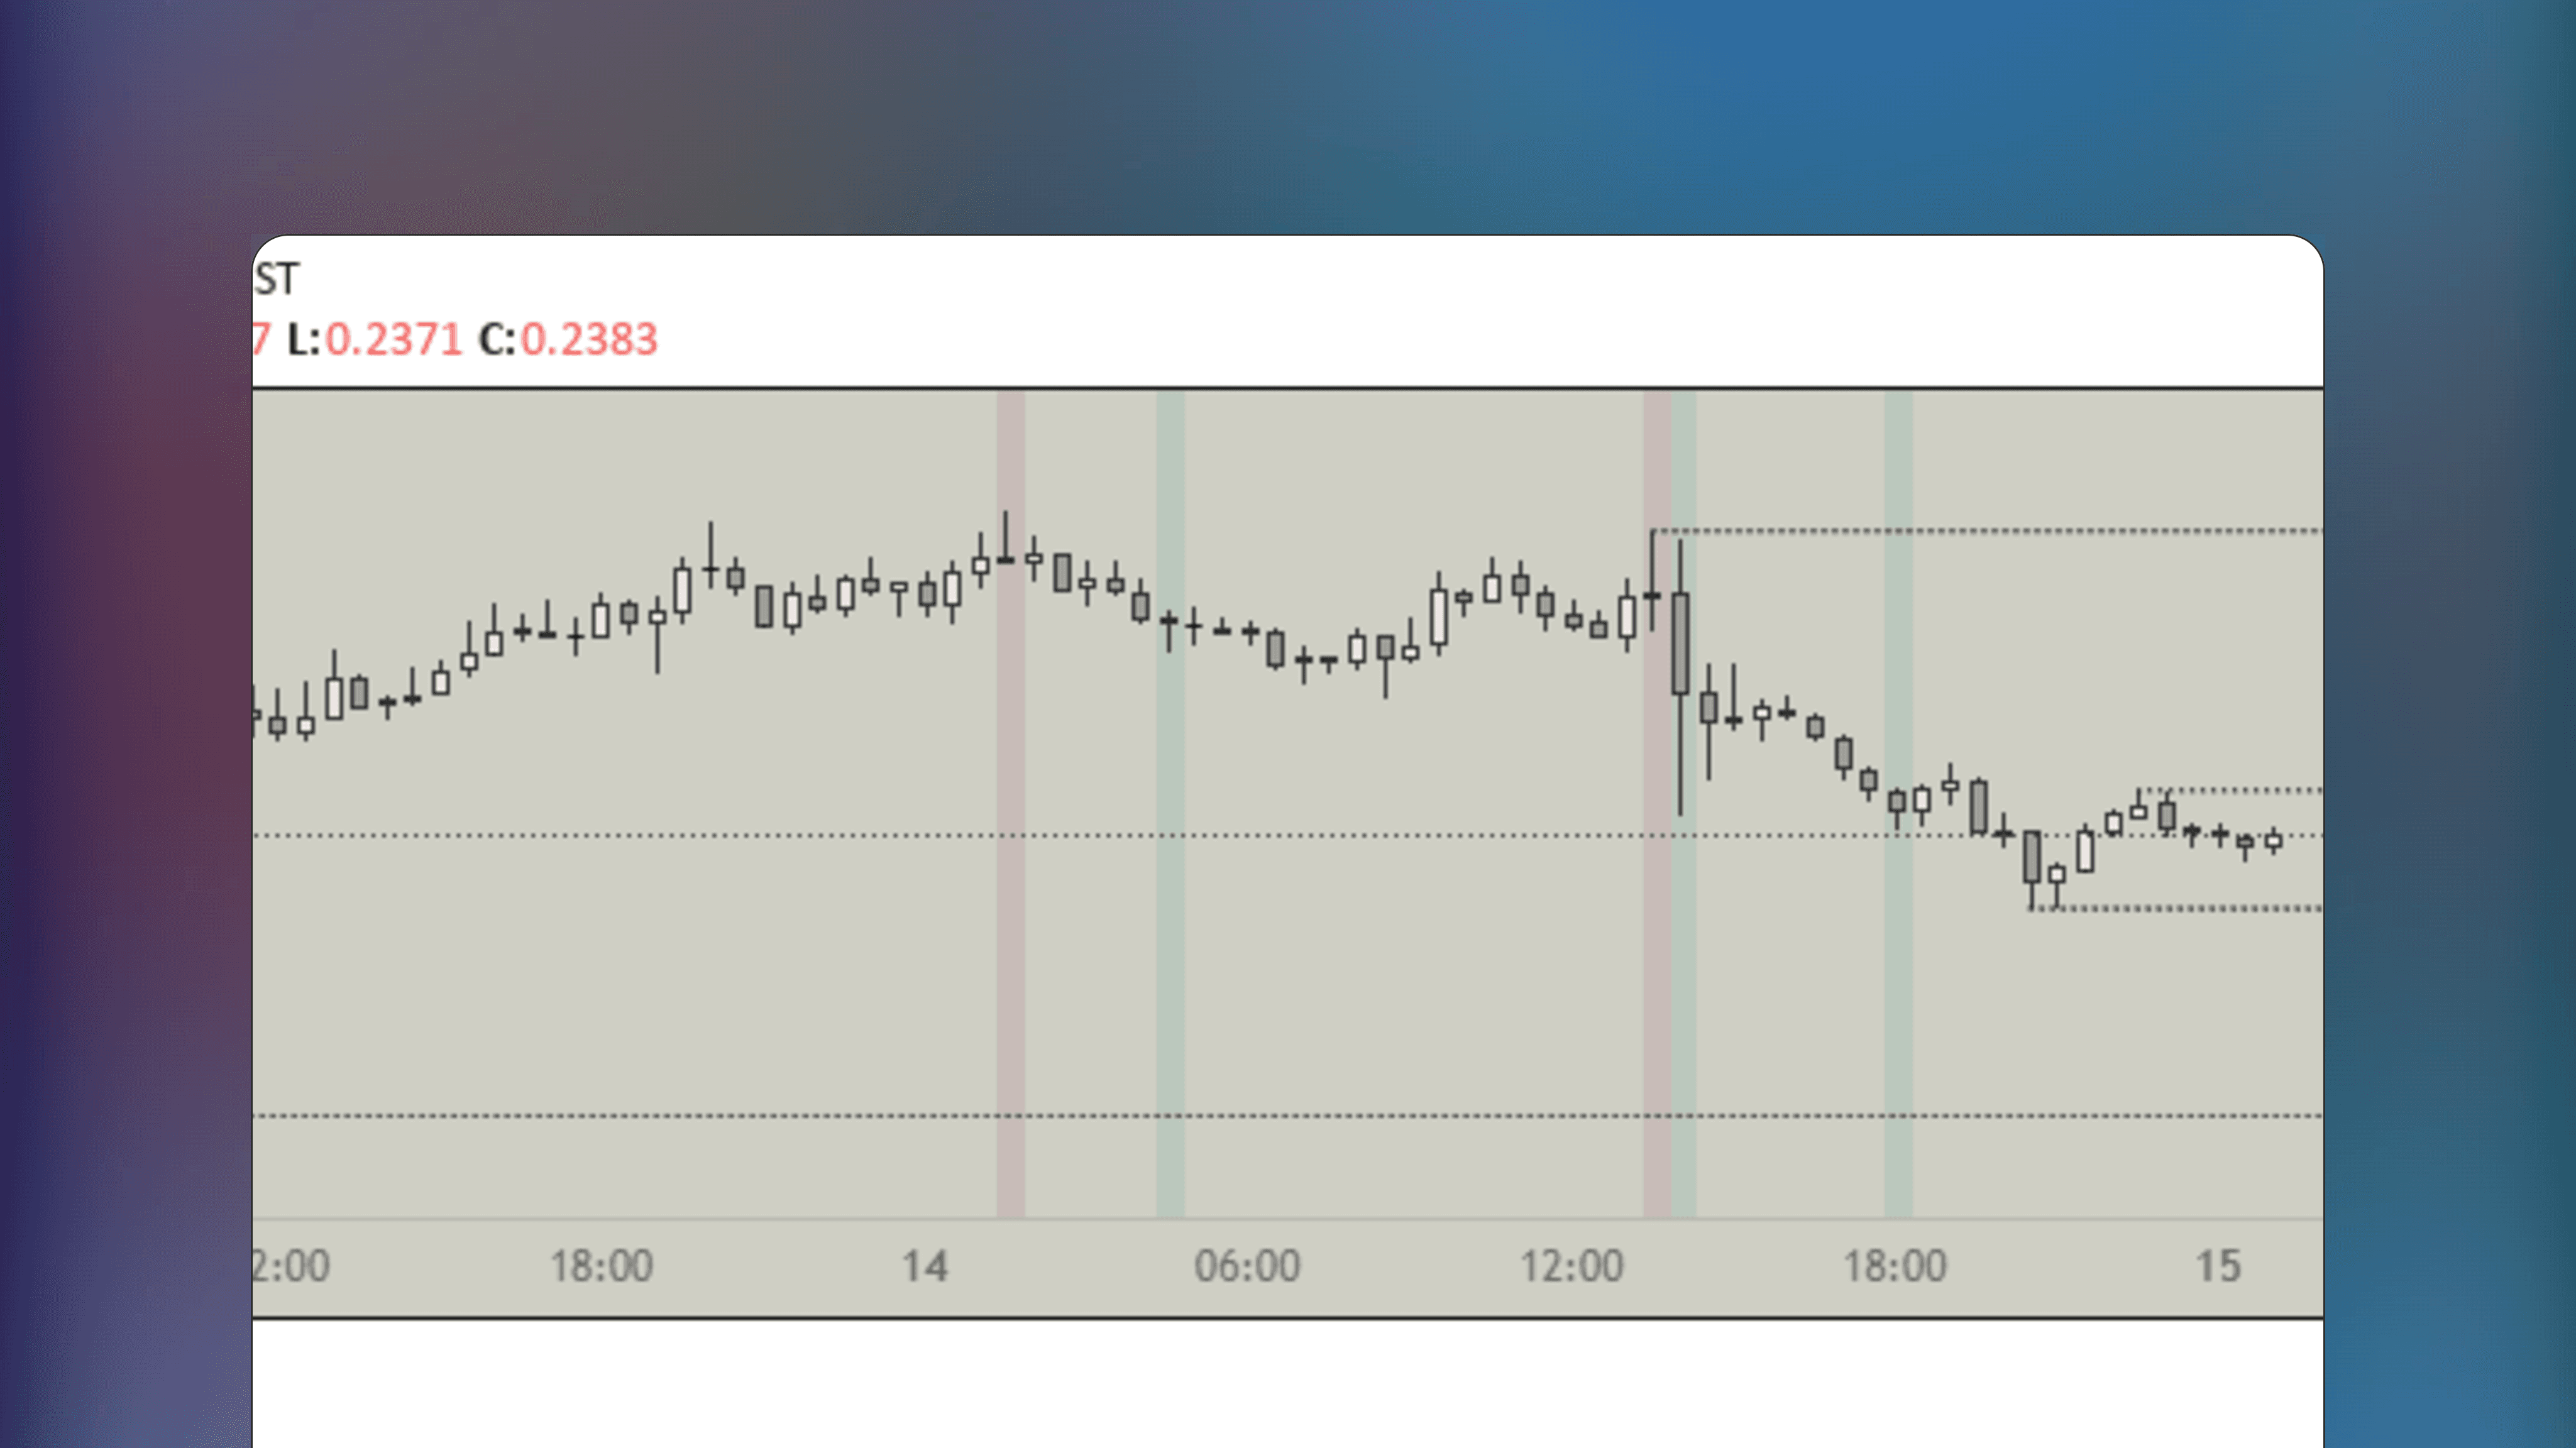
When price closes outside an existing channel, it signals a potential trend shift. The indicator immediately begins calculating a new regression line from the breakout point, adapting its slope and width to the emerging price structure. No manual redrawing is needed.
How Dynamic Regression Channels Work
Standard linear regression channels use a fixed lookback period, which can become stale as trends evolve. This indicator solves that by automatically generating new channels whenever price breaks through a previous one - keeping the analysis aligned with the current trend structure.
Trend Detection Through Channel Breaks
When price closes outside an existing channel, it signals a potential trend shift. The indicator immediately begins calculating a new regression line from the breakout point, adapting its slope and width to the emerging price structure. No manual redrawing is needed.


Support, Resistance and Mean Reversion
The upper and lower boundaries of each channel act as dynamic support and resistance based on standard deviation from the regression line. Price tends to revert toward the midline - so touches of the outer bands often present mean-reversion trade opportunities.
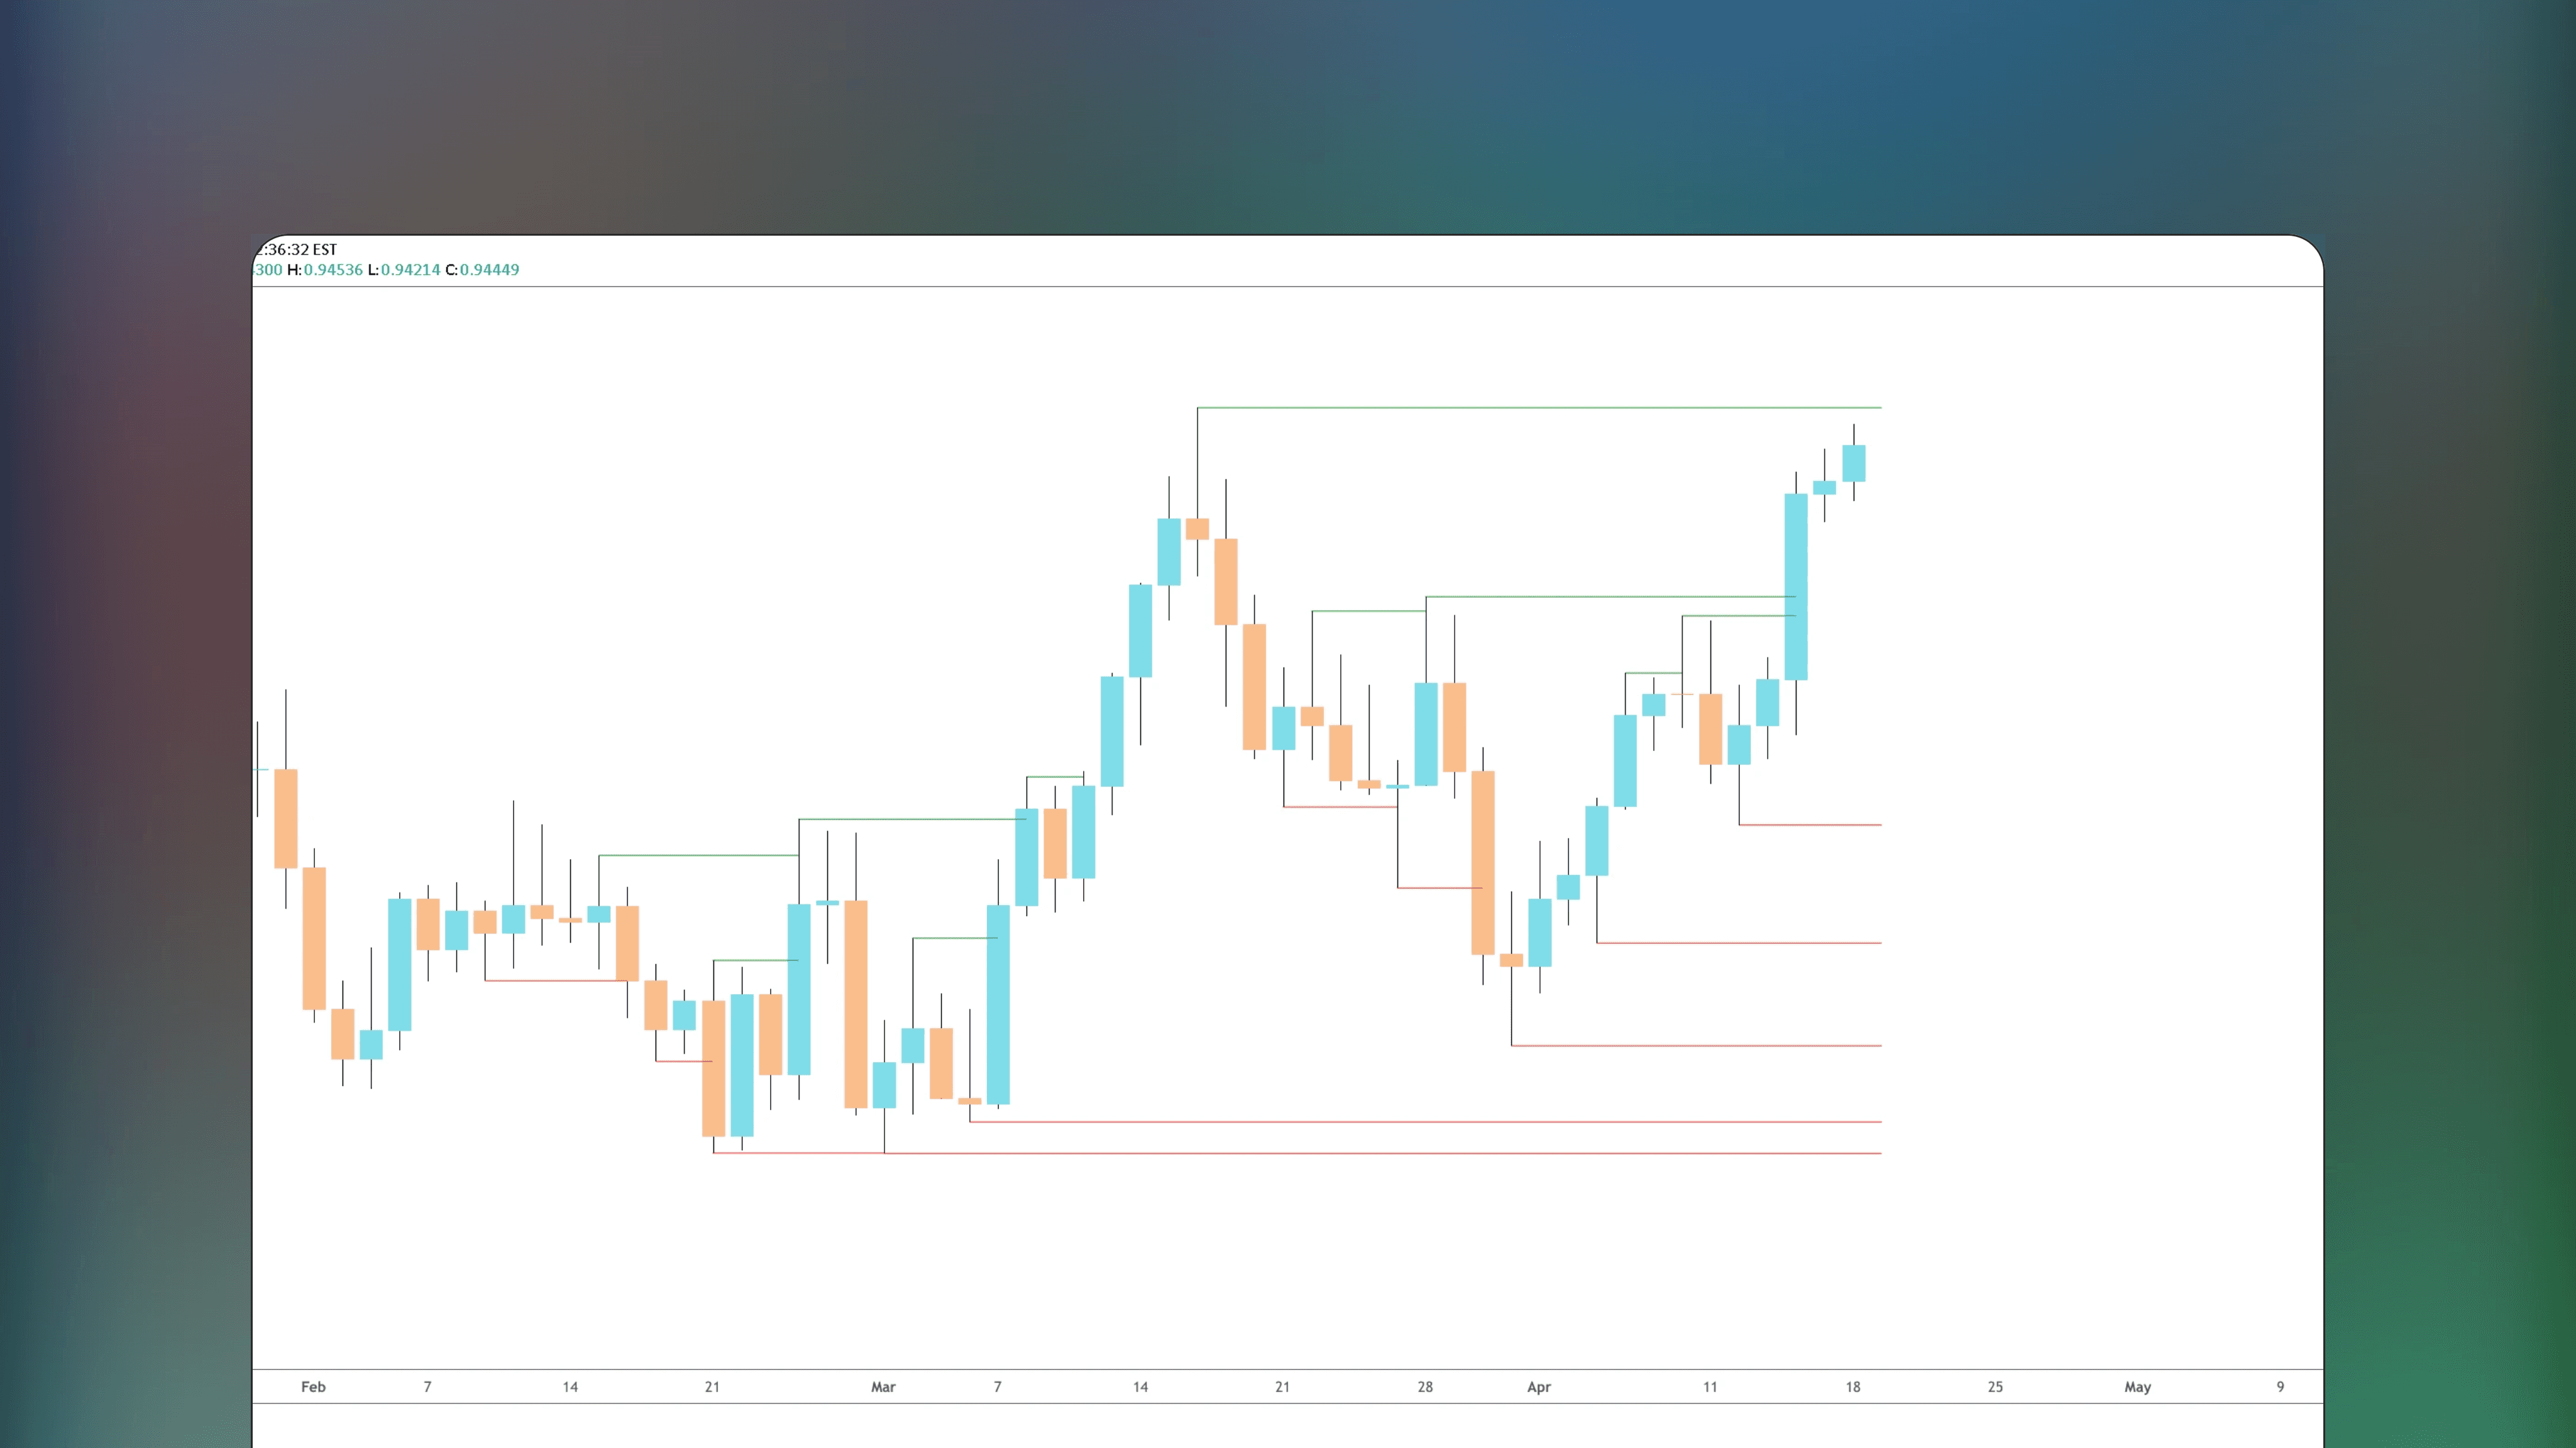
Multi-Trend Visualization
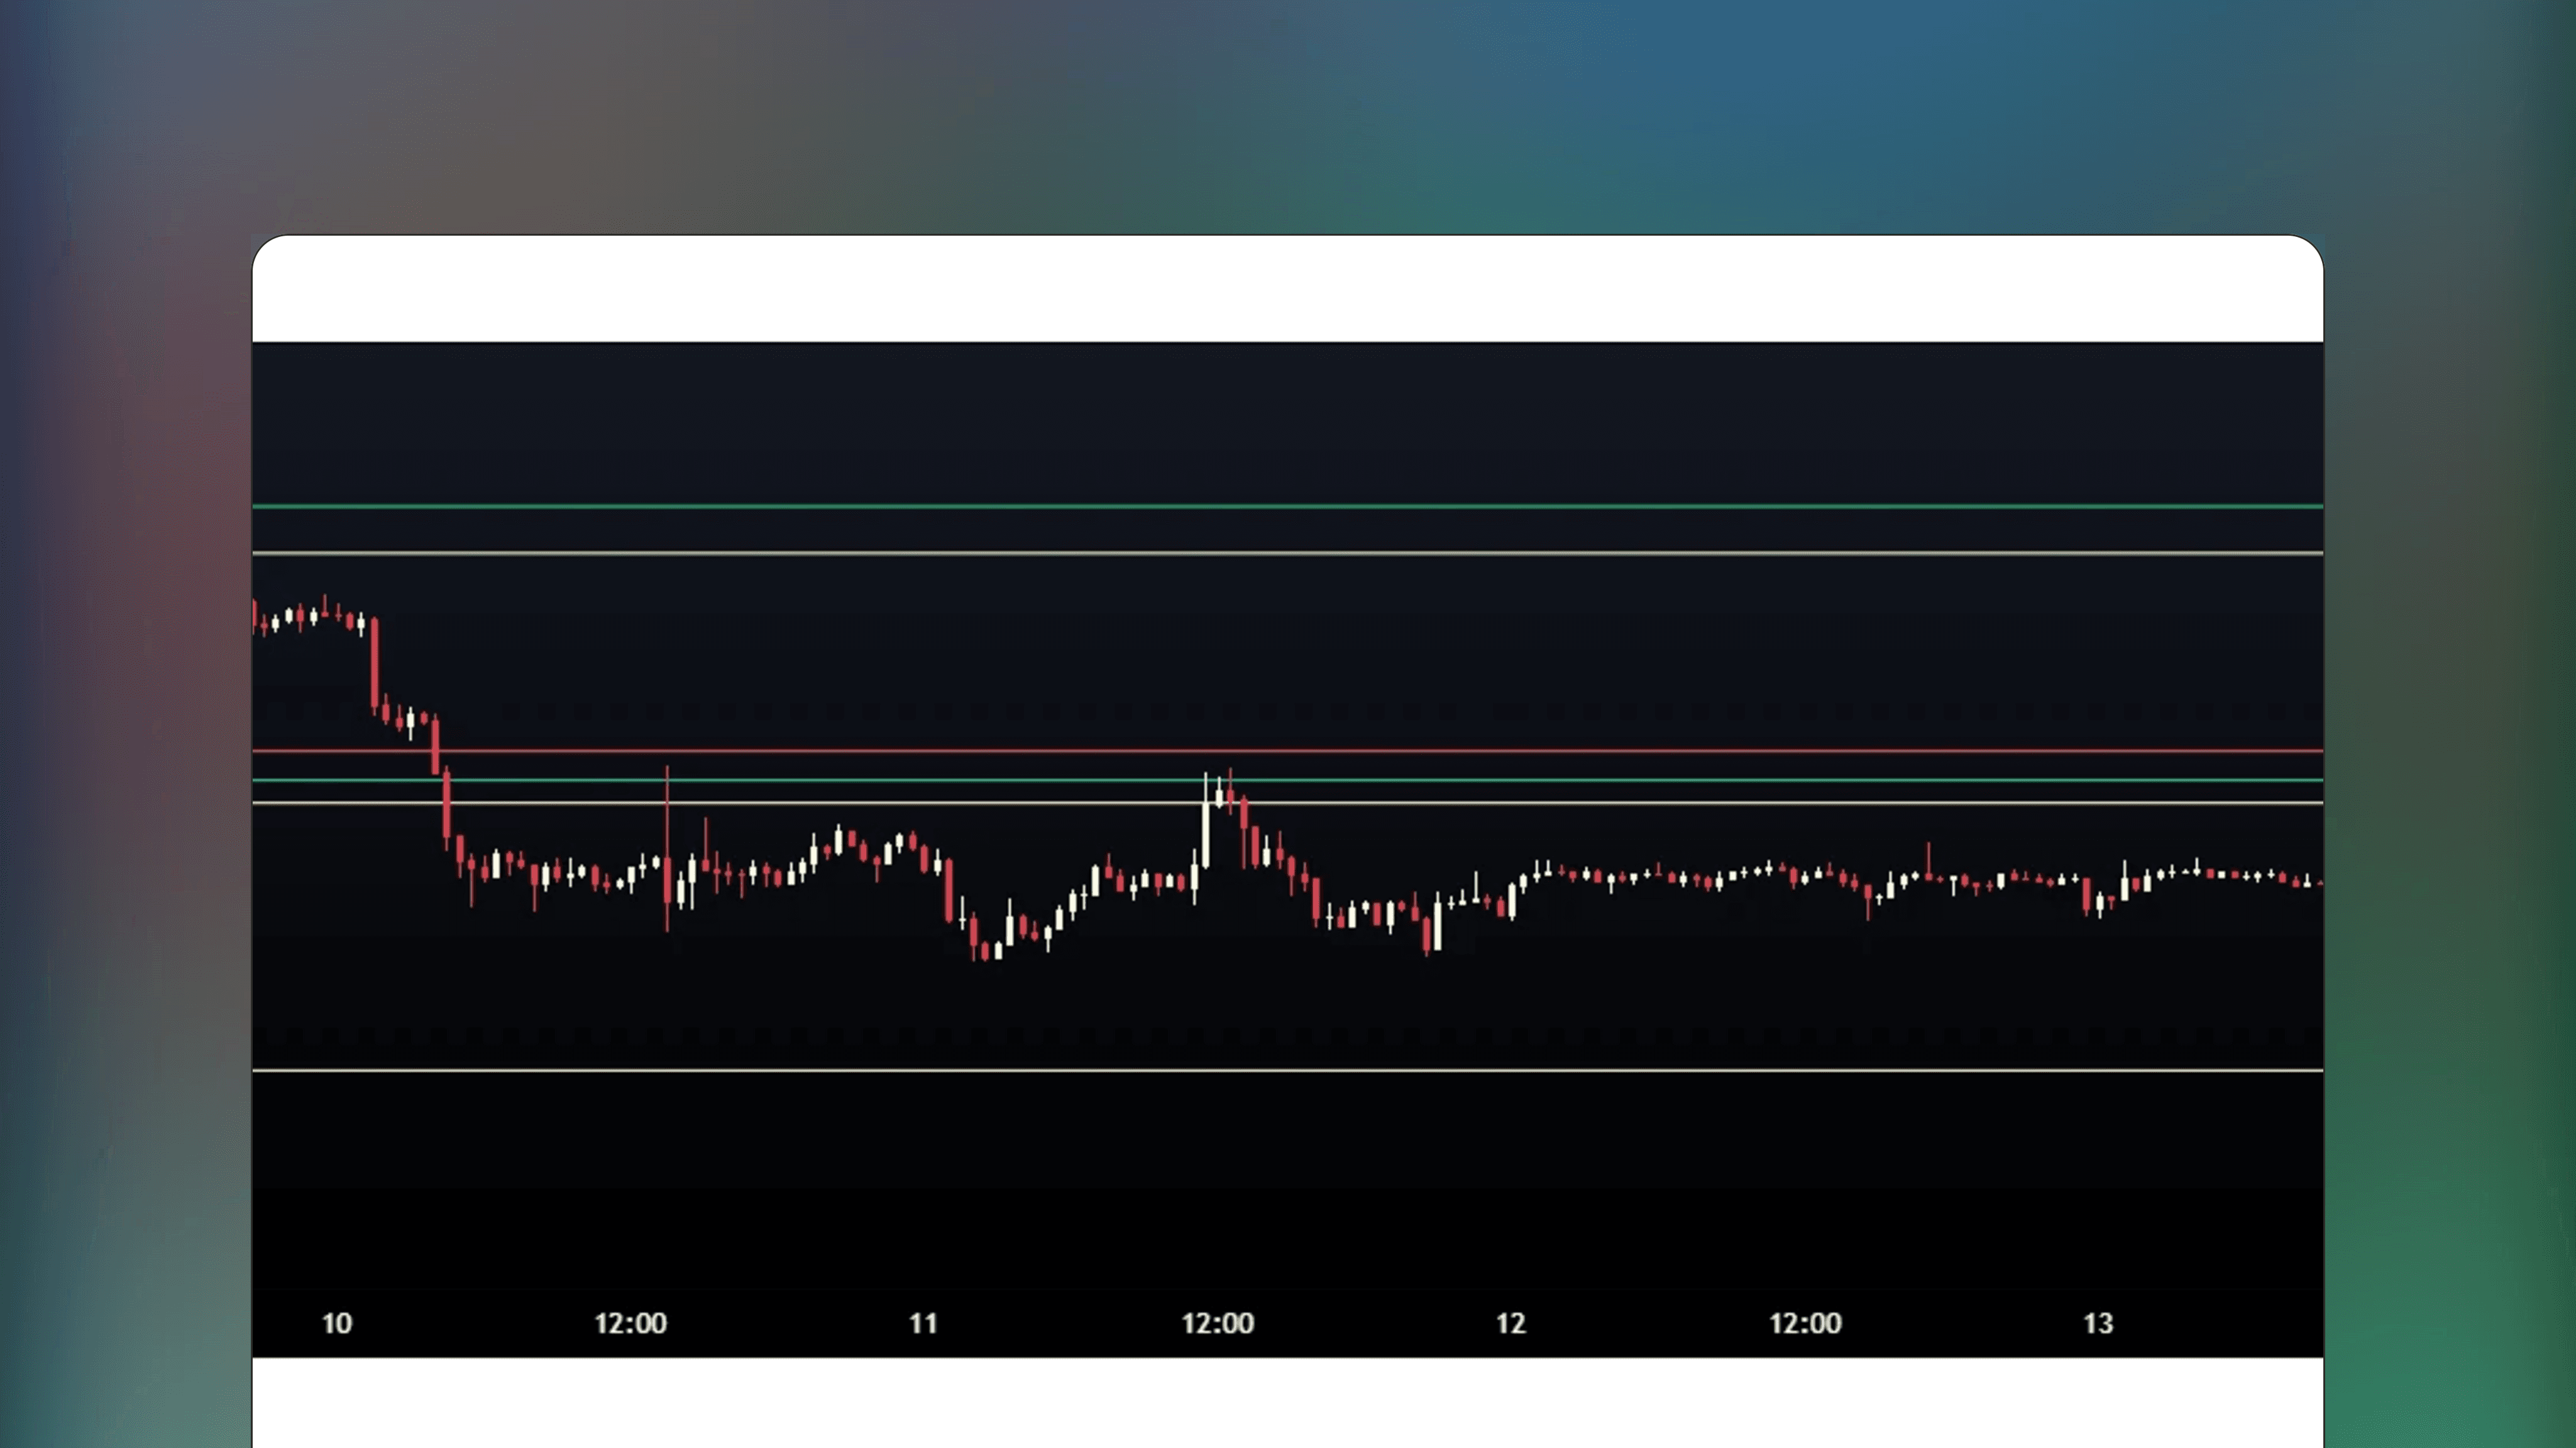
Historical channels remain visible on the chart, creating a layered view of past and present trend structures. This makes it easy to see how the angle of trends has changed over time and identify when a steep trend is flattening or a sideways market begins trending.
Support, Resistance and Mean Reversion
The upper and lower boundaries of each channel act as dynamic support and resistance based on standard deviation from the regression line. Price tends to revert toward the midline - so touches of the outer bands often present mean-reversion trade opportunities.
Multi-Trend Visualization
Historical channels remain visible on the chart, creating a layered view of past and present trend structures. This makes it easy to see how the angle of trends has changed over time and identify when a steep trend is flattening or a sideways market begins trending.
Linear regression, fully automated
Linear regression, fully automated
Standard regression channels use fixed lookback periods that become stale as trends evolve. This indicator generates new channels automatically whenever price breaks through a previous one, keeping analysis aligned with current structure.
Standard regression channels use fixed lookback periods that become stale as trends evolve. This indicator generates new channels automatically whenever price breaks through a previous one, keeping analysis aligned with current structure.
Trade Dynamic Support and Resistance
Upper and lower channel boundaries act as dynamic support and resistance based on standard deviation. Touches of outer bands often present mean-reversion opportunities.
Follow Trend Evolution Automatically
When price closes outside an existing channel, a new regression line begins calculating from the breakout point. No manual redrawing needed.
Layer Statistical Boundaries for Confluence
Historical channels remain visible, creating a layered view of past and present trend structures. Multiple channel boundaries at one price add confluence.
Common Questions About Dynamic Regression Channels
Common Questions About Dynamic Regression Channels
Dynamic regression channels adapt automatically as trends evolve and break. These questions address how the channels update, when to expect new calculations, and how to interpret the visual output on your chart.
Dynamic regression channels adapt automatically as trends evolve and break. These questions address how the channels update, when to expect new calculations, and how to interpret the visual output on your chart.
How does the indicator know when to generate a new channel?
When price closes outside an existing channel, the indicator interprets this as a potential trend shift. A new regression line begins calculating from the breakout point, adapting its slope and width to the emerging price structure automatically.
Should I use channel touches for mean reversion entries?
The upper and lower boundaries act as dynamic support and resistance based on standard deviation from the regression line. Price tends to revert toward the midline, so touches of outer bands often present mean-reversion opportunities.
Why do historical channels remain visible on the chart?
Keeping past channels visible creates a layered view of how trend angles changed over time. You can see when a steep trend flattened or when a sideways market began trending. This historical context helps frame the current channel in proper perspective.
🌐
🌐
Web sentiment
Web sentiment
Traders find Dynamic Linear Regression Channels useful for real-time adaptability and accuracy in dynamic markets, praising its customization. Multi-time frame analysis, but signals and analysis could be clearer.
Traders find Dynamic Linear Regression Channels useful for real-time adaptability and accuracy in dynamic markets, praising its customization. Multi-time frame analysis, but signals and analysis could be clearer.
Source: Online Discussion
Source: Online Discussion
Source: Online Discussion
✍️
✍️
TradersList Reviews (7)
TradersList Reviews (7)
TradersList Community has given this listing four stars, indicating a well trusted listing with great utility value. This listing is one of the better ones on TradersList.
TradersList Community has given this listing four stars, indicating a well trusted listing with great utility value. This listing is one of the better ones on TradersList.
⭐️
⭐️
⭐️
⭐️
⭐️
Source: TradersList Reviews
Source: TradersList Reviews


Bookmark
Saved here
🤖
Get Indicator
Find Indicator
Review
Review Indicator
✍️
⭐️
⭐️
⭐️
⭐️
⭐️
3
Comments
Read on Telegram
Listing by third party publisher. Not financial advice.
Risk Disclosure


Share Listing
🤖
🤖
Get Indicator
Get Indicator
Find Indicator
Find Indicator
✍️
Review
Review
Review Indicator
Review Indicator
⭐️
⭐️
⭐️
⭐️
⭐️
Saved here
Bookmark
Listing by third party publisher. Not financial advice.
Listing by third party publisher. Not financial advice.
Risk Disclosure
Risk Disclosure
Share
🤖
3


🤖
3
🤖
3
✍️
By Author
More by iravan
🤖
by iravan

Free
TradingView Indicator
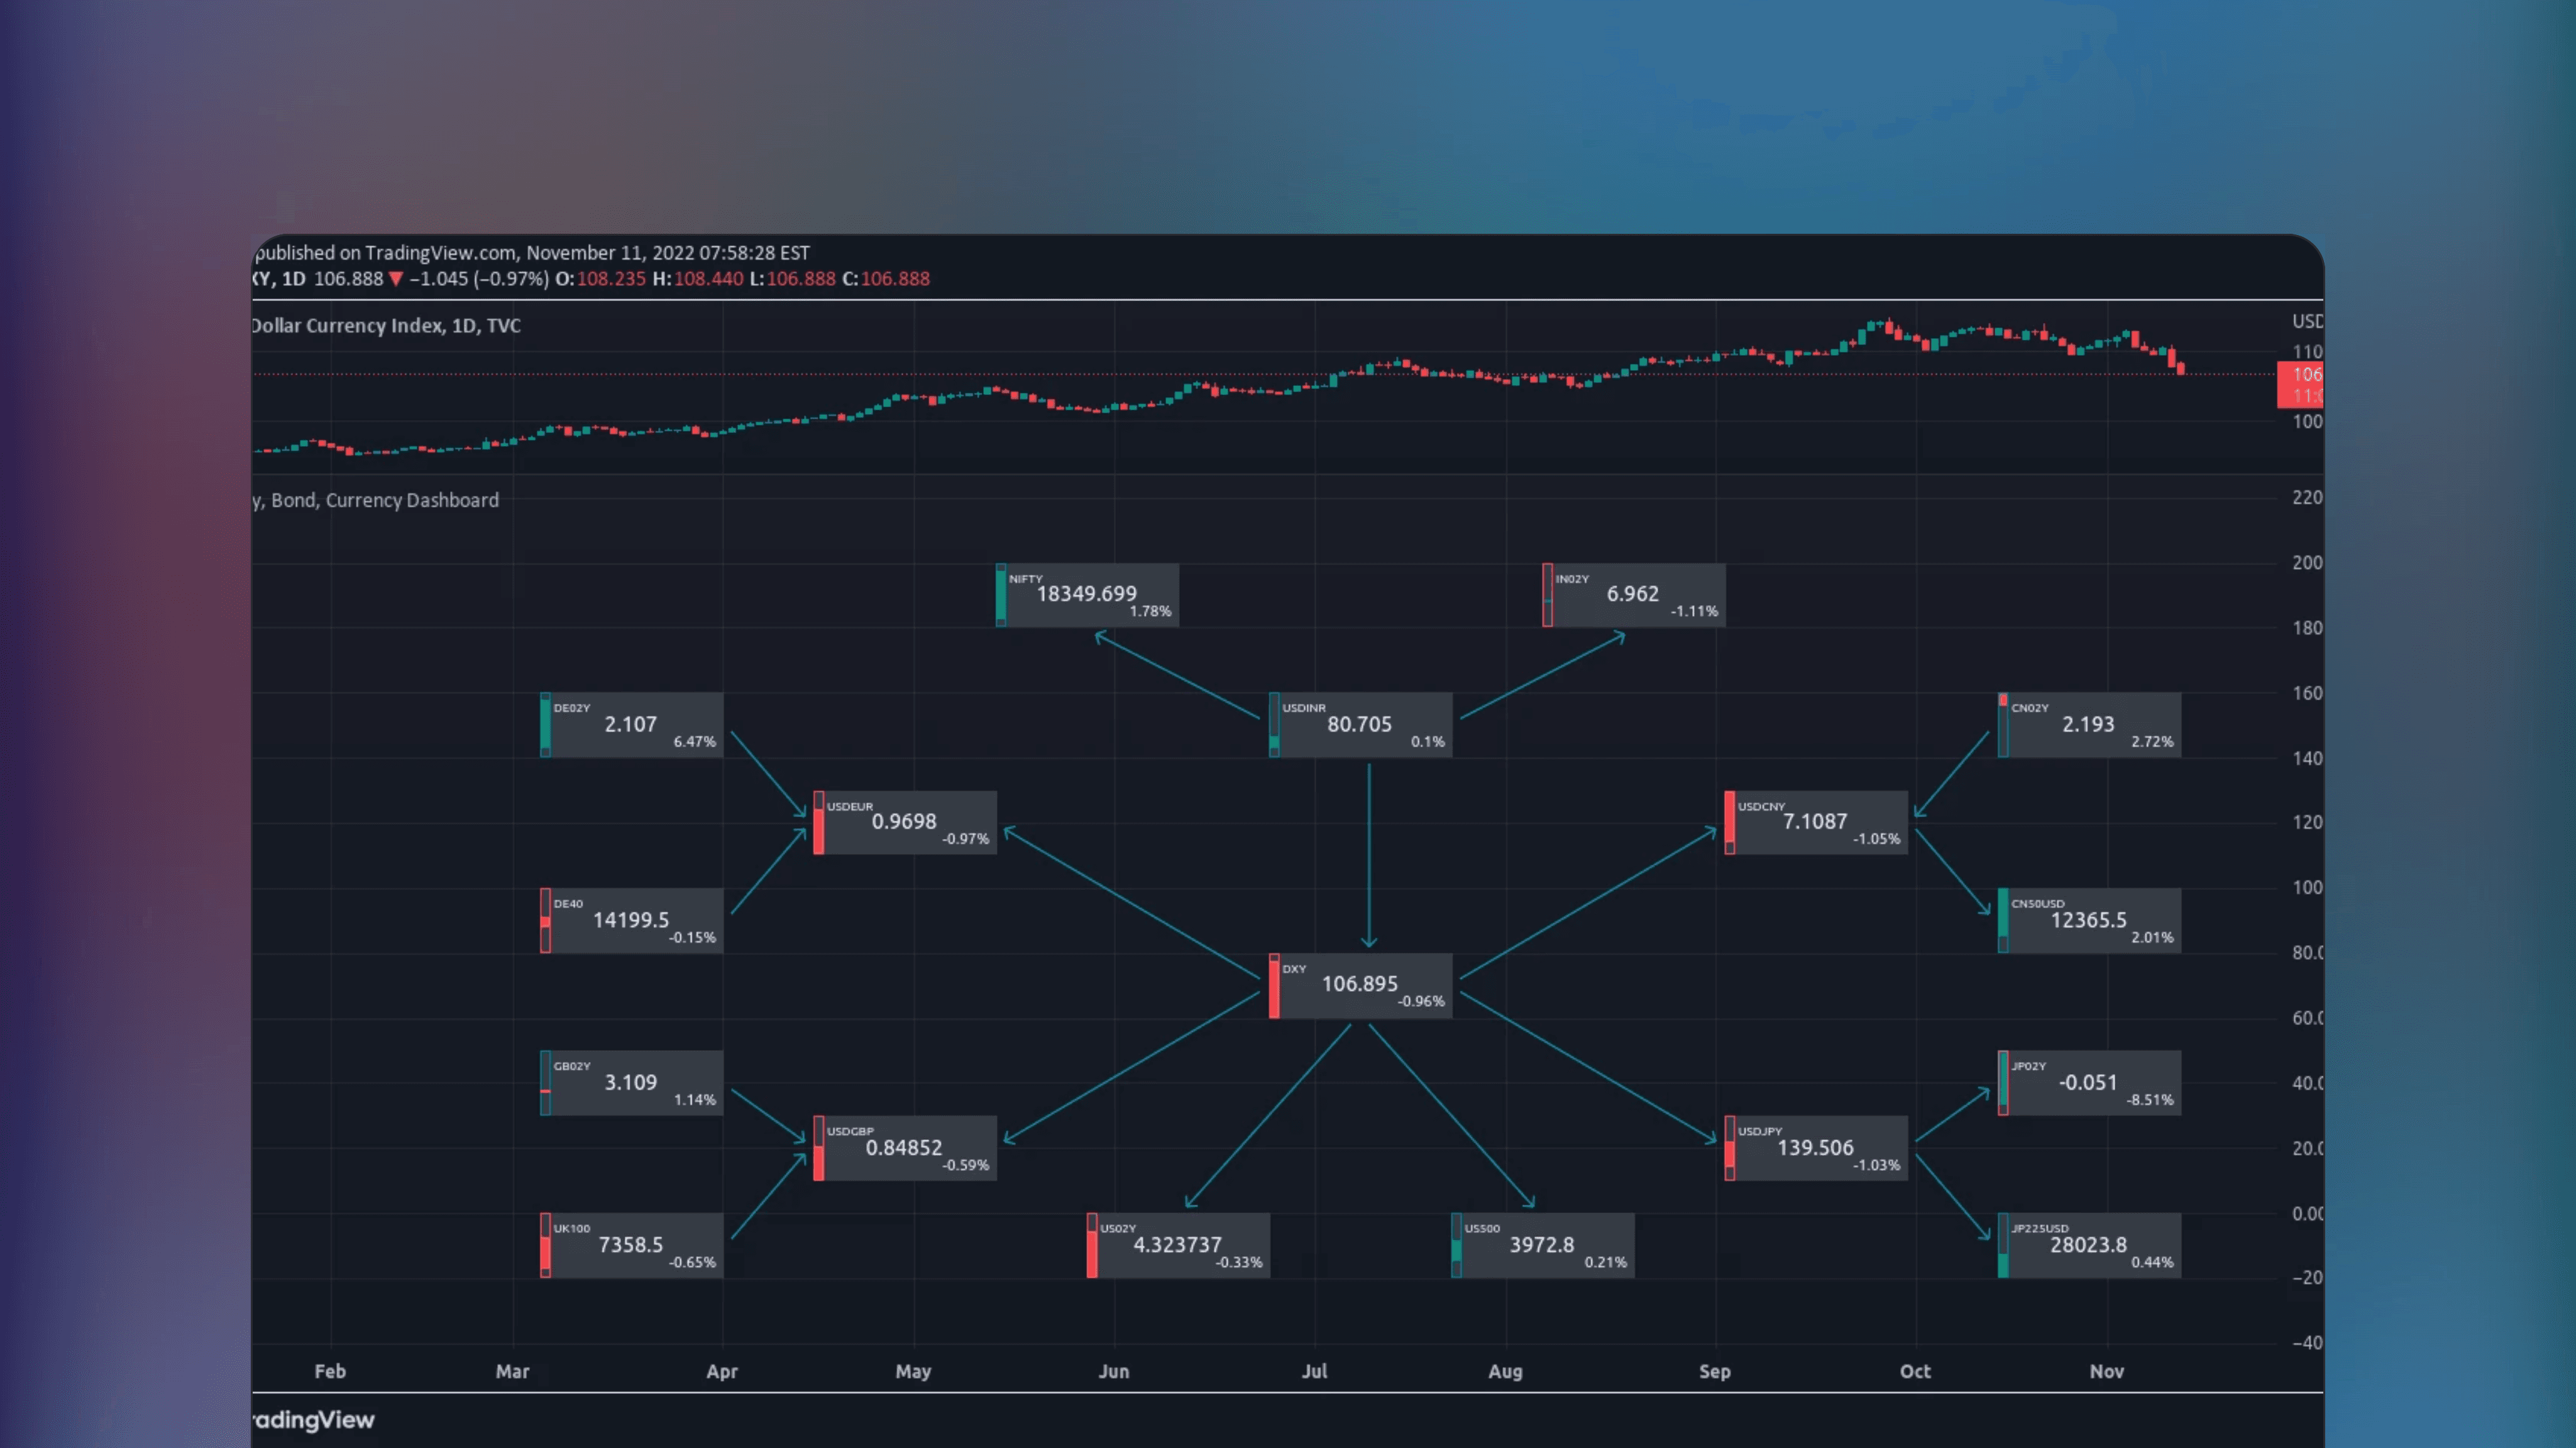
Equity Bond Currency Dashboard
🔑
🌐
✅
Equity Bond Currency Dashboard is a TradingView Indicator that visualizes demand-flow between equities, bonds and currencies across six countries, allowing track of institutional money flows and visuals for interconnected market dynamics.

🤖
by iravan
Free
TradingView Indicator
Top 40 constituents of S&P 500 Index
🔑
🌐
✅
Top 40 constituents of S&P 500 Index is a free TradingView Indicator presenting real-time candle data for the top 40 S&P 500 stocks side-by-side, highlighting broad market breadth and depth in a given time frame.
🤖
by iravan
Free
TradingView Indicator
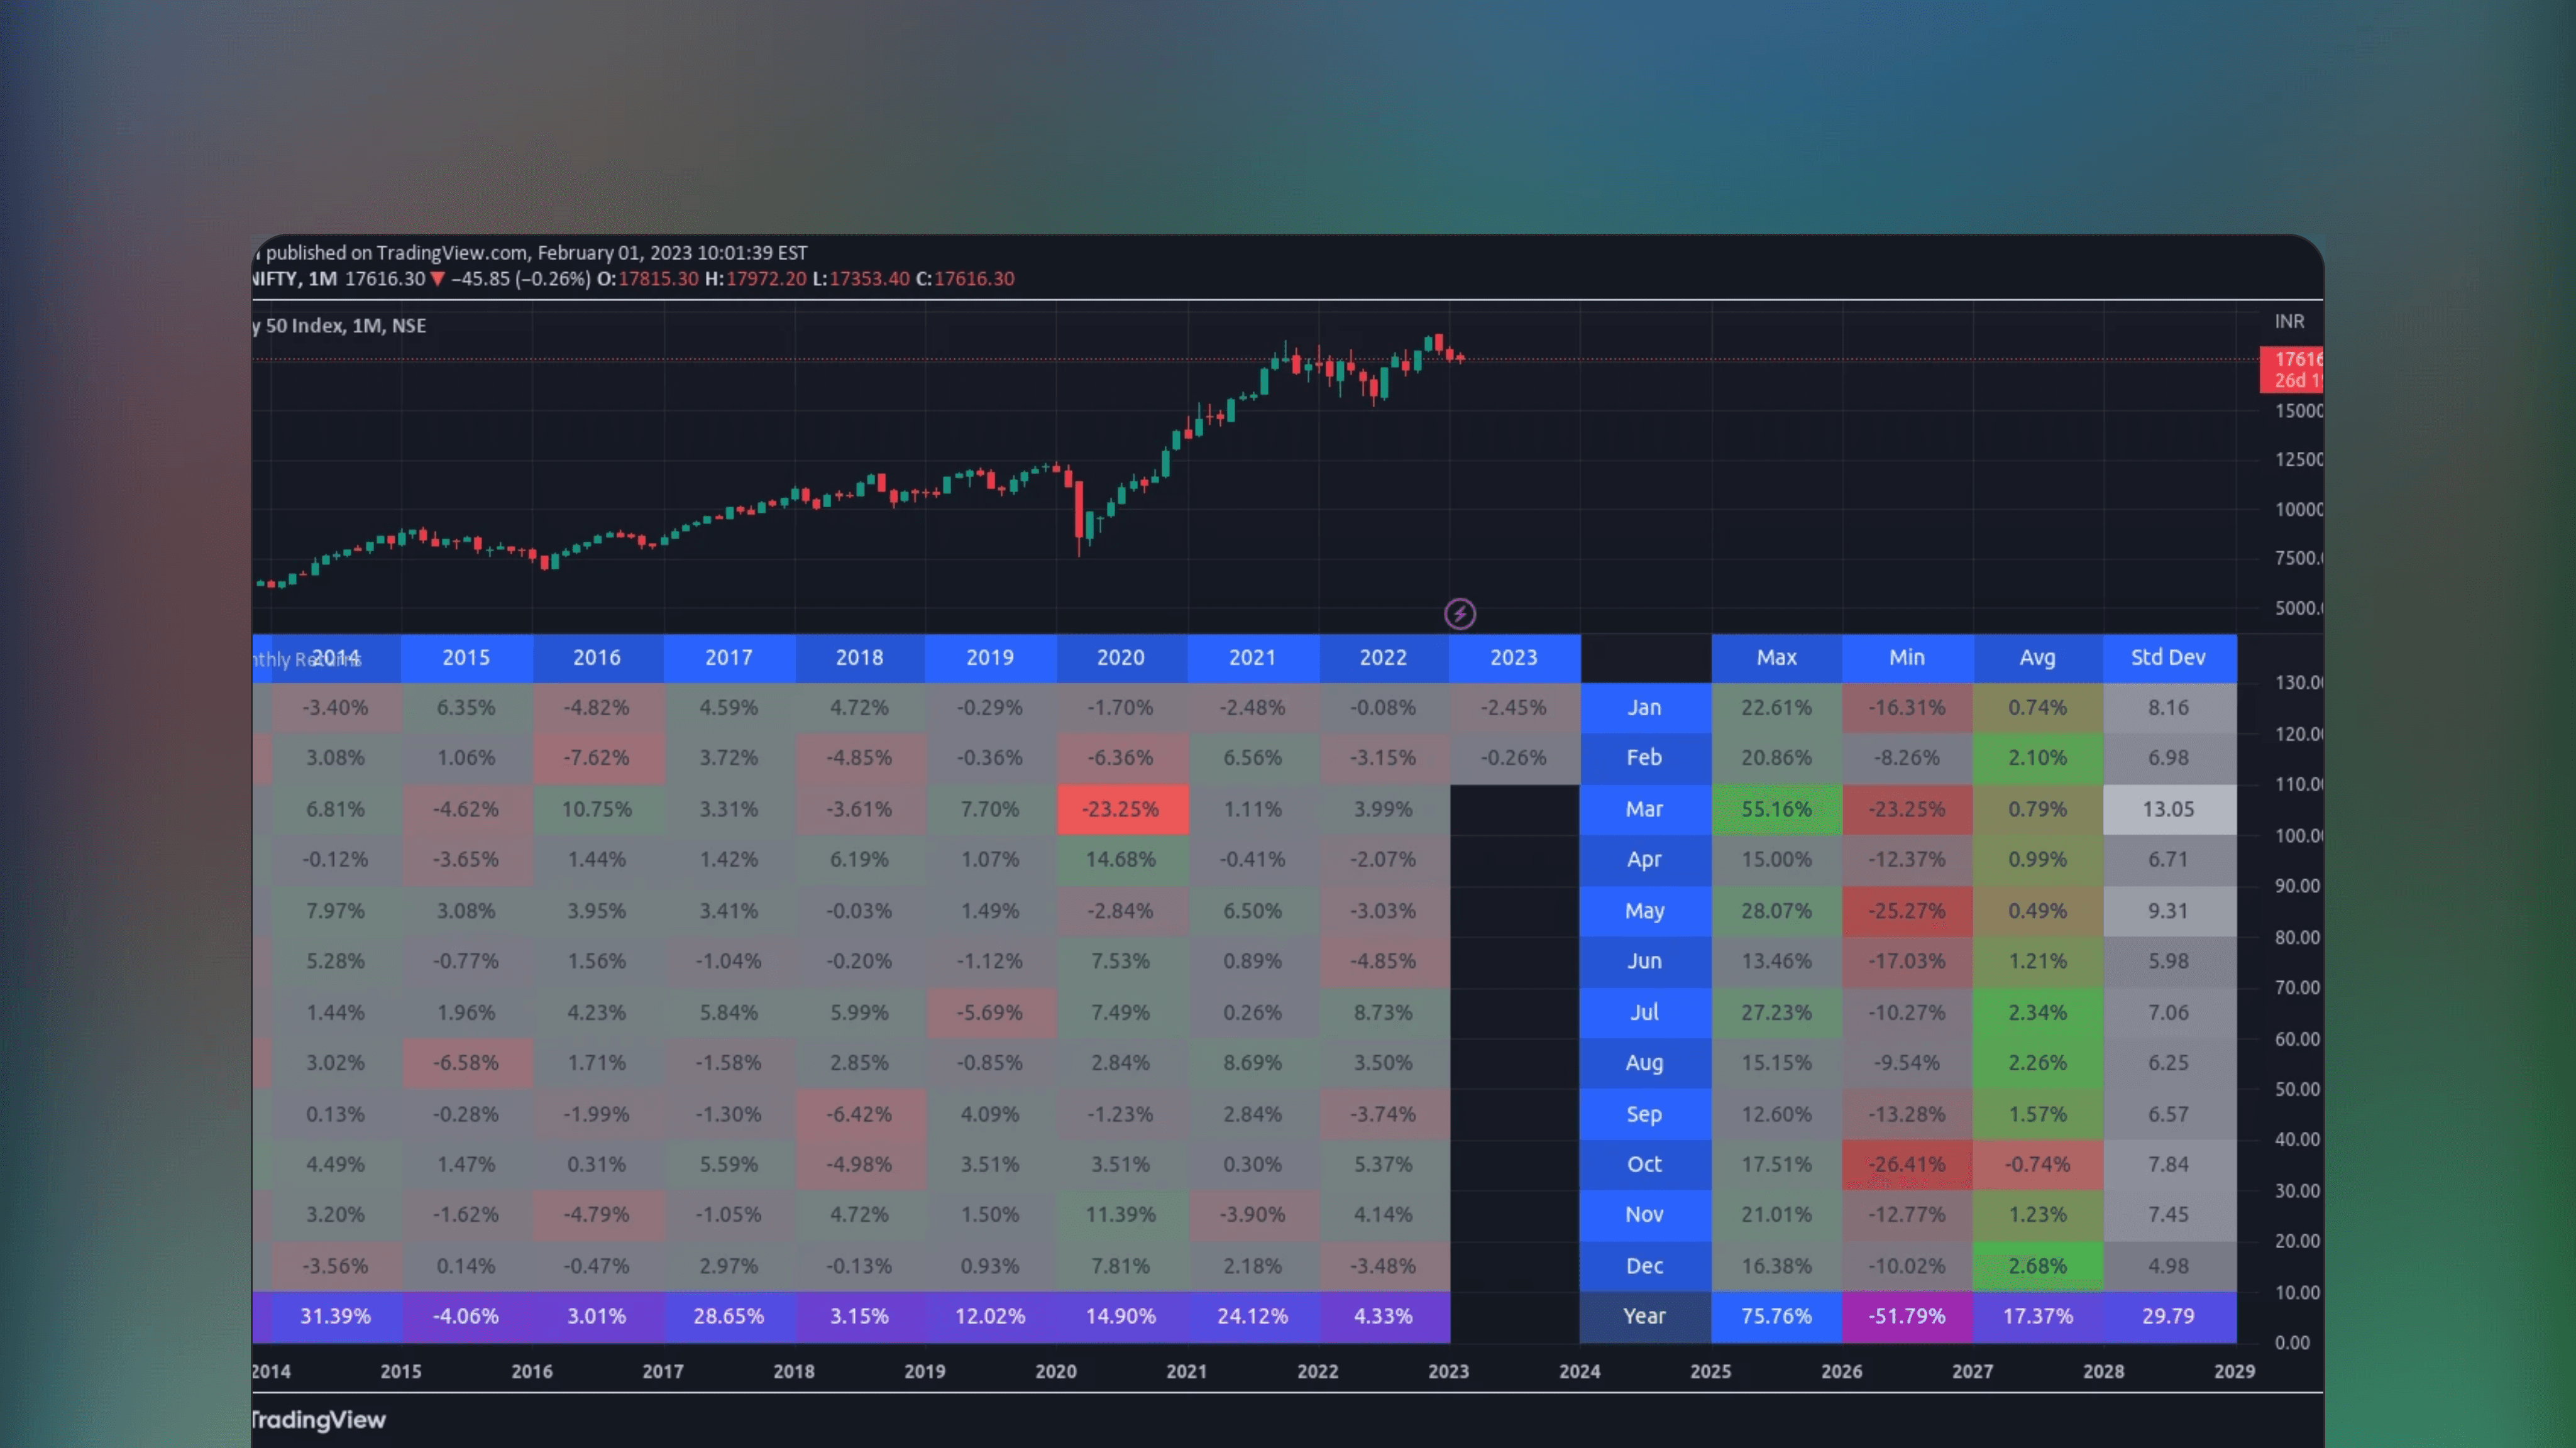
Monthly Returns
🔑
🌐
✅
🏅
Monthly Returns is a free TradingView indicator that displays monthly and yearly investment returns in a table, including maximum, minimum and average returns as well as standard deviations, providing a statistical summary of performance.
Load More
🤖
by iravan
Free
TradingView Indicator
Equity Bond Currency Dashboard
🔑
🌐
✅
Equity Bond Currency Dashboard is a TradingView Indicator that visualizes demand-flow between equities, bonds and currencies across six countries, allowing track of institutional money flows and visuals for interconnected market dynamics.
🤖
by iravan
Free
TradingView Indicator
Top 40 constituents of S&P 500 Index
🔑
🌐
✅
Top 40 constituents of S&P 500 Index is a free TradingView Indicator presenting real-time candle data for the top 40 S&P 500 stocks side-by-side, highlighting broad market breadth and depth in a given time frame.
Load More
🔥
New Listings
Featured this week

🤖
by allanster

Free
TradingView Indicator
Growing or Waning Patterns [Alerts]
New
🔑
🌐
Growing or Waning Patterns [Alerts] is a TradingView indicator that detects reversal signals based on three candle body patterns. The patterns are classified as increasing or decreasing depending on bullish and bearish states. Additional features include alerts and trend filter.

📟
Free*
Trade Analytics Platform
TRDR.IO
New
🌐
✅
🏅
TRDR.IO is a crypto orderflow platform providing various tools visualizing crypto exchange order book activity. See bid-ask imbalances, buy and sell demand as well as order book depth in real-time with intuitive visual overlays. Additional features include alerts and scanning crypto markets for orderflow events.

🤖
by LeviathanCapital
Free
TradingView Indicator
Swing Levels and Liquidity - By Leviathan
New
🔑
🌐
✅
Swing Levels and Liquidity is a TradingView Indicator that displays swing high and low levels with volume traded at the pivots. Once formed, these levels likely retain liquidity that traders can expect to produce support and resistance in price when swept.
🤖
by allanster
Free
TradingView Indicator
Growing or Waning Patterns [Alerts]
New
🔑
🌐
Growing or Waning Patterns [Alerts] is a TradingView indicator that detects reversal signals based on three candle body patterns. The patterns are classified as increasing or decreasing depending on bullish and bearish states. Additional features include alerts and trend filter.
📟
Free*
Trade Analytics Platform
TRDR.IO
New
🌐
✅
🏅
TRDR.IO is a crypto orderflow platform providing various tools visualizing crypto exchange order book activity. See bid-ask imbalances, buy and sell demand as well as order book depth in real-time with intuitive visual overlays. Additional features include alerts and scanning crypto markets for orderflow events.
Load More
🤖
Similar Listings
Traders also viewed
All

🤖
by LeviathanCapital
Free
TradingView Indicator
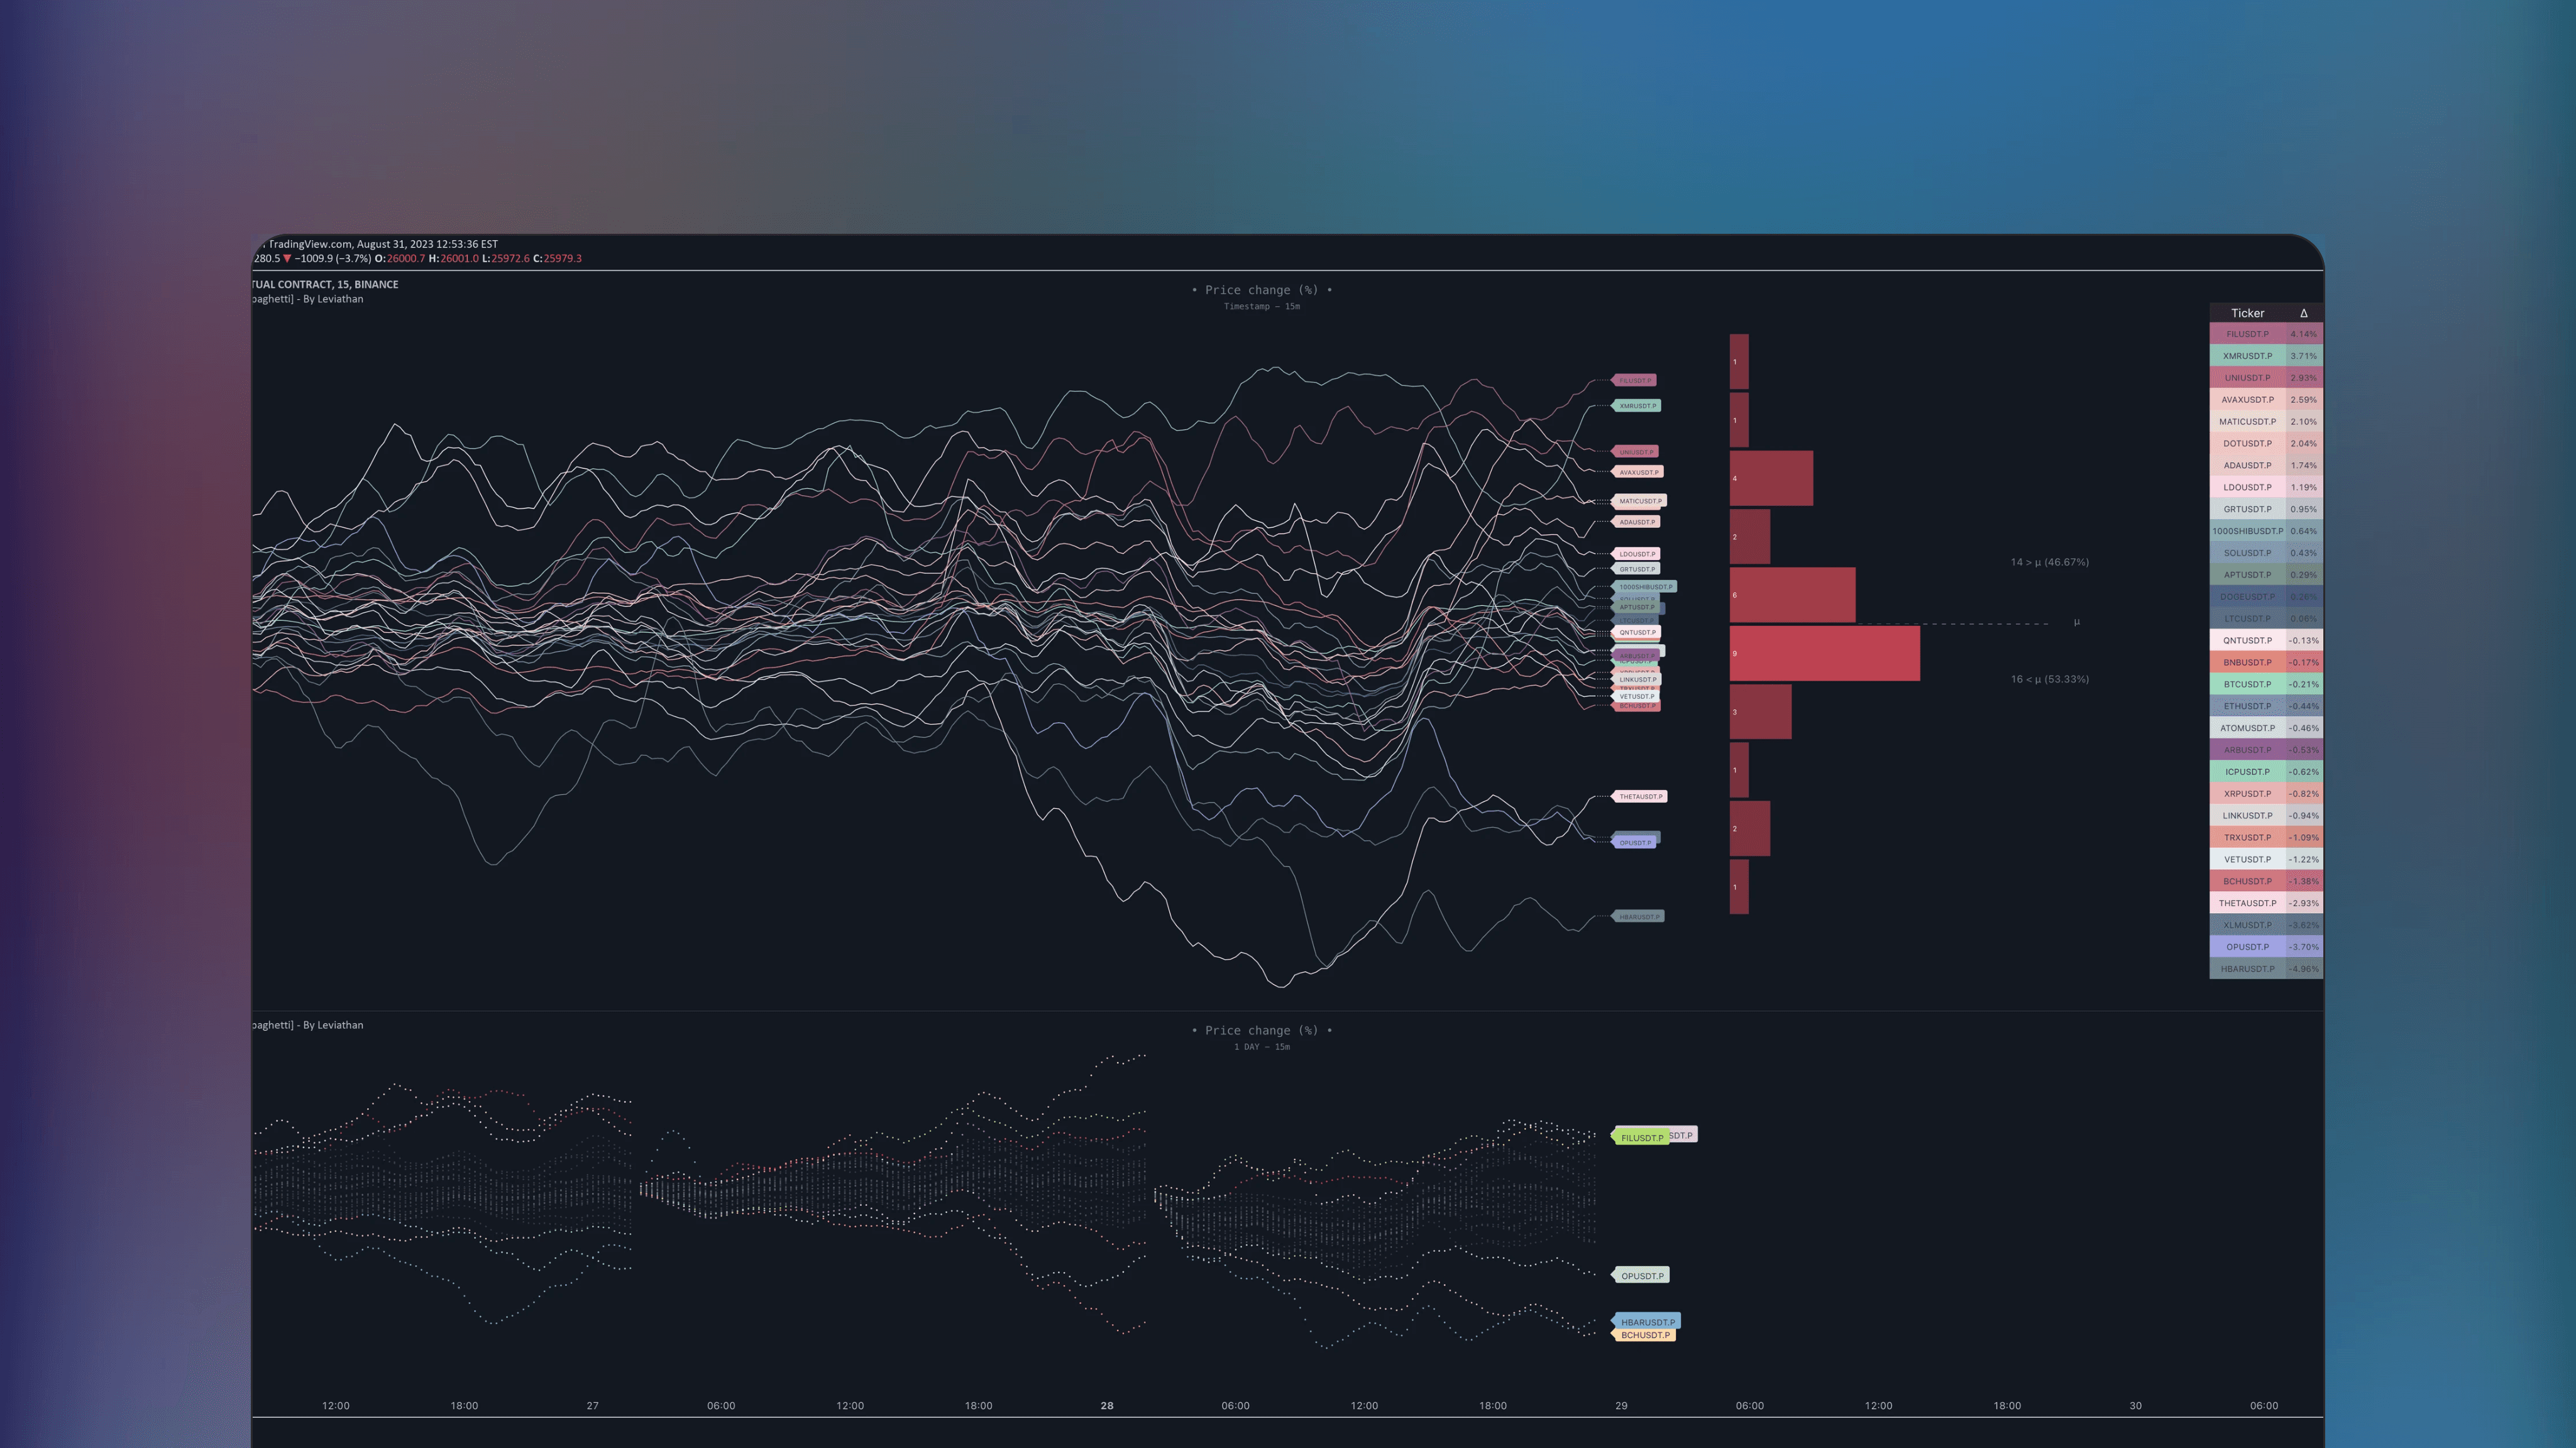
Multi-Asset Performance [Spaghetti] - By Leviathan
🔑
✅
🏅
Multi-Asset Performance [Spaghetti] by Leviathan is a TradingView Indicator that visualizes cumulative percentage changes of up to 30 assets over a specified period, providing tools and analytics for analyzing outperforming assets and rotations.
🤖
by LeviathanCapital
Free
TradingView Indicator
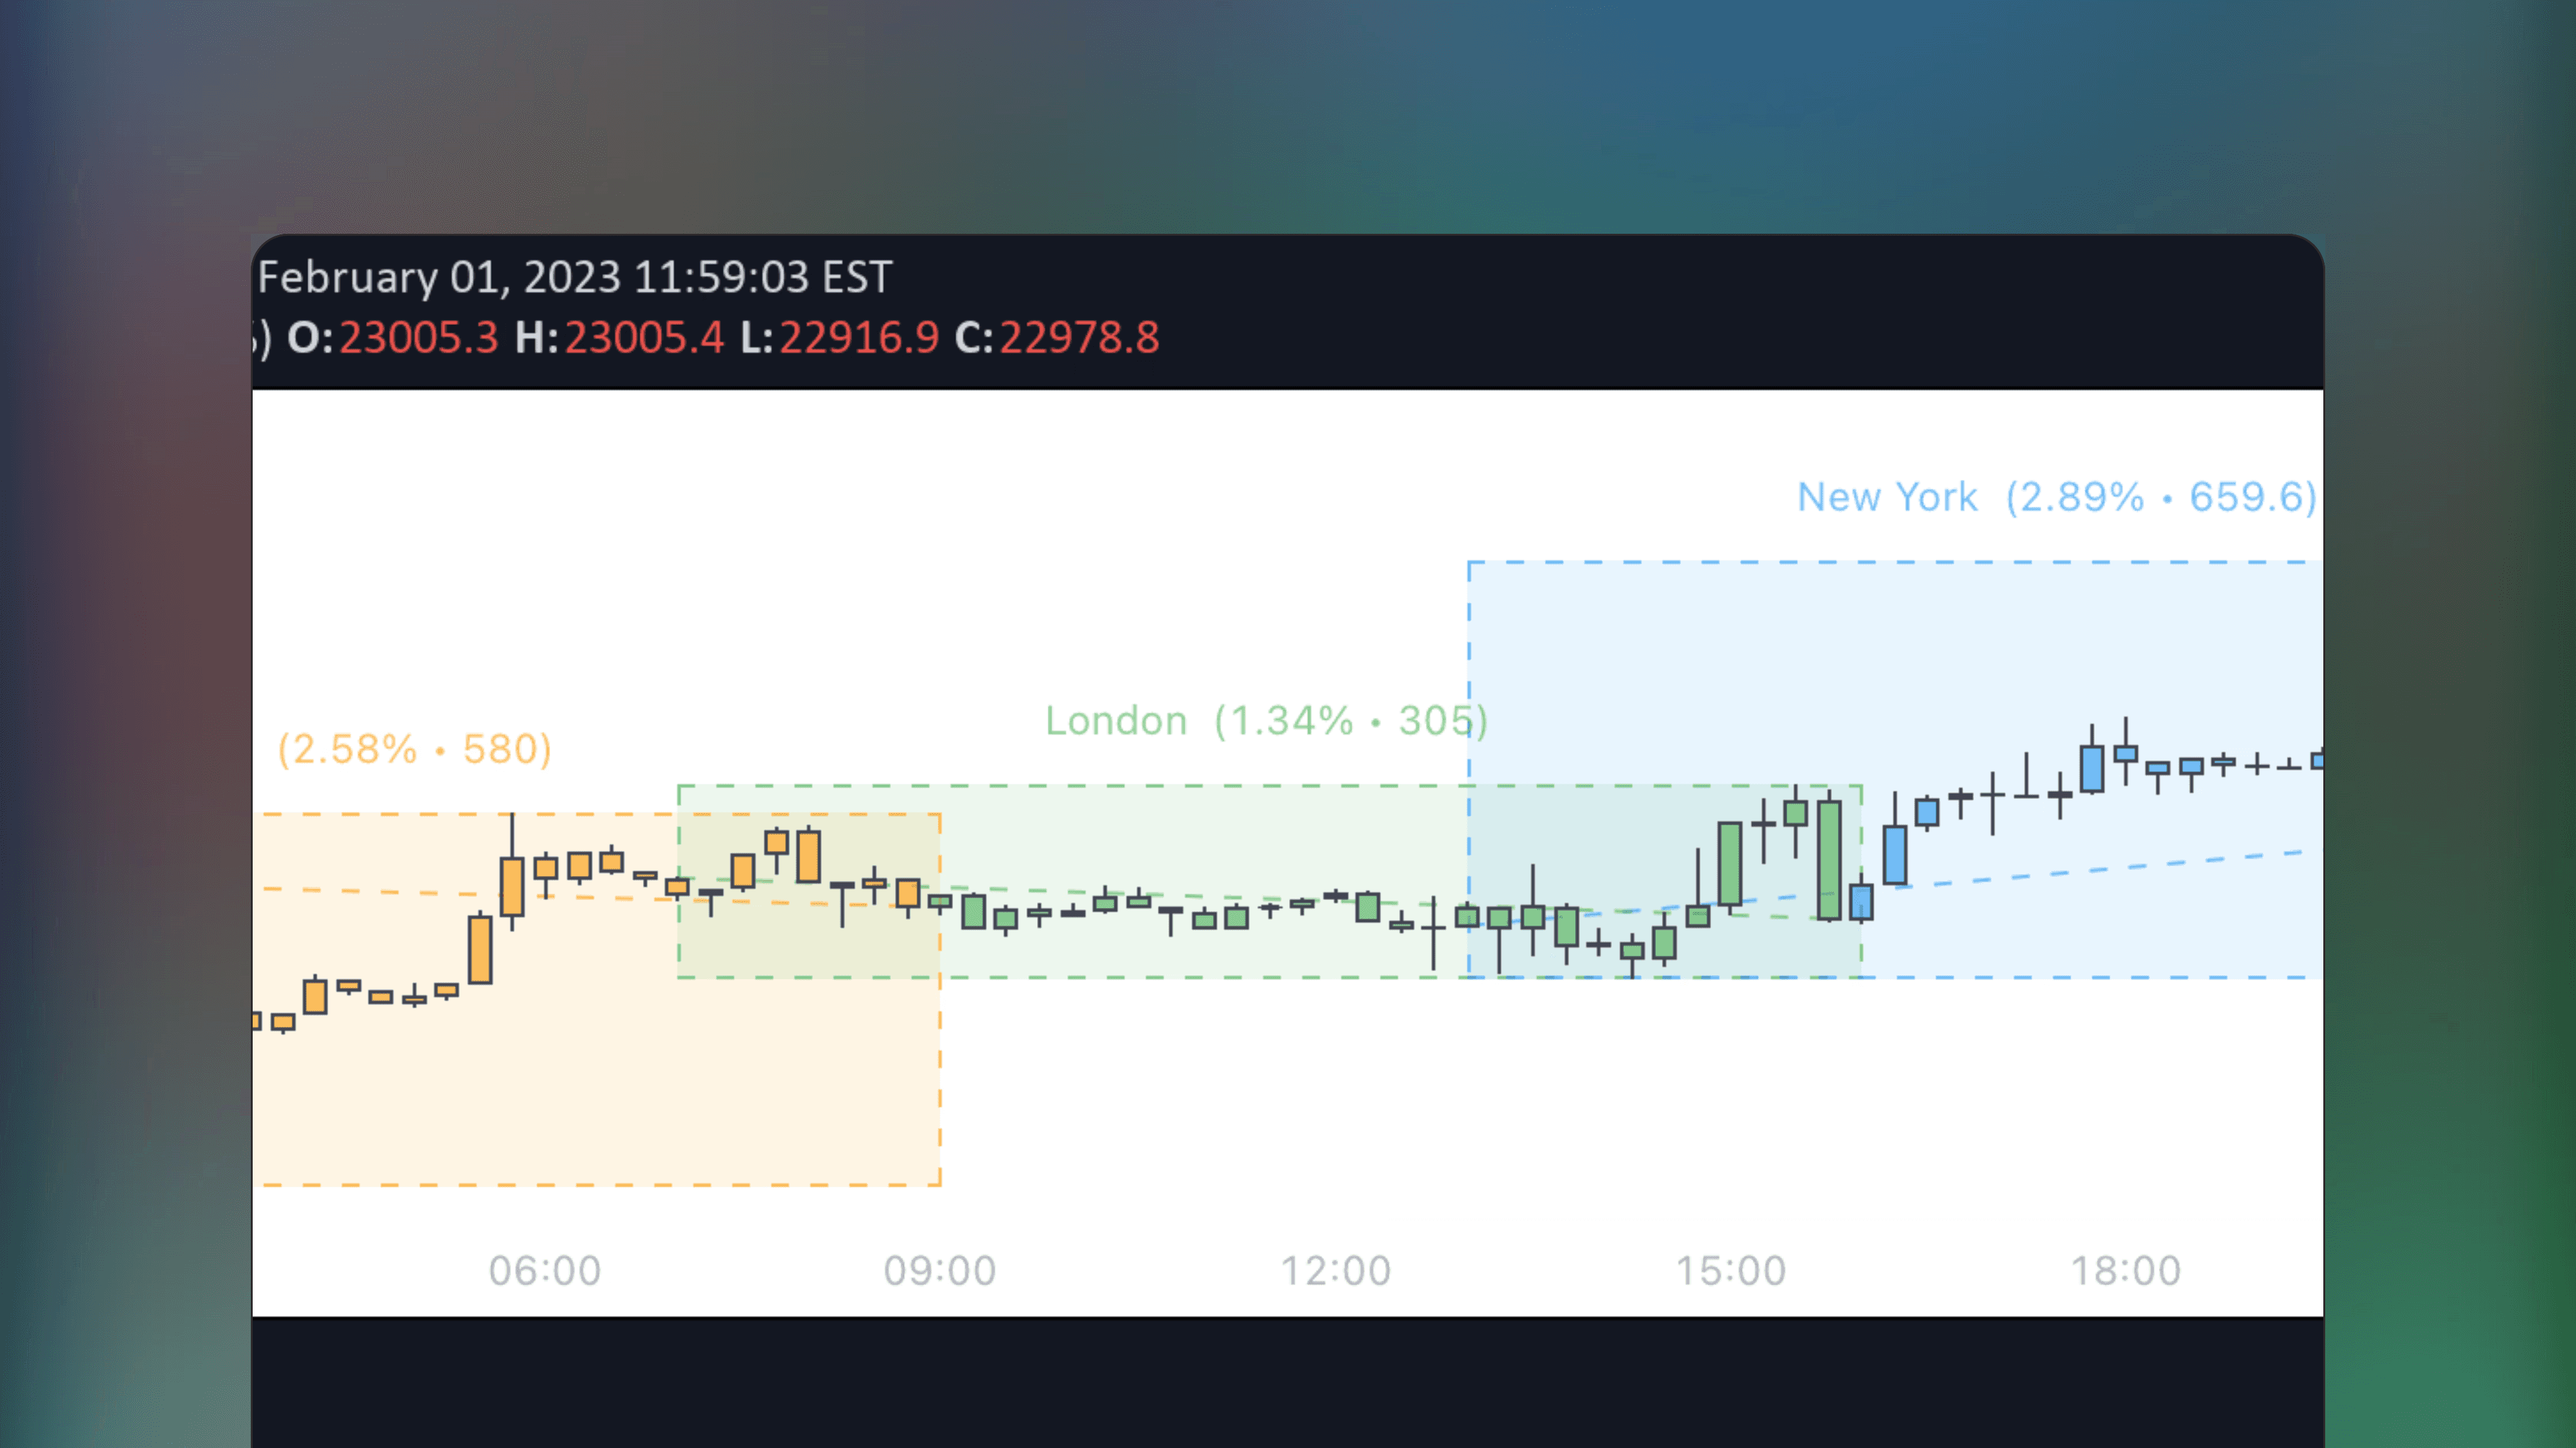
Market Sessions - By Leviathan
🔑
🌐
✅
🏅
Market Sessions – By Leviathan is a TradingView indicator that visualizes the Tokyo, London, New York, and Sydney sessions using discreet boxes and colored candles, along with additional tools for tracking crucial market sessions.
🤖
by LeviathanCapital
Free
TradingView Indicator
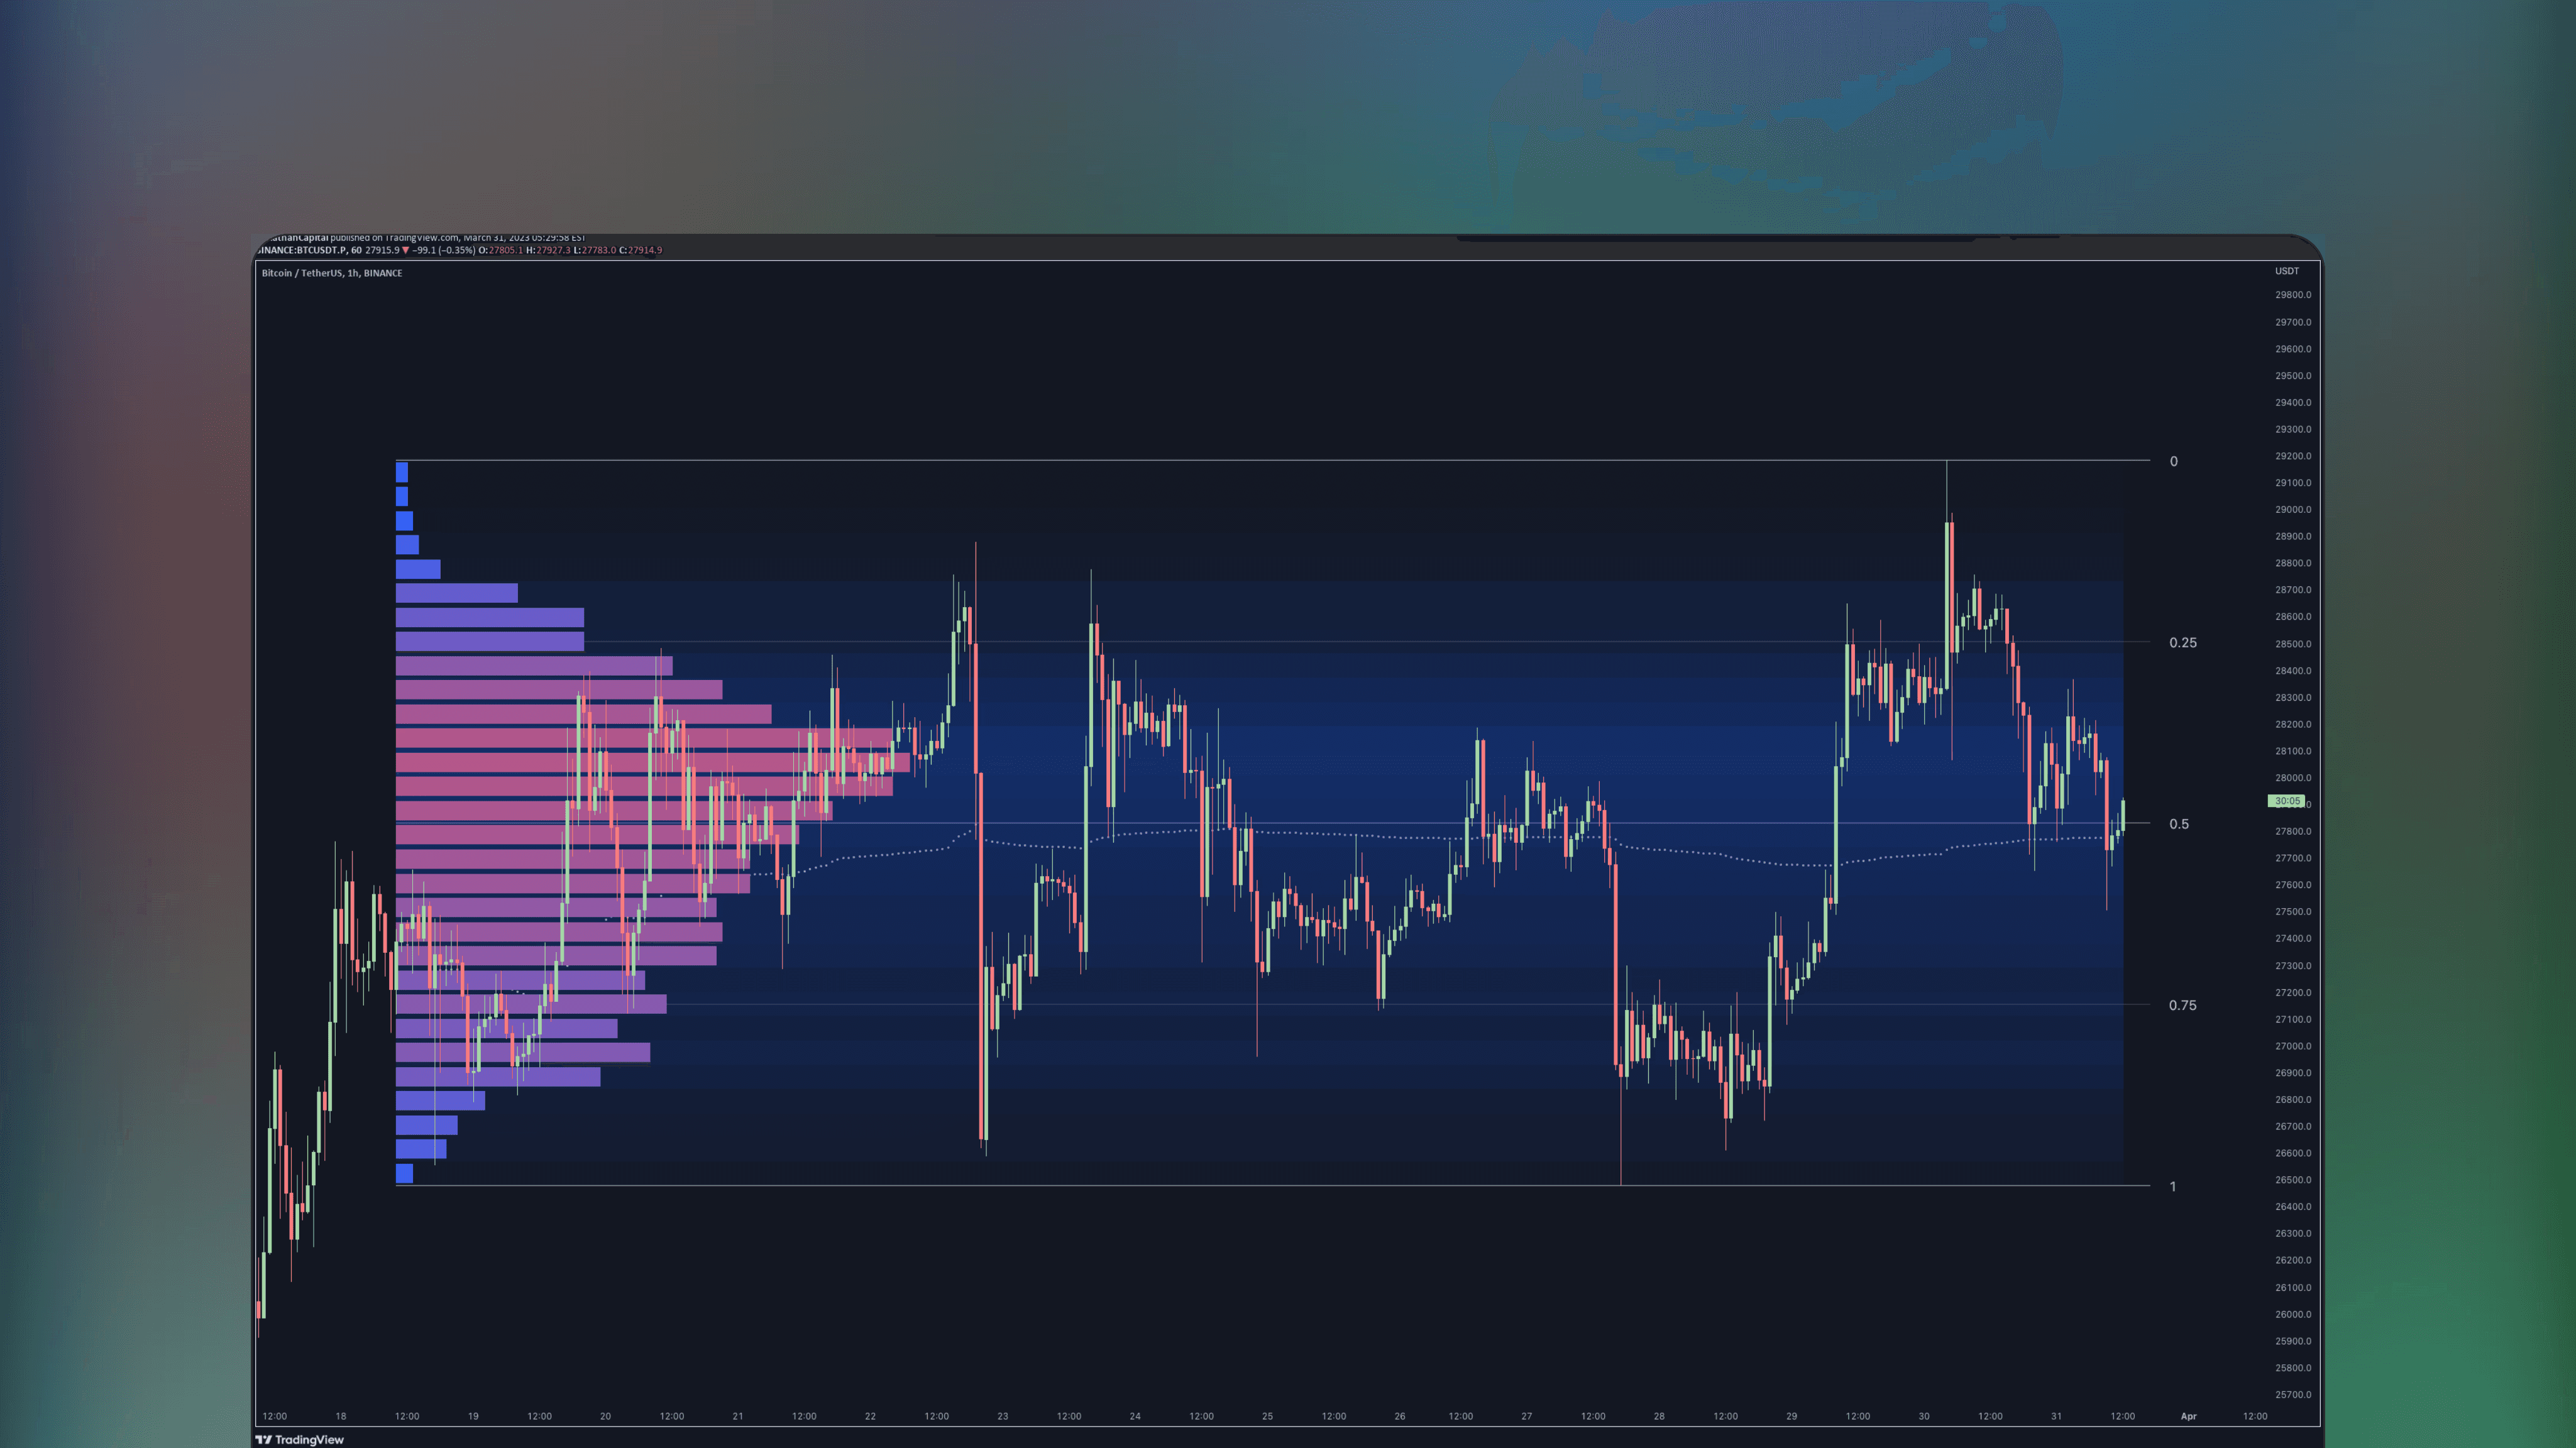
Range Analysis - By Leviathan
🔑
🌐
✅
🏅
Range Analysis - By Leviathan is a free TradingView indicator that automates price range analysis by identifying key support and resistance levels. Draw range levels, generate Volume or Open Interest profiles, display heatmaps, plot anchored VWAP and Fibonacci retracement levels, automatically.

🤖
by sbtnc
Free
TradingView Indicator
Tops & Bottoms - Day of Week Report
🔑
✅
Tops & Bottoms - Day of Week Report is a TradingView indicator that analyzes likelihood of weekly price bottoms and tops for each day of the week. The statistical likelihood of a weekly bottom/top is visualized using a data table, showing how many occurences were found throughout the chart.
🤖
by KioseffTrading
Free
TradingView Indicator
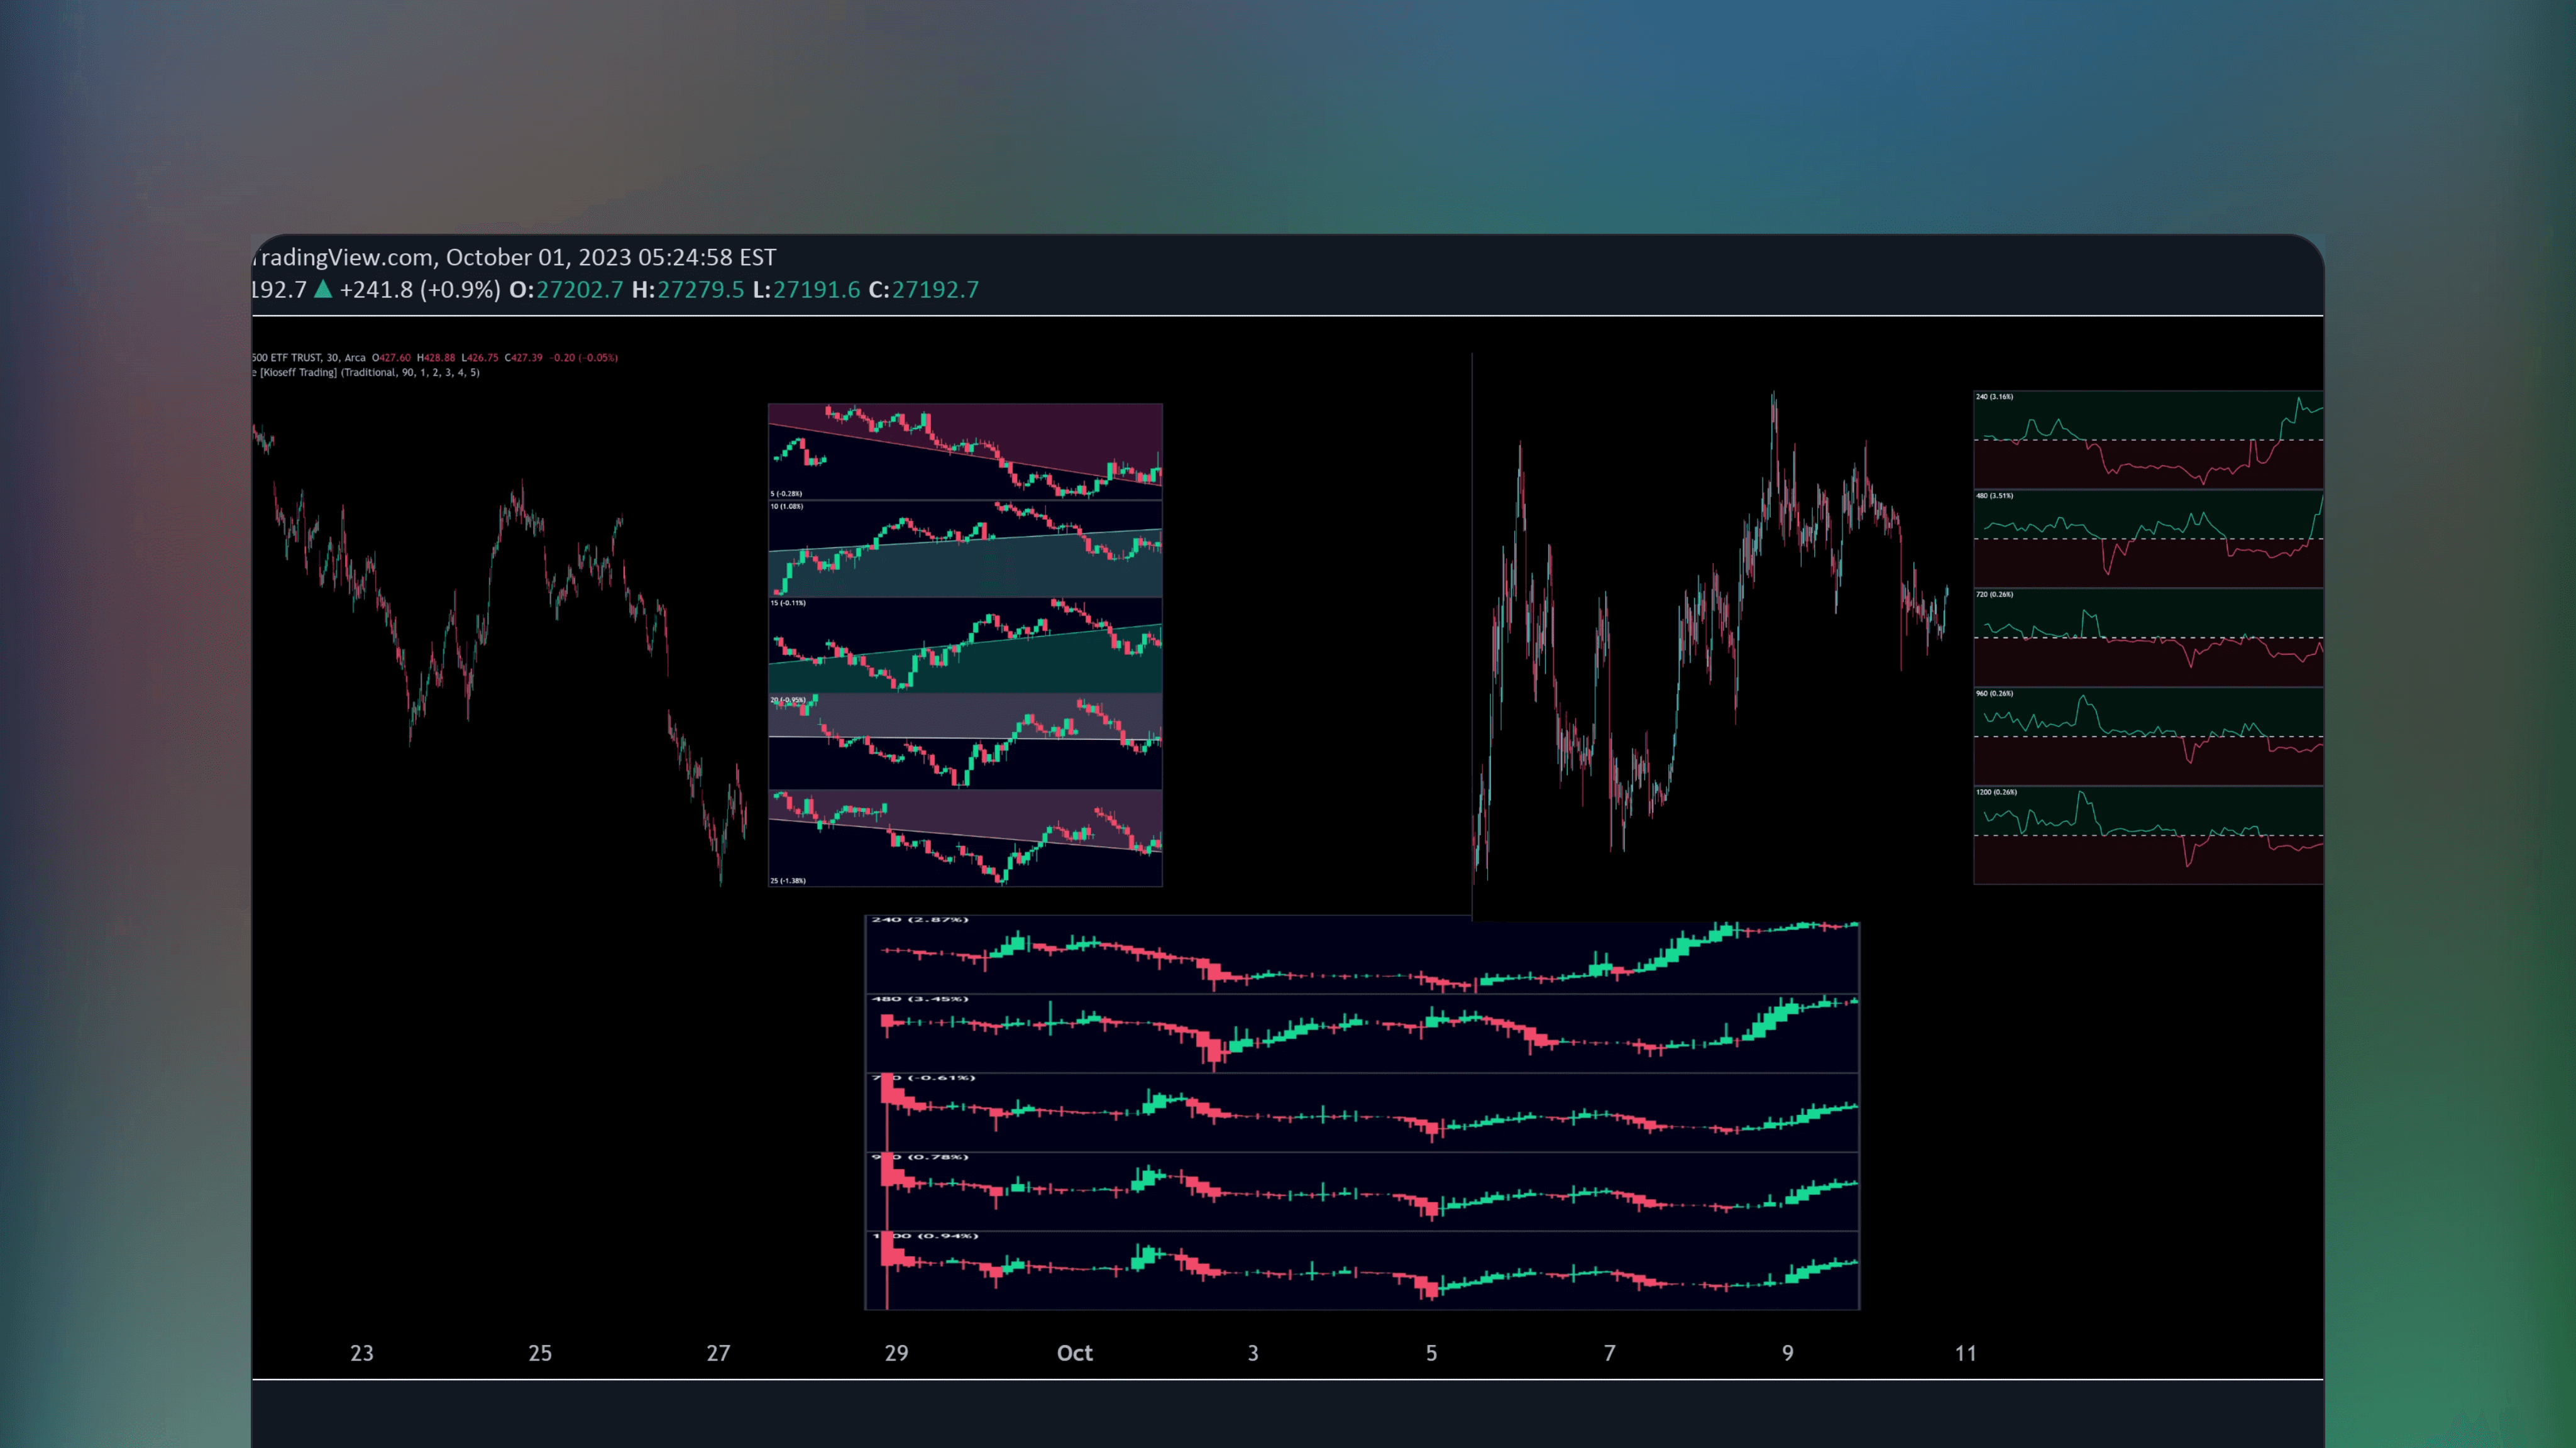
Sync Frame (MTF Charts) [Kioseff Trading]
🔑
🌐
🏅
Sync Frame (MTF Charts) [Kioseff Trading] is a free TradingView indicator that allows users to view multiple lower timeframe charts for any asset simultaneously, in various formats, on a single screen.
🤖
by LeviathanCapital
Free
TradingView Indicator
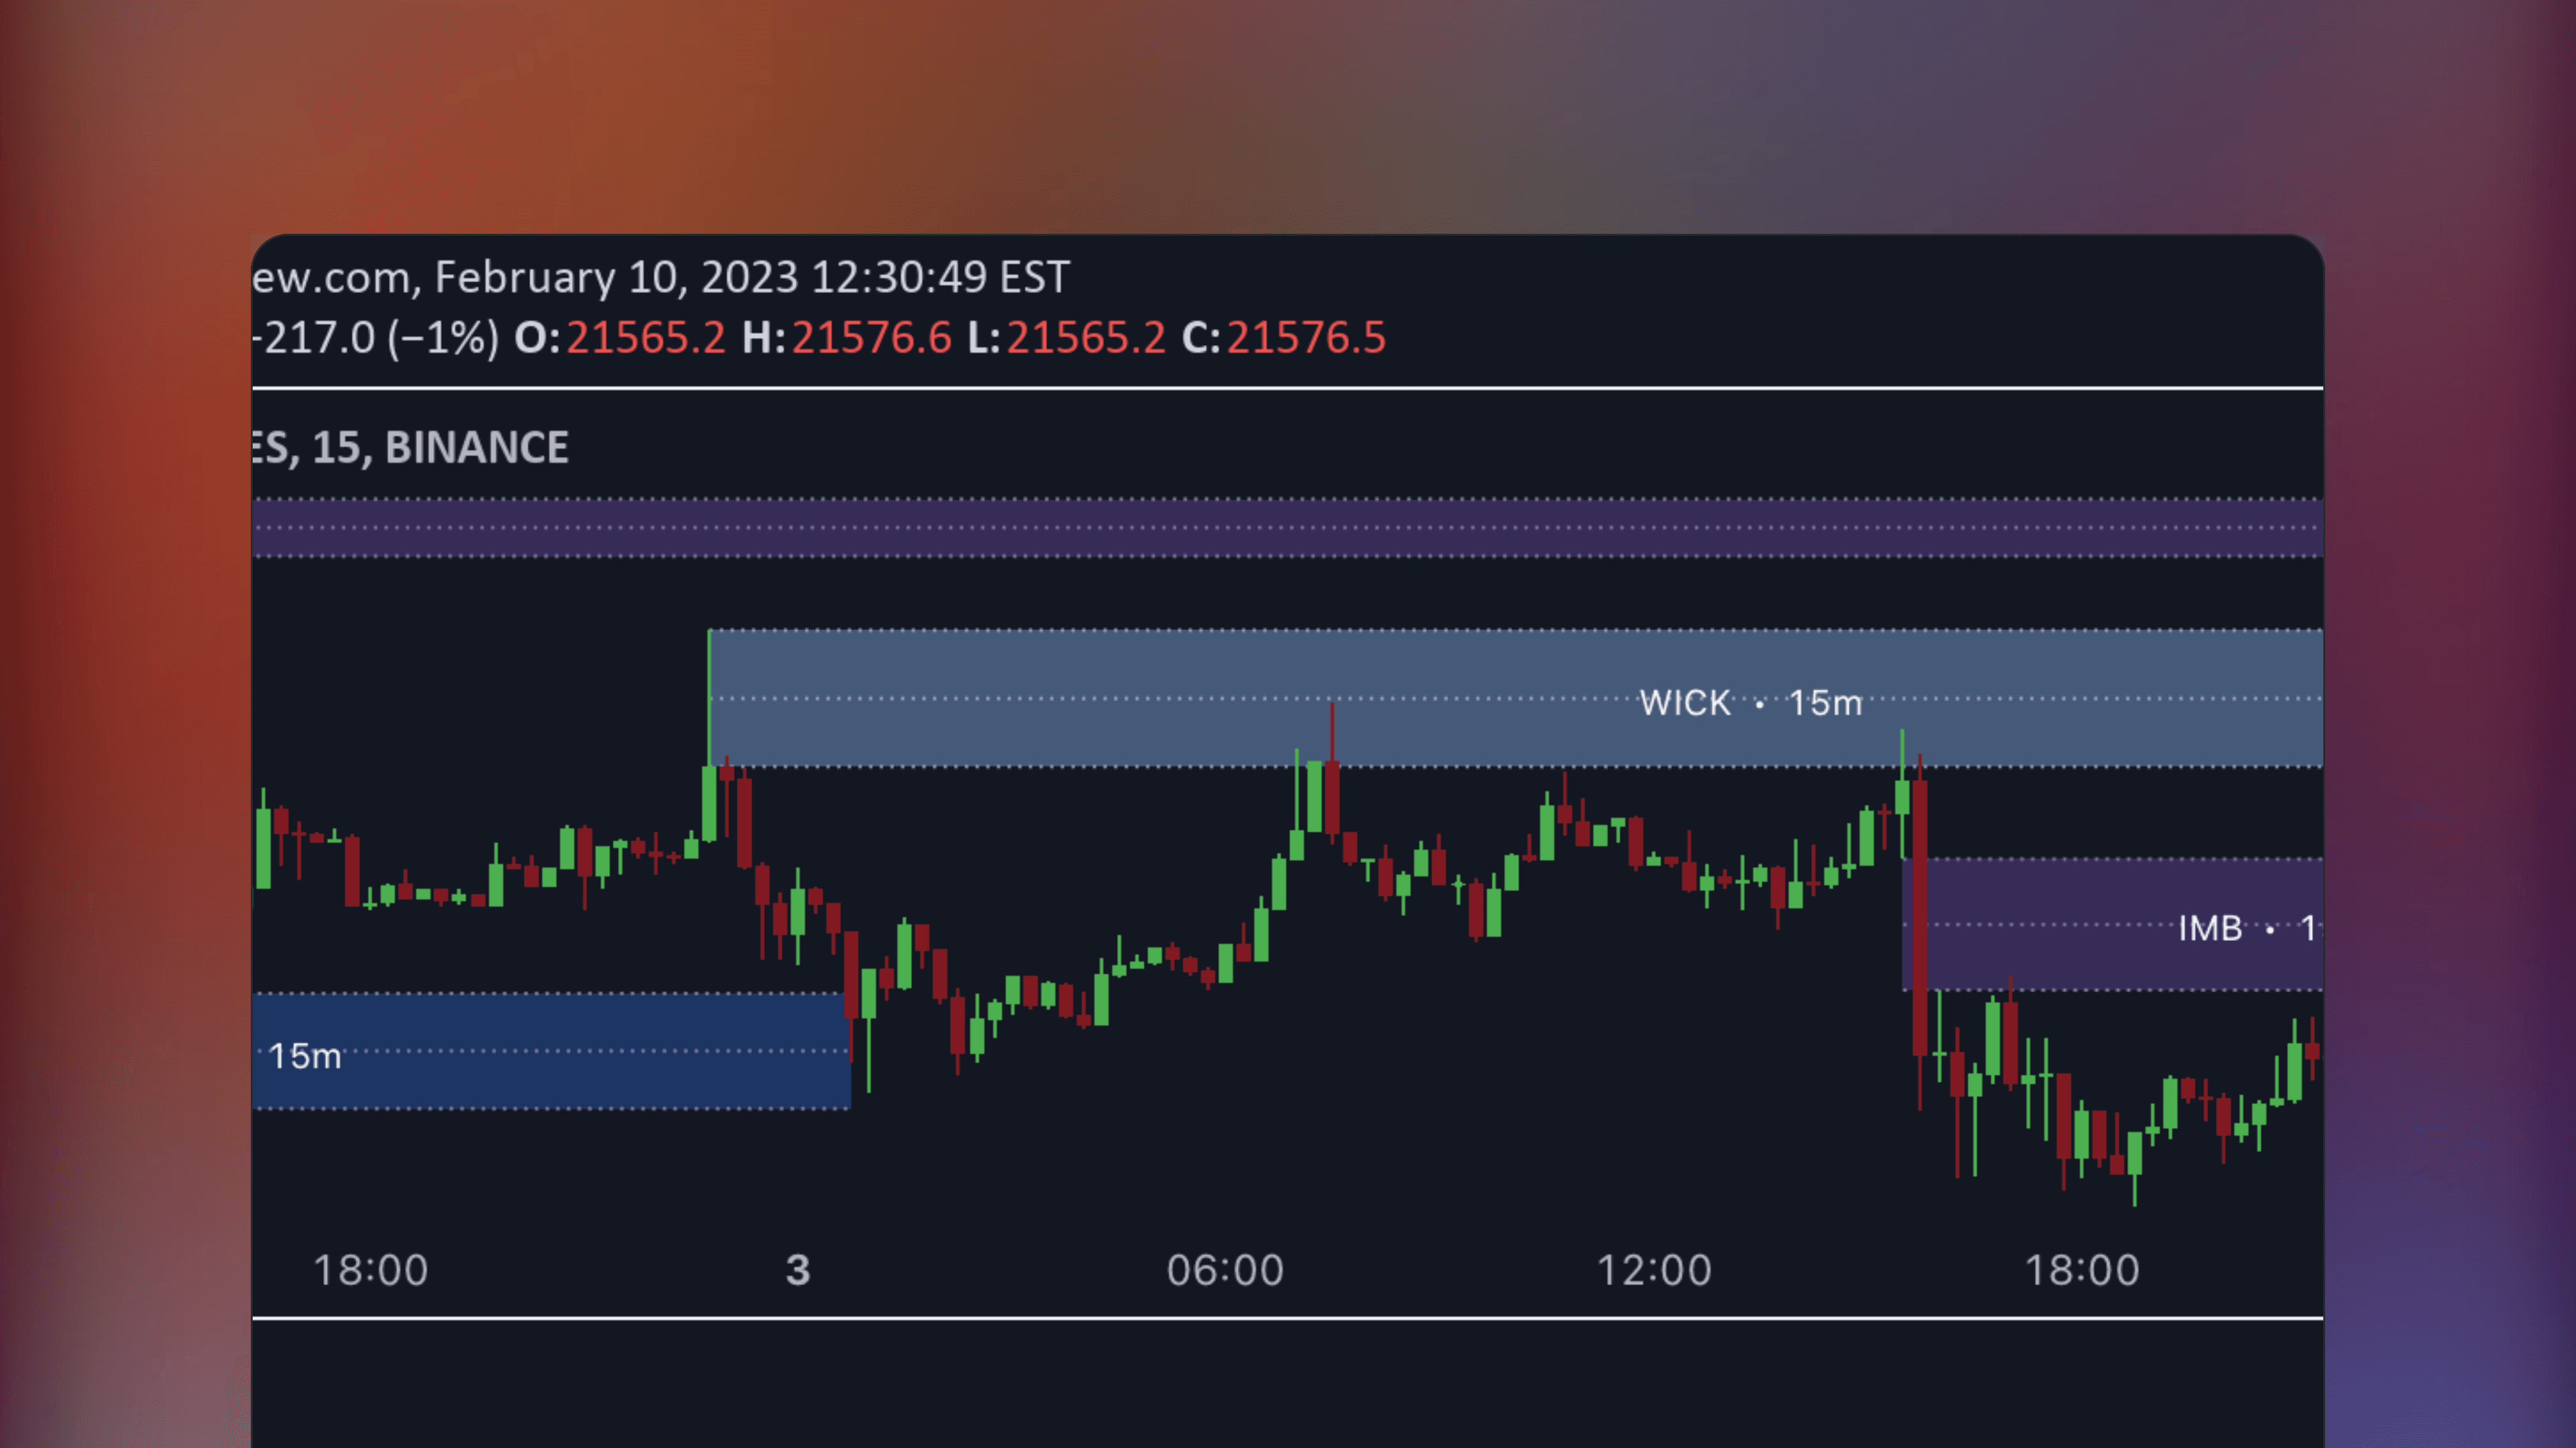
Gaps + Imbalances + Wicks (MTF) - By Leviathan
🔑
🌐
✅
Gaps + Imbalances + Wicks (MTF) by Leviathan detects and displays price gaps in various forms - imbalances, gaps and inefficient wicks. This TradingView Indicator features customizable fill conditions, zone size filtering, volume comparison, lookback filtering and customizable visuals.

🤖
by KioseffTrading
Free
TradingView Indicator
Intrabar Analyzer [Kioseff Trading]
🔑
🌐
Intrabar Analyzer [Kioseff Trading] is a TradingView indicator that presents intrabar data in various formats to analyze price action within main timeframe candles. This Indicator features advanced features like volume analysis, technical ratings, linear regression and exotic candle types such as Kagi for lower timeframe price action.
🤖
by MXWLL-Capital-Trading
Free
TradingView Indicator
Mxwll Price Action Suite [Mxwll]
🔑
🌐
✅
🏅
Mxwll Price Action Suite is a TradingView indicator that combines multiple ICT and Smart Money Concepts with unique methodologies into an all-in-one price action toolkit.
![TradingView chart interface displaying the TTrades Daily Bias [TFO] indicator overlay on price action data showing previous daily highs and lows to determine market direction along with a statistics panel tracking historical success rates and bias accuracy](https://framerusercontent.com/images/1GkYDfLd6QVIEQQCJvYRBnnH3I.png?width=4098&height=2304)
🤖
by tradeforopp
Free
TradingView Indicator
TTrades Daily Bias [TFO]
🔑
🌐
TTrades Daily Bias [TFO] is a TradingView indicator that determines market bias by analyzing previous highs and lows on daily and weekly timeframes, tracking success rates based on successful follow-through in price action.
🤖
by sbtnc
Free
TradingView Indicator
Time of Day - Volatility Report
🔑
🌐
✅
Time of Day - Volatility Report is a TradingView indicator that analyzes market volatility at time by providing statistics on average hourly market fluctuations.

🤖
by LeviathanCapital
Free
TradingView Indicator
Market Structure - By Leviathan
🔑
🌐
✅
Market Structure - By Leviathan is a free TradingView indicator that identifies market structure, break of structure (BOS) and change of character (ChoCH) using price swing levels. Users can additionally visualize 0.5 retracement levels between swing highs and lows.

🤖
by LeviathanCapital
Free
TradingView Indicator
Liquidation Levels - By Leviathan
🔑
🌐
Liquidation Levels by Leviathan is a free TradingView indicator that identifies liquidation levels by analyzing open interest and volume data. The indicator picks up large influx of new positions opening and visualizes where over-leveraged traders may be liquidated.
![TradingView price chart displaying the ICT Killzones + Pivots [TFO] indicator with highlighted trading zones for London and New York sessions. Horizontal lines track the high and low price levels for each session.](https://framerusercontent.com/images/Fp1gsvC8U6j1H5bCfAC3mscBFbM.png?width=4098&height=2304)
🤖
by tradeforopp
Free
TradingView Indicator
ICT Killzones + Pivots [TFO]
🔑
🌐
ICT Killzones + Pivots [TFO] is a TradingView indicator that highlights and monitors trading session highs and lows, coined as kill zones by ICT traders.
🤖
by anche1991
Free
TradingView Indicator
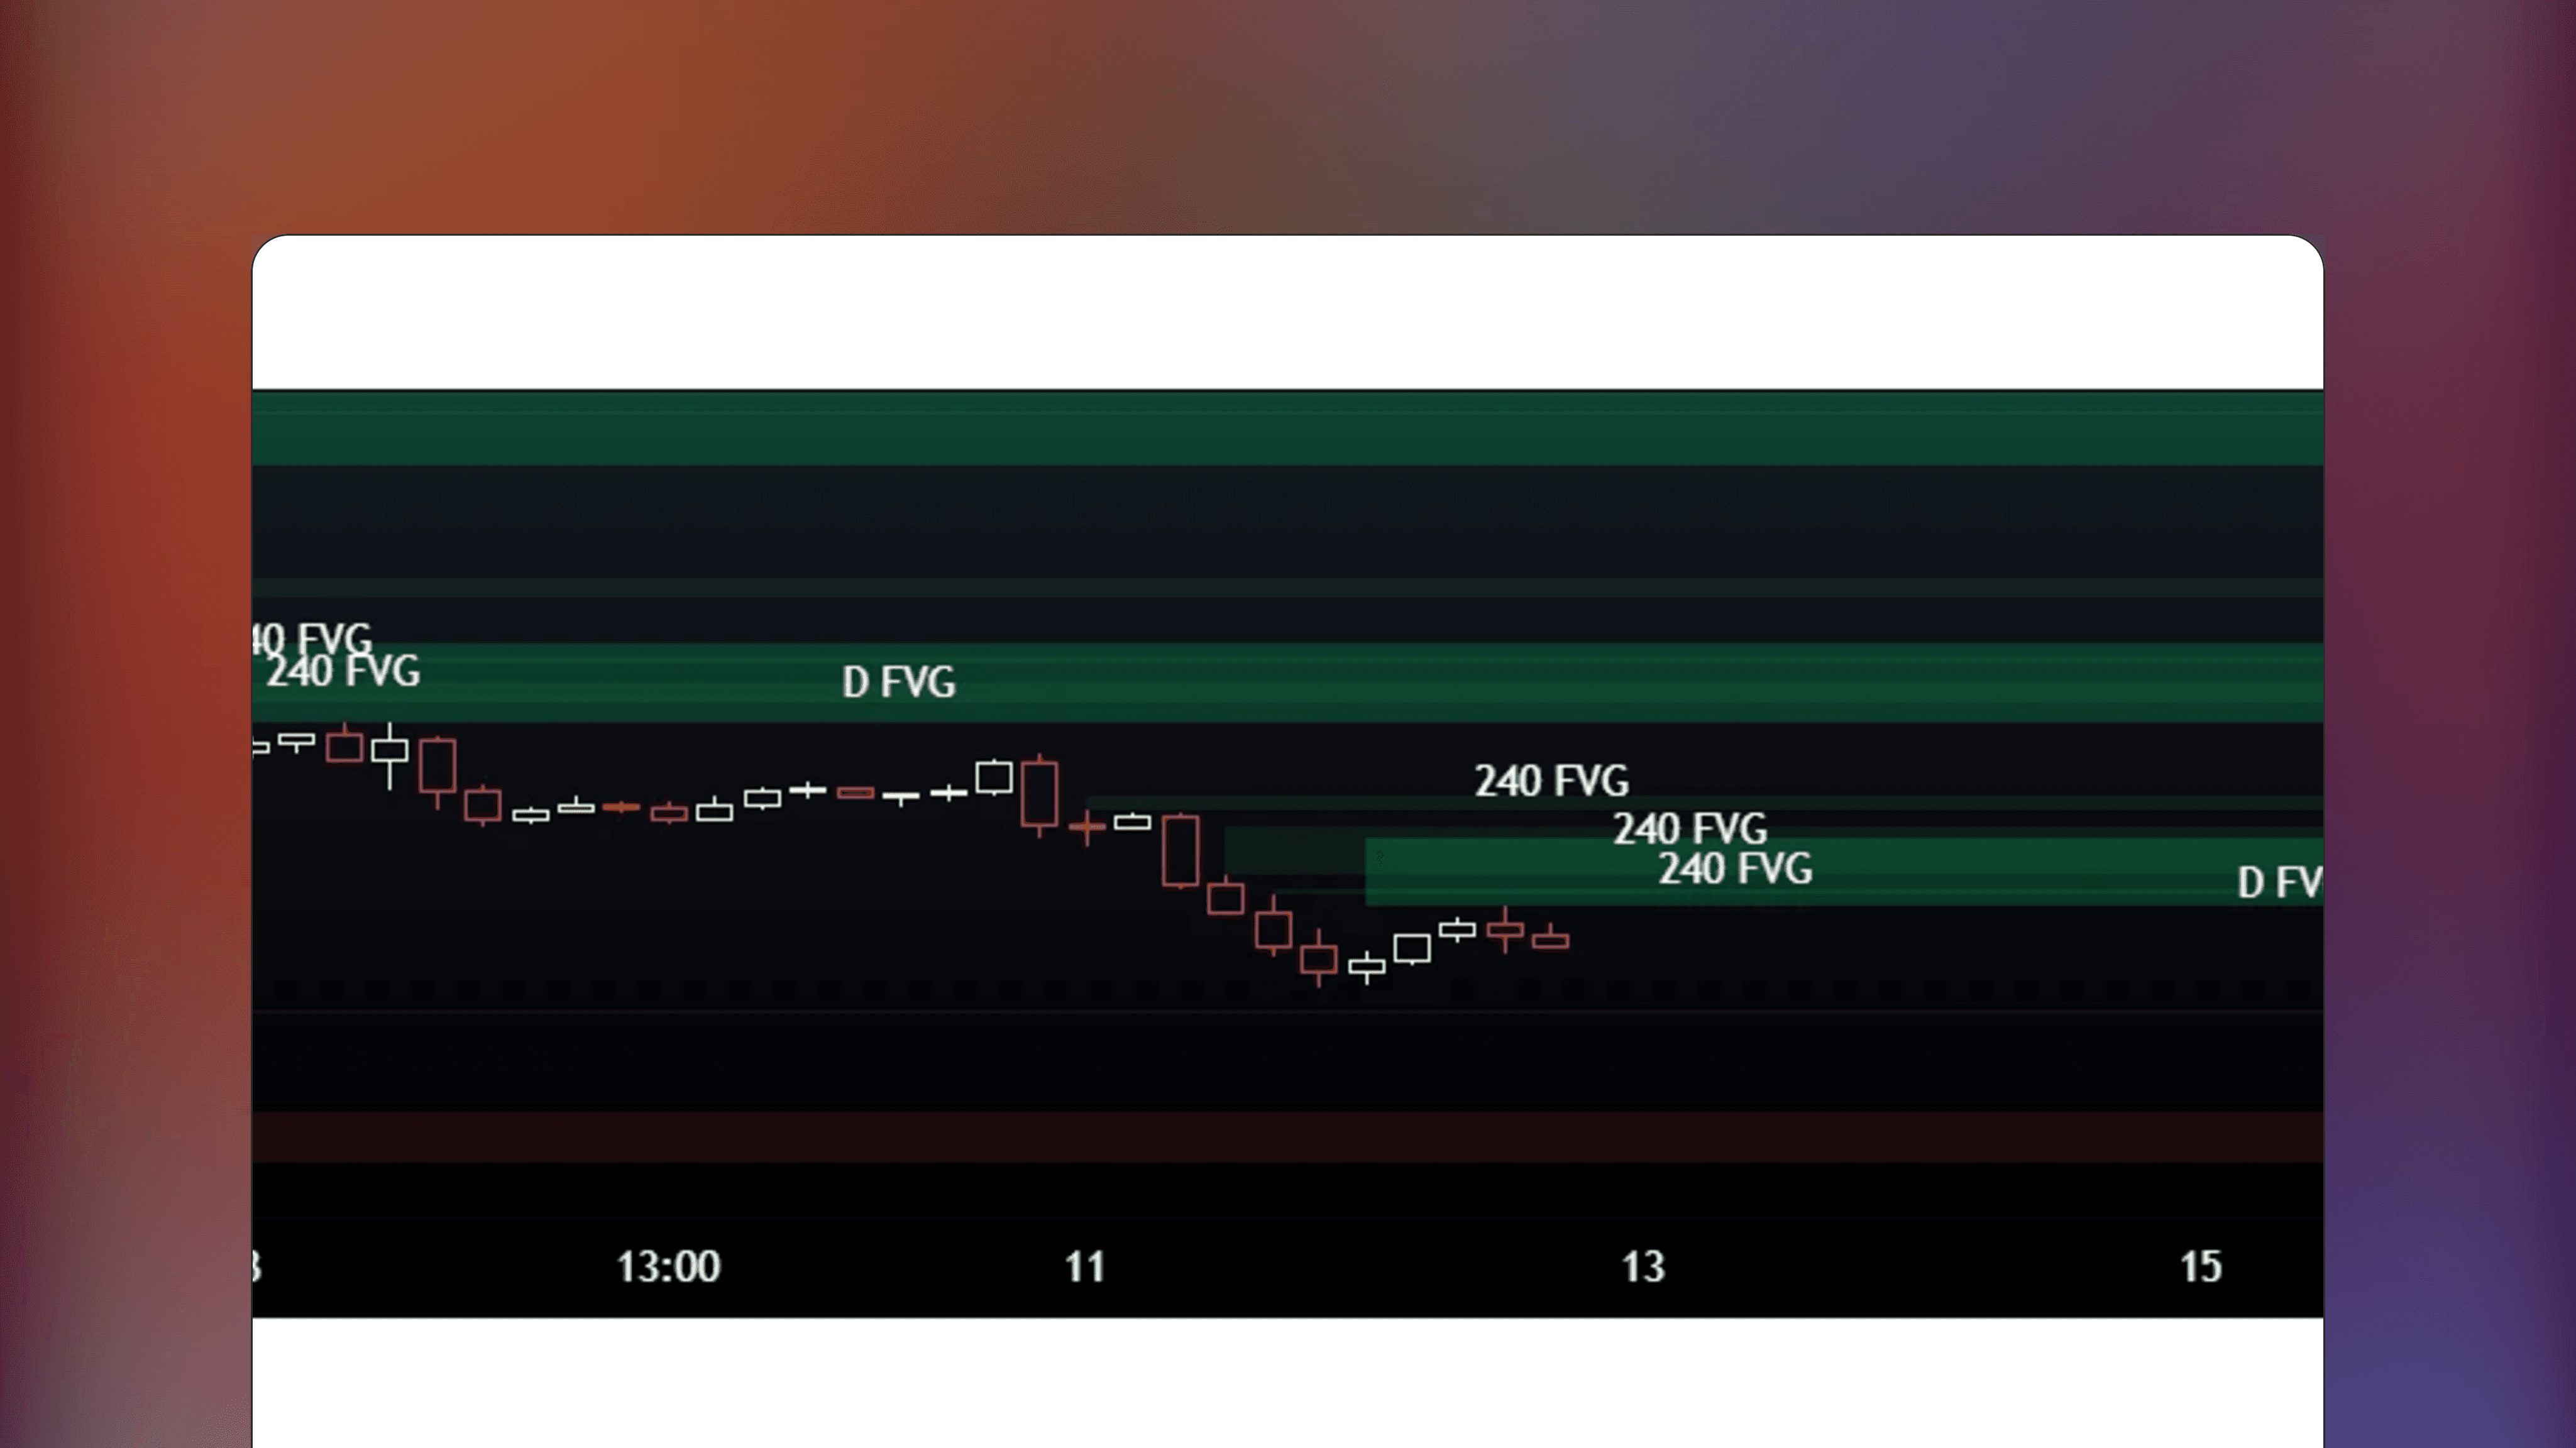
Fair Value Gap by Anche
🔑
🌐
✅
Fair Value Gap by Anche is a TradingView indicator that identifies and plots fair value gaps caused by significant order imbalances. The indicator highlights areas where price may later move to resolve the inefficiency.

🤖
by tradeforopp
Free
TradingView Indicator
HTF Liquidity Dashboard [TFO]
🔑
HTF Liquidity Dashboard [TFO] is a TradingView Indicator that scans multiple symbols exceeding their previous day, week or month highs/lows with a dashboard for tracking the activity. Additional features include customizable symbols for scanning and alerts.
🤖
by makuchaku
Free
TradingView Indicator
Makuchaku's trading tools - Liquidity visualizer
🔑
🏅
Makuchaku's Trading Tools – Liquidity visualizer is a TradingView indicator that plots untouched pivots and fractals not yet breached by price, highlighting highs and lows where stop orders or liquidity may reside.
🤖
by Texmoonbeam
Free
TradingView Indicator
Automatic Closest FVG with BPR
🔑
✅
Automatic Closest FVG with BPR is a TradingView indicator that automatically detects and draws the closest, most relevant fair value gap (FVG) that is yet to be filled. On top, this indicator has an option to detect unfilled balanced price ranges (BPR), a formation with two fair value gaps overlapping.
🤖
by spacemanbtc
Free
TradingView Indicator
Key Levels SpacemanBTC IDWM
🔑
✅
🏅
Key Levels SpacemanBTC IDWM is a TradingView indicator that automatically plots classical price action key levels with multi-timeframe.
![TradingView price chart displaying the Market Structure [TFO] indicator with lines connecting swing highs and swing lows. Visual markers indicate break of structure events and define bullish or bearish market trends based on price closes relative to swing points.](https://framerusercontent.com/images/80K9YM0lNGkSBy83oNZfQxryQ.png?width=4098&height=2304)
🤖
by tradeforopp
Free
TradingView Indicator
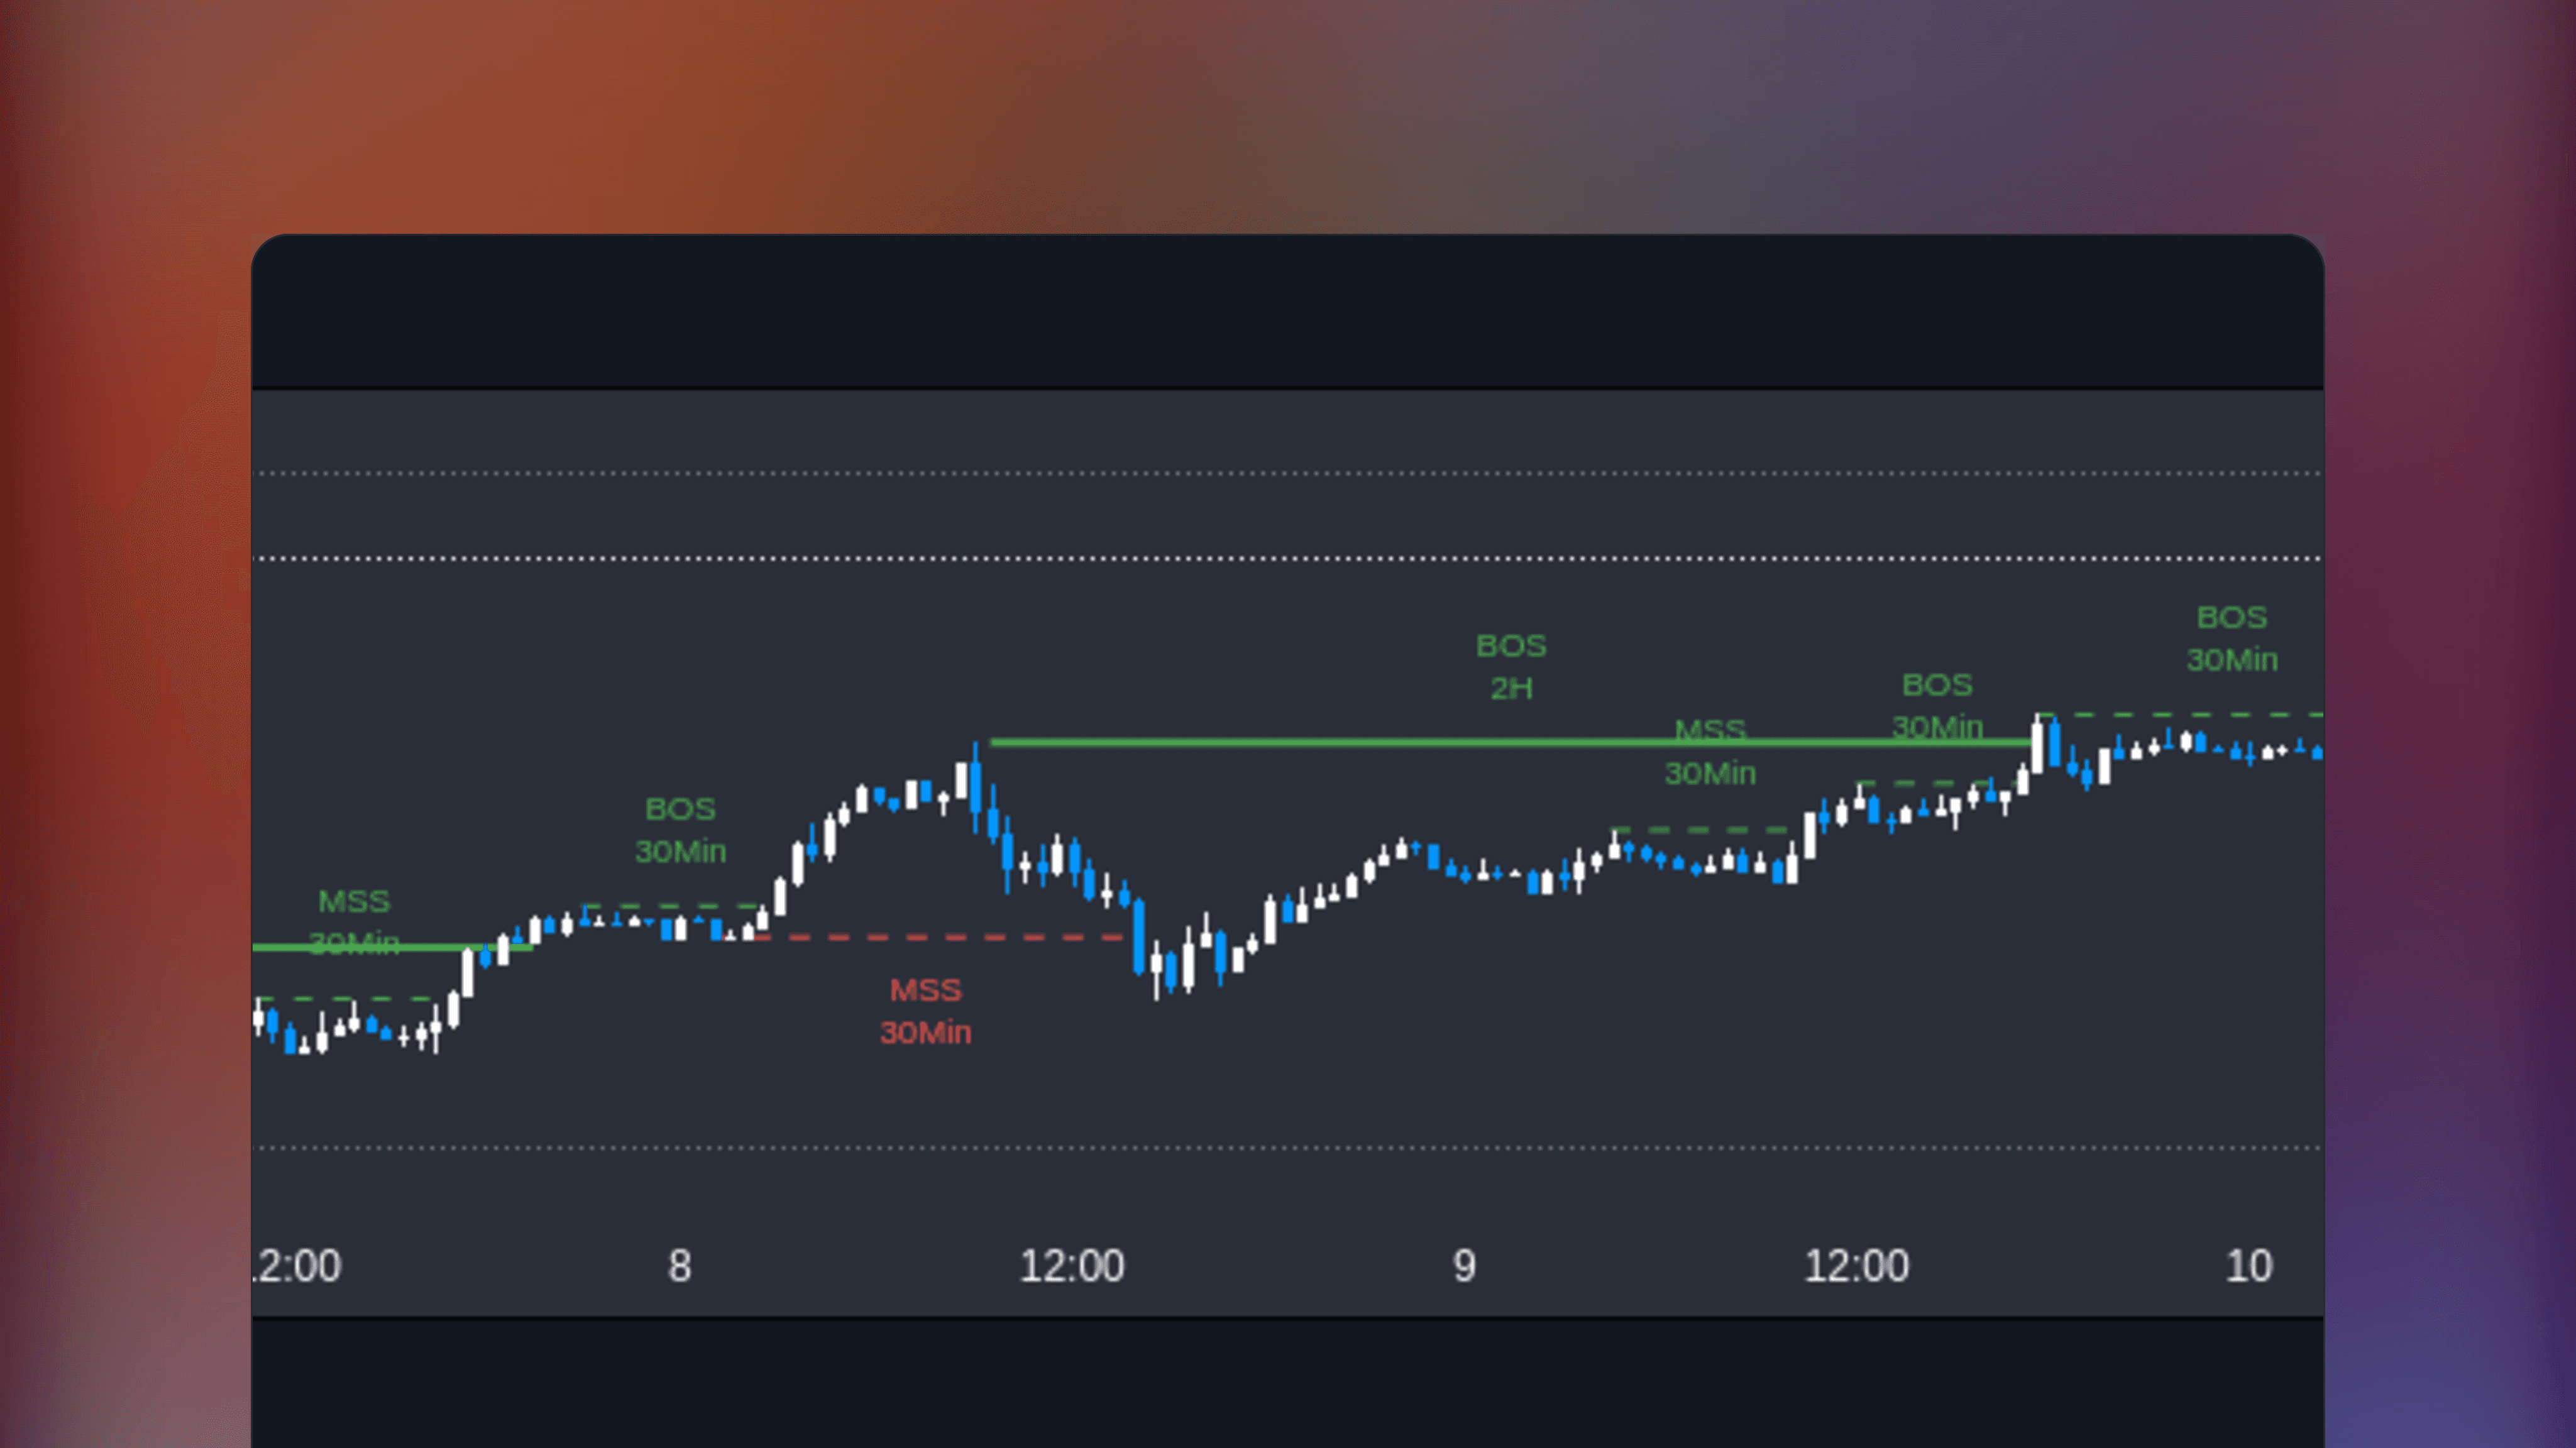
Market Structure [TFO]
🔑
🌐
✅
🏅
Market Structure [TFO] is a TradingView indicator that identifies market trends by analyzing price closes relative to previous swing highs and lows, a concept popular among ICT and price action traders.
![TradingView price chart showing the Opening Range Gaps [TFO] indicator with solid lines for midpoints and dashed lines for quartiles. The chart displays colored zones representing the difference between the previous close and current open. Green highlights indicate a gap up and red highlights indicate a gap down.](https://framerusercontent.com/images/fgBSRbXHPphuNOGAbPLR7ddq5m8.png?width=4098&height=2304)
🤖
by tradeforopp
Free
TradingView Indicator
Opening Range Gaps [TFO]
🔑
🌐
🏅
Opening Range Gaps [TFO] is a TradingView indicator that highlights gaps between the previous day’s close and today’s open with colors showing if the open is above or below the prior close.
🤖
by geneclash
Free
TradingView Indicator
Liquidity Raid - Stop Hunt
🔑
🌐
✅
🏅
Liquidity Raid - Stop Hunt is a TradingView indicator that identifies liquidity areas above previous highs and below previous lows, where market makers may target stop orders.
![TradingView price chart displaying the Range Projections [TFO] indicator plotting standard deviation levels and time windows based on the Central Bank Dealers Range](https://framerusercontent.com/images/mJzj0dlwMbCagjsnDov5jAYNB8.png?width=4098&height=2304)
🤖
by tradeforopp
Free
TradingView Indicator
Range Projections [TFO]
🔑
🌐
🏅
Range Projections [TFO] is a free TradingView indicator that visualizes how often prices reach specific standard deviations within a selected time range. By default based on ICT’s Central Bank Dealers Range (2–8 pm NY time) but can be applied to any timeframe.
🤖
by ChartPrime
Free
TradingView Indicator
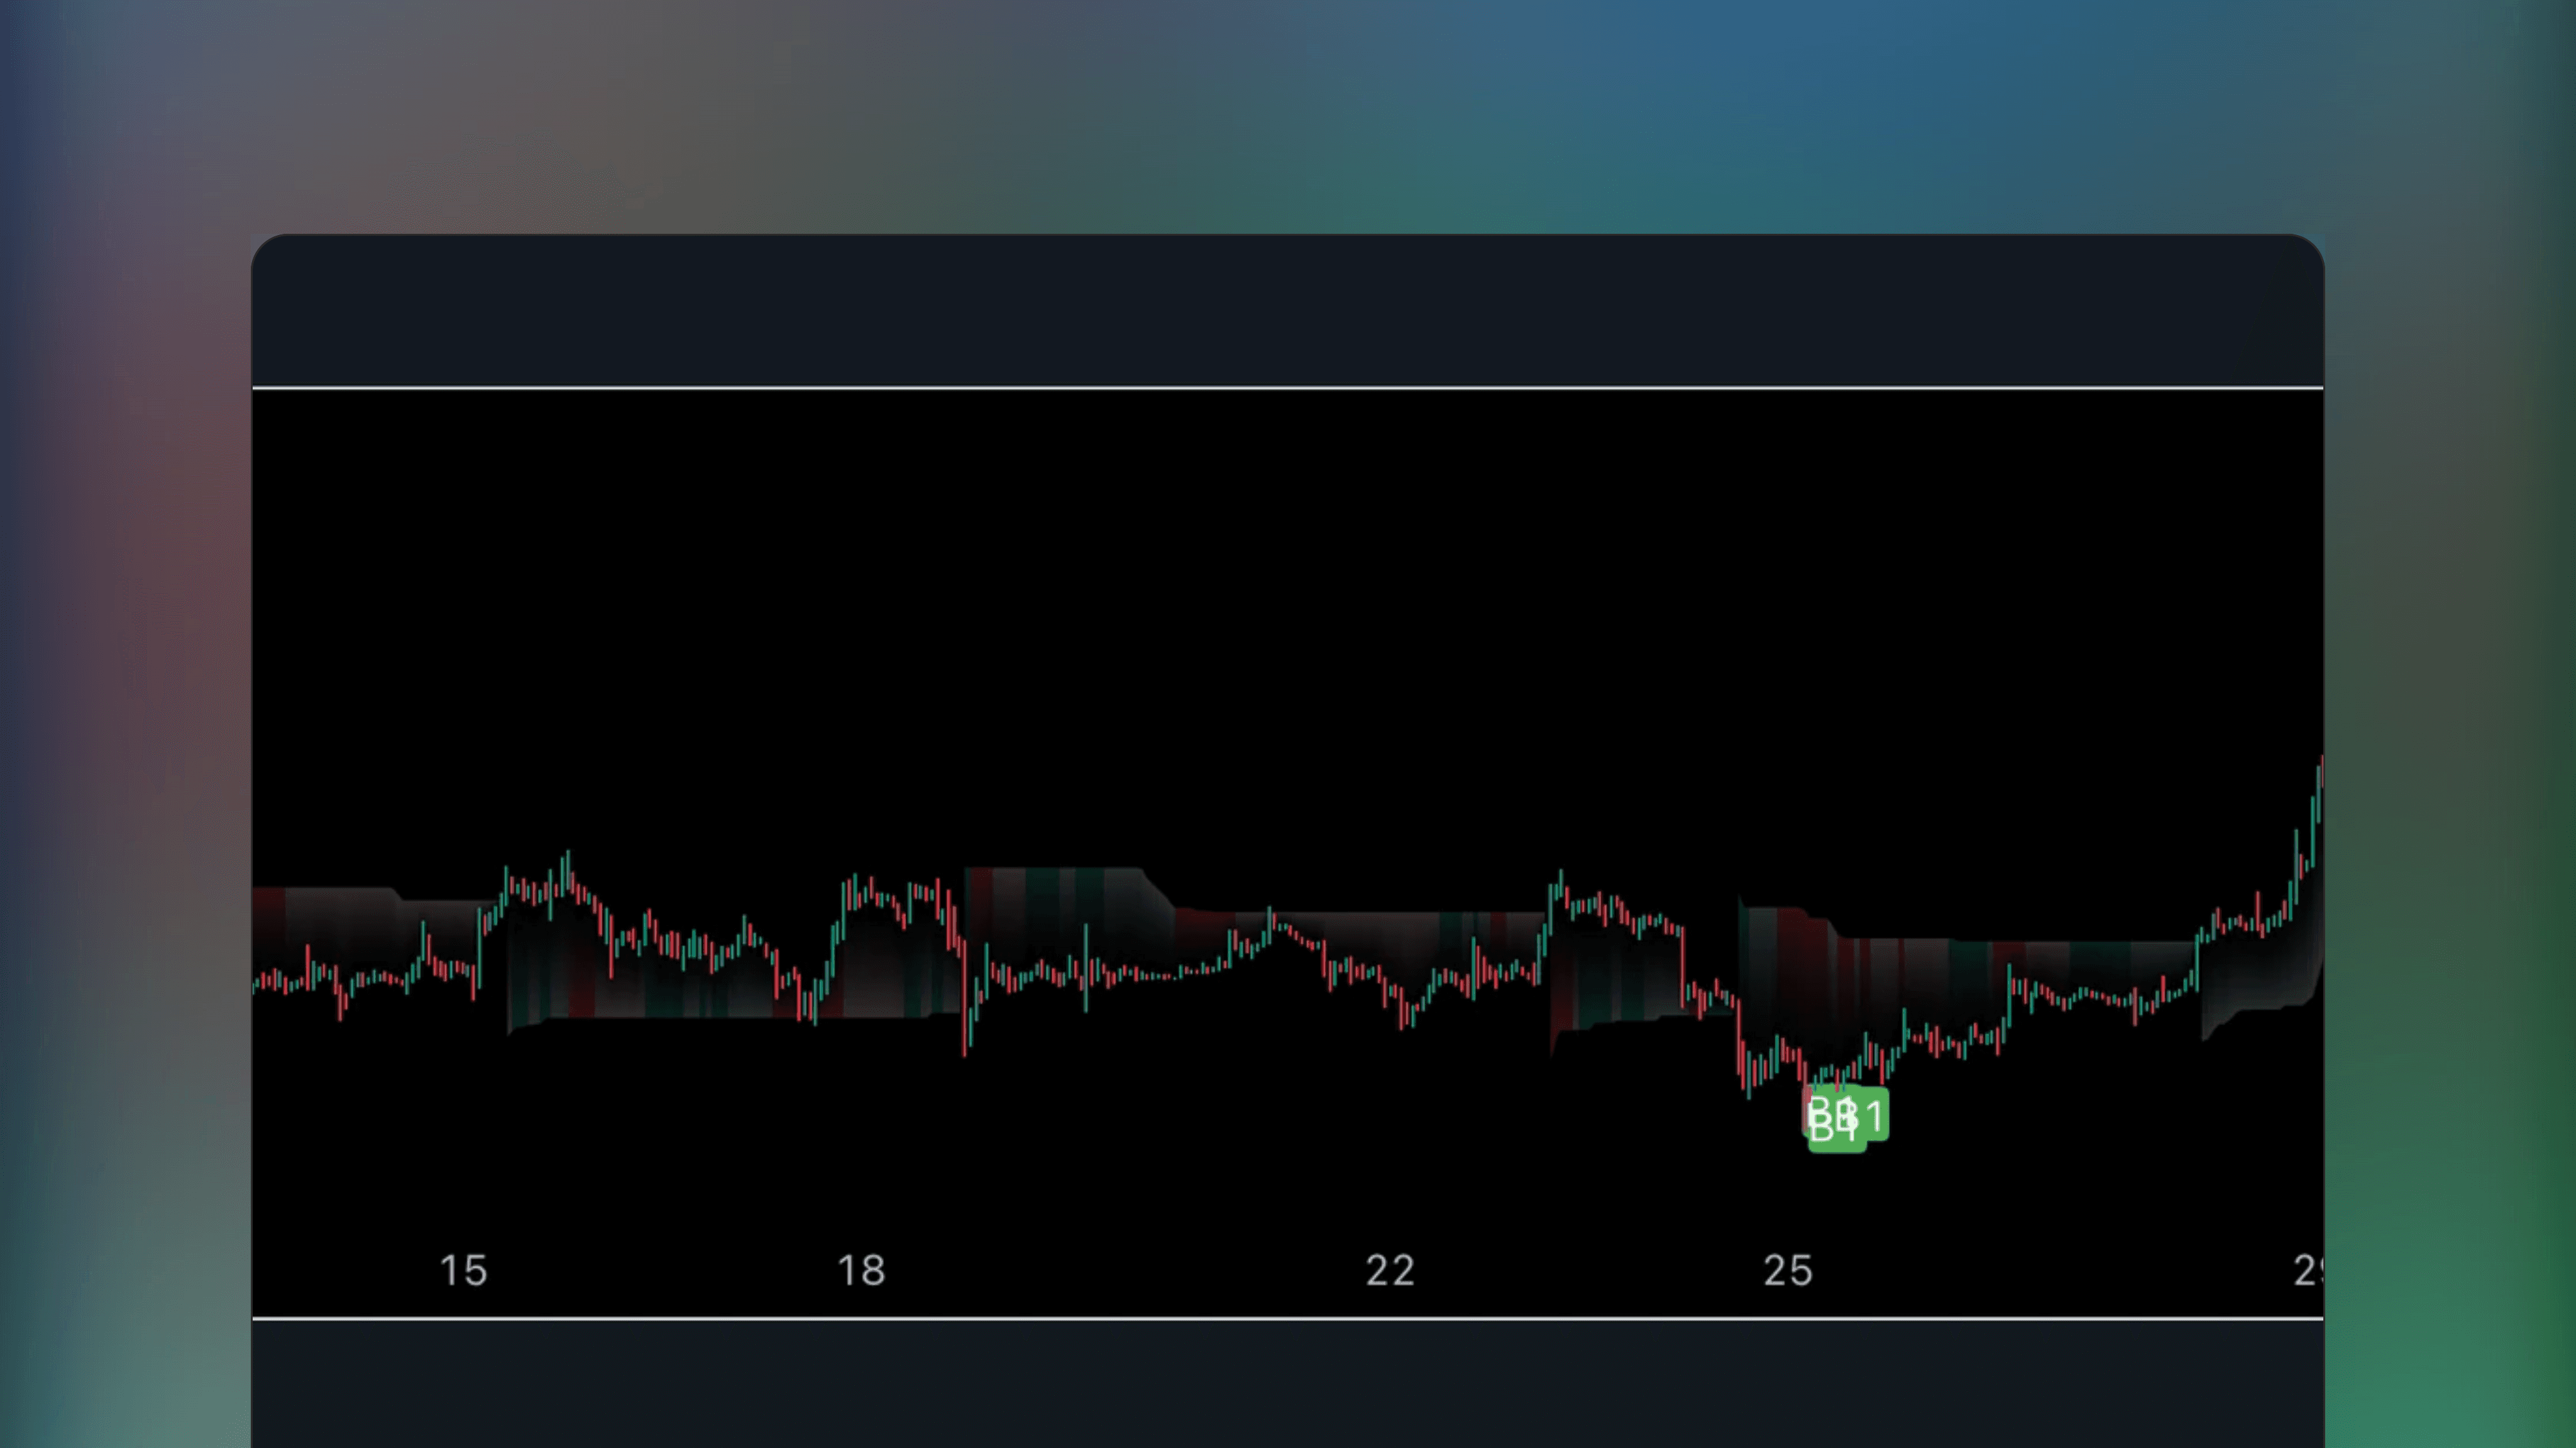
Bollinger Bands Liquidity Cloud [ChartPrime]
🔑
🌐
🏅
Bollinger Bands Liquidity Cloud [ChartPrime] is a TradingView indicator that expands Bollinger Bands with a heatmap showing traded volume at each price, based on similar calculations used in a volume profile.
🤖
by spacemanbtc
Free
TradingView Indicator
Fair Value Gap
🔑
🌐
✅
🏅
Fair Value Gap is a TradingView indicator that identifies fair value gaps across various timeframes, showing gaps on both current and higher timeframes. Can be used for gauging areas that are likely to fill sooner or later.

🤖
by twingall
Free
TradingView Indicator
FVGs & CEs + Alerts: simple & efficient method
🔑
✅
FVGs & CEs + Alerts is a TradingView indicator that identifies and marks Fair Value Gaps and their midlines. Fair Value Gaps are not displayed when conditions like hitting a CE or fully filling the gap are met, decreasing clutter. Includes alerts for fills.
🤖
by Lenny_Kiruthu
Free
TradingView Indicator
MTF Break of Structure(BOS) & Market Structure Shift(MSS)
🔑
🌐
MTF Break of Structure (BOS) & Market Structure Shift (MSS) is a TradingView indicator that detects key market structure shifts and breaks across multiple, customizable timeframes.
🤖
by spudow
Free
TradingView Indicator
Extreme Entry with Mean Reversion and Trend Filter
🔑
🌐
Extreme Entry with Mean Reversion and Trend Filter is a TradingView indicator that uses mean reversion, trend filtering, RSI levels, divergence, and momentum oscillators like CCI or MOM to provide long and short signals with high amount of stacked confluence.

🤖
by profitprotrading
Free
TradingView Indicator
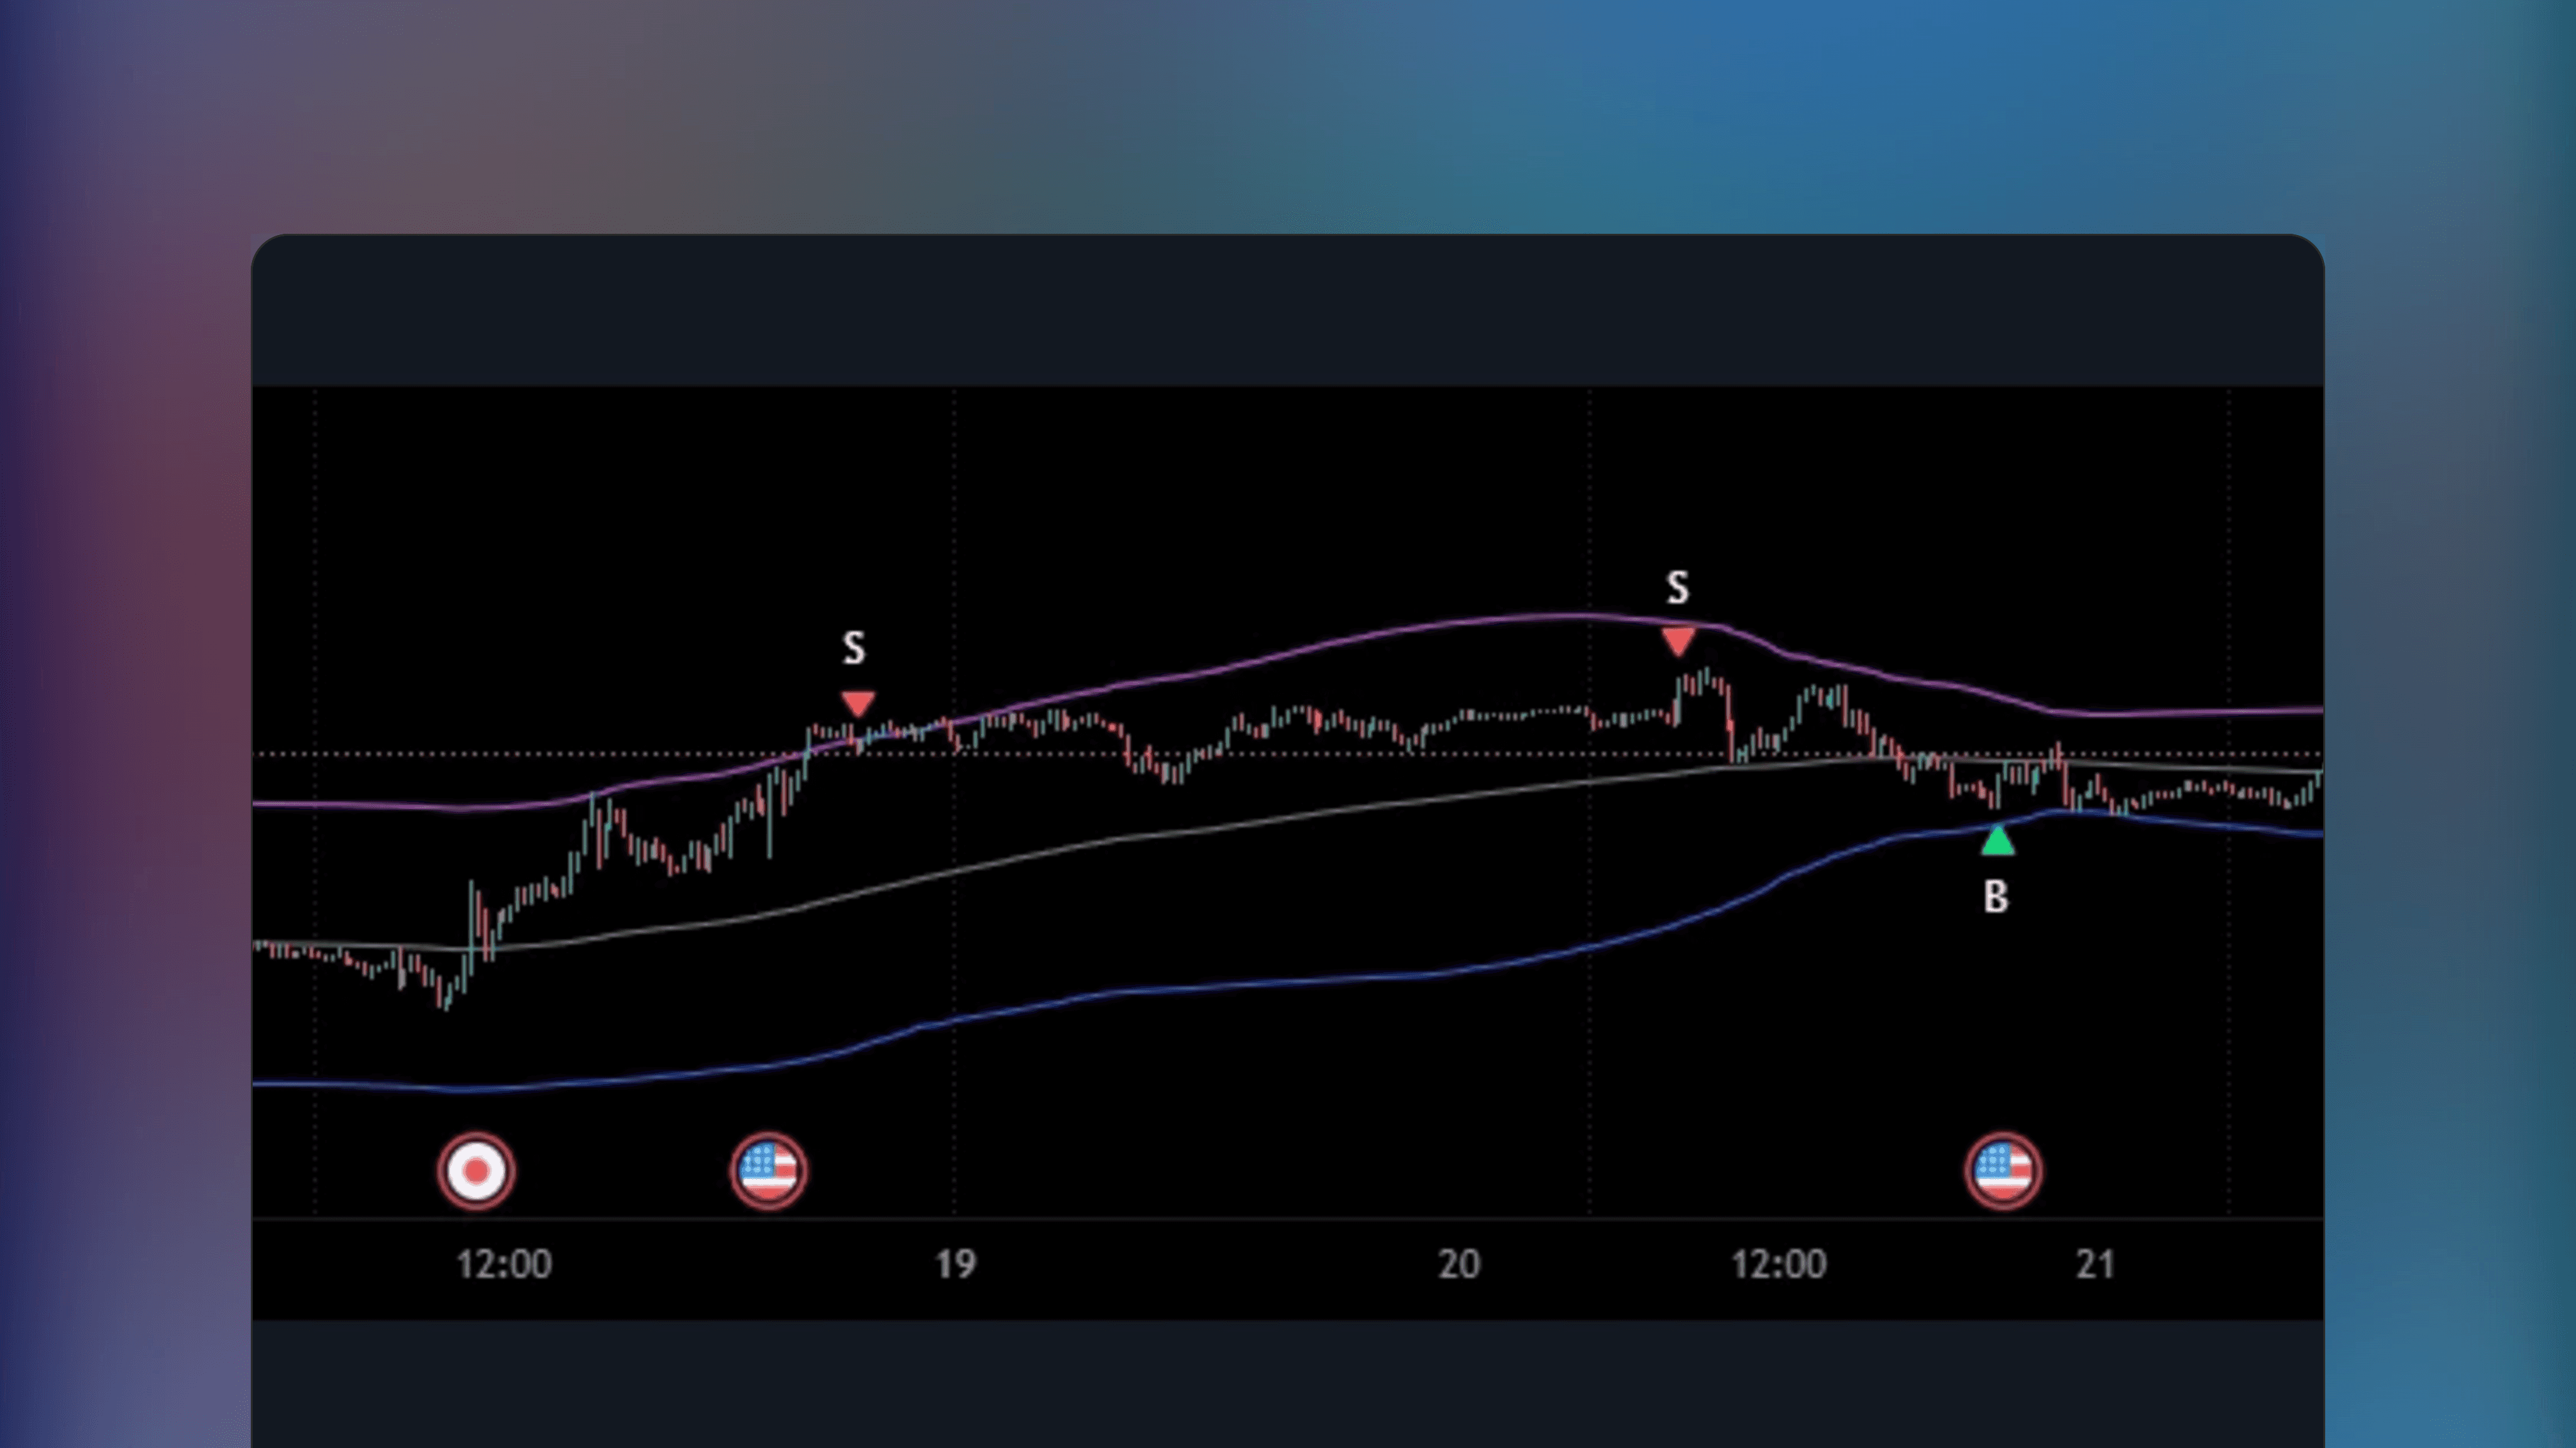
ALMA Smoothed Gaussian Moving Average
🔑
🌐
The ALMA Smoothed Gaussian Moving Average is an Indicator for TradingView that combines the Gaussian Moving Average with ALMA smoothing, reducing lag by putting more emphasis on most recent prices. The Indicator features trend shift signals as well as alerts.
🤖
by TheTradingParrot
Free
TradingView Indicator
TTP VIX Spy
🔑
🌐
🏅
TTP VIX Spy is a TradingView indicator using VIX volatility data to detect points in price with extreme greed and fear.
🤖
by loxx
Free
TradingView Indicator
STD-Filtered Jurik Volty Adaptive TEMA [Loxx]
🔑
🏅
The STD-Filtered Jurik Volty Adaptive TEMA [Loxx] Indicator integrates adaptive Jurik Volty periods into a Triple Exponential Moving Average with various statistical methods to reduce noise, resulting a in a less lagging and more responsive moving average.
🤖
by LeviathanCapital
Free
TradingView Indicator
Multi-Asset Performance [Spaghetti] - By Leviathan
🔑
✅
🏅
Multi-Asset Performance [Spaghetti] by Leviathan is a TradingView Indicator that visualizes cumulative percentage changes of up to 30 assets over a specified period, providing tools and analytics for analyzing outperforming assets and rotations.
🤖
by LeviathanCapital
Free
TradingView Indicator
Market Sessions - By Leviathan
🔑
🌐
✅
🏅
Market Sessions – By Leviathan is a TradingView indicator that visualizes the Tokyo, London, New York, and Sydney sessions using discreet boxes and colored candles, along with additional tools for tracking crucial market sessions.
🤖
by LeviathanCapital
Free
TradingView Indicator
Range Analysis - By Leviathan
🔑
🌐
✅
🏅
Range Analysis - By Leviathan is a free TradingView indicator that automates price range analysis by identifying key support and resistance levels. Draw range levels, generate Volume or Open Interest profiles, display heatmaps, plot anchored VWAP and Fibonacci retracement levels, automatically.
🤖
by sbtnc
Free
TradingView Indicator
Tops & Bottoms - Day of Week Report
🔑
✅
Tops & Bottoms - Day of Week Report is a TradingView indicator that analyzes likelihood of weekly price bottoms and tops for each day of the week. The statistical likelihood of a weekly bottom/top is visualized using a data table, showing how many occurences were found throughout the chart.
🤖
by KioseffTrading
Free
TradingView Indicator
Sync Frame (MTF Charts) [Kioseff Trading]
🔑
🌐
🏅
Sync Frame (MTF Charts) [Kioseff Trading] is a free TradingView indicator that allows users to view multiple lower timeframe charts for any asset simultaneously, in various formats, on a single screen.
🤖
by LeviathanCapital
Free
TradingView Indicator
Gaps + Imbalances + Wicks (MTF) - By Leviathan
🔑
🌐
✅
Gaps + Imbalances + Wicks (MTF) by Leviathan detects and displays price gaps in various forms - imbalances, gaps and inefficient wicks. This TradingView Indicator features customizable fill conditions, zone size filtering, volume comparison, lookback filtering and customizable visuals.
🤖
by KioseffTrading
Free
TradingView Indicator
Intrabar Analyzer [Kioseff Trading]
🔑
🌐
Intrabar Analyzer [Kioseff Trading] is a TradingView indicator that presents intrabar data in various formats to analyze price action within main timeframe candles. This Indicator features advanced features like volume analysis, technical ratings, linear regression and exotic candle types such as Kagi for lower timeframe price action.
🤖
by MXWLL-Capital-Trading
Free
TradingView Indicator
Mxwll Price Action Suite [Mxwll]
🔑
🌐
✅
🏅
Mxwll Price Action Suite is a TradingView indicator that combines multiple ICT and Smart Money Concepts with unique methodologies into an all-in-one price action toolkit.
🤖
by tradeforopp
Free
TradingView Indicator
TTrades Daily Bias [TFO]
🔑
🌐
TTrades Daily Bias [TFO] is a TradingView indicator that determines market bias by analyzing previous highs and lows on daily and weekly timeframes, tracking success rates based on successful follow-through in price action.
🤖
by sbtnc
Free
TradingView Indicator
Time of Day - Volatility Report
🔑
🌐
✅
Time of Day - Volatility Report is a TradingView indicator that analyzes market volatility at time by providing statistics on average hourly market fluctuations.
🤖
by LeviathanCapital
Free
TradingView Indicator
Market Structure - By Leviathan
🔑
🌐
✅
Market Structure - By Leviathan is a free TradingView indicator that identifies market structure, break of structure (BOS) and change of character (ChoCH) using price swing levels. Users can additionally visualize 0.5 retracement levels between swing highs and lows.
🤖
by LeviathanCapital
Free
TradingView Indicator
Liquidation Levels - By Leviathan
🔑
🌐
Liquidation Levels by Leviathan is a free TradingView indicator that identifies liquidation levels by analyzing open interest and volume data. The indicator picks up large influx of new positions opening and visualizes where over-leveraged traders may be liquidated.
🤖
by tradeforopp
Free
TradingView Indicator
ICT Killzones + Pivots [TFO]
🔑
🌐
ICT Killzones + Pivots [TFO] is a TradingView indicator that highlights and monitors trading session highs and lows, coined as kill zones by ICT traders.
🤖
by anche1991
Free
TradingView Indicator
Fair Value Gap by Anche
🔑
🌐
✅
Fair Value Gap by Anche is a TradingView indicator that identifies and plots fair value gaps caused by significant order imbalances. The indicator highlights areas where price may later move to resolve the inefficiency.
🤖
by tradeforopp
Free
TradingView Indicator
HTF Liquidity Dashboard [TFO]
🔑
HTF Liquidity Dashboard [TFO] is a TradingView Indicator that scans multiple symbols exceeding their previous day, week or month highs/lows with a dashboard for tracking the activity. Additional features include customizable symbols for scanning and alerts.
🤖
by makuchaku
Free
TradingView Indicator
Makuchaku's trading tools - Liquidity visualizer
🔑
🏅
Makuchaku's Trading Tools – Liquidity visualizer is a TradingView indicator that plots untouched pivots and fractals not yet breached by price, highlighting highs and lows where stop orders or liquidity may reside.
🤖
by Texmoonbeam
Free
TradingView Indicator
Automatic Closest FVG with BPR
🔑
✅
Automatic Closest FVG with BPR is a TradingView indicator that automatically detects and draws the closest, most relevant fair value gap (FVG) that is yet to be filled. On top, this indicator has an option to detect unfilled balanced price ranges (BPR), a formation with two fair value gaps overlapping.
🤖
by spacemanbtc
Free
TradingView Indicator
Key Levels SpacemanBTC IDWM
🔑
✅
🏅
Key Levels SpacemanBTC IDWM is a TradingView indicator that automatically plots classical price action key levels with multi-timeframe.
🤖
by tradeforopp
Free
TradingView Indicator
Market Structure [TFO]
🔑
🌐
✅
🏅
Market Structure [TFO] is a TradingView indicator that identifies market trends by analyzing price closes relative to previous swing highs and lows, a concept popular among ICT and price action traders.
🤖
by tradeforopp
Free
TradingView Indicator
Opening Range Gaps [TFO]
🔑
🌐
🏅
Opening Range Gaps [TFO] is a TradingView indicator that highlights gaps between the previous day’s close and today’s open with colors showing if the open is above or below the prior close.
🤖
by LeviathanCapital
Free
TradingView Indicator
Multi-Asset Performance [Spaghetti] - By Leviathan
🔑
✅
🏅
Multi-Asset Performance [Spaghetti] by Leviathan is a TradingView Indicator that visualizes cumulative percentage changes of up to 30 assets over a specified period, providing tools and analytics for analyzing outperforming assets and rotations.
🤖
by LeviathanCapital
Free
TradingView Indicator
Market Sessions - By Leviathan
🔑
🌐
✅
🏅
Market Sessions – By Leviathan is a TradingView indicator that visualizes the Tokyo, London, New York, and Sydney sessions using discreet boxes and colored candles, along with additional tools for tracking crucial market sessions.
🤖
by LeviathanCapital
Free
TradingView Indicator
Range Analysis - By Leviathan
🔑
🌐
✅
🏅
Range Analysis - By Leviathan is a free TradingView indicator that automates price range analysis by identifying key support and resistance levels. Draw range levels, generate Volume or Open Interest profiles, display heatmaps, plot anchored VWAP and Fibonacci retracement levels, automatically.
🤖
by sbtnc
Free
TradingView Indicator
Tops & Bottoms - Day of Week Report
🔑
✅
Tops & Bottoms - Day of Week Report is a TradingView indicator that analyzes likelihood of weekly price bottoms and tops for each day of the week. The statistical likelihood of a weekly bottom/top is visualized using a data table, showing how many occurences were found throughout the chart.
🤖
by KioseffTrading
Free
TradingView Indicator
Sync Frame (MTF Charts) [Kioseff Trading]
🔑
🌐
🏅
Sync Frame (MTF Charts) [Kioseff Trading] is a free TradingView indicator that allows users to view multiple lower timeframe charts for any asset simultaneously, in various formats, on a single screen.
🤖
by LeviathanCapital
Free
TradingView Indicator
Gaps + Imbalances + Wicks (MTF) - By Leviathan
🔑
🌐
✅
Gaps + Imbalances + Wicks (MTF) by Leviathan detects and displays price gaps in various forms - imbalances, gaps and inefficient wicks. This TradingView Indicator features customizable fill conditions, zone size filtering, volume comparison, lookback filtering and customizable visuals.
🤖
by KioseffTrading
Free
TradingView Indicator
Intrabar Analyzer [Kioseff Trading]
🔑
🌐
Intrabar Analyzer [Kioseff Trading] is a TradingView indicator that presents intrabar data in various formats to analyze price action within main timeframe candles. This Indicator features advanced features like volume analysis, technical ratings, linear regression and exotic candle types such as Kagi for lower timeframe price action.
🤖
by MXWLL-Capital-Trading
Free
TradingView Indicator
Mxwll Price Action Suite [Mxwll]
🔑
🌐
✅
🏅
Mxwll Price Action Suite is a TradingView indicator that combines multiple ICT and Smart Money Concepts with unique methodologies into an all-in-one price action toolkit.
🤖
by tradeforopp
Free
TradingView Indicator
TTrades Daily Bias [TFO]
🔑
🌐
TTrades Daily Bias [TFO] is a TradingView indicator that determines market bias by analyzing previous highs and lows on daily and weekly timeframes, tracking success rates based on successful follow-through in price action.
🤖
by sbtnc
Free
TradingView Indicator
Time of Day - Volatility Report
🔑
🌐
✅
Time of Day - Volatility Report is a TradingView indicator that analyzes market volatility at time by providing statistics on average hourly market fluctuations.
Discover trading edge
Discover trading edge
Indicators, Platforms & Education
Indicators, Platforms & Education
TradersList
Discover trading edge
Join Telegram
Weekly listings
Join Telegram
Disclaimer
Our goal is to achieve greater transparency, guidance and safety in trading and investing by providing means to discover, research and discuss trading/investing related sites/services.
Content provided on this site is not financial advice, meant for educational purposes only. TradersList does not endorse or guarantee any result for listed sites/services. Do your own research.
Read full disclaimer
TradersList
Discover trading edge
Join Telegram
Disclaimer
Our goal is to achieve greater transparency, guidance and safety in trading and investing by providing means to discover, research and discuss trading/investing related sites/services.
Content provided on this site is not financial advice, meant for educational purposes only. TradersList does not endorse or guarantee any result for listed sites/services. Do your own research.
Read full disclaimer