

From TradersList Editors
From TradersList Editors
Gain clearer market insights by using this free TradingView indicator to analyze cryptocurrency trends with Average Cap and Top Cap metrics.
Gain clearer market insights by using this free TradingView indicator to analyze cryptocurrency trends with Average Cap and Top Cap metrics.


TradingView Indicator
TradingView Indicator
Blockchain Fundamentals Average Cap and Top Cap Indicator: Cryptocurrency Market Cap Analysis
Blockchain Fundamentals Average Cap and Top Cap Indicator: Cryptocurrency Market Cap Analysis

by theheirophant on TradingView
by theheirophant on TradingView
🤖
🤖
🔗Blockchain Fundamentals - Average Cap & Top Cap -Cryptorhythms
🔗Blockchain Fundamentals - Average Cap & Top Cap -Cryptorhythms
Blockchain Fundamentals - Average Cap & Top Capis a TradingView Indicator originally developed by Renato Shirakashi and Willy Woo. This indicator utilizes average and top market cap methodologies to provide a relative measure for current market cap valuation.
Blockchain Fundamentals - Average Cap & Top Capis a TradingView Indicator originally developed by Renato Shirakashi and Willy Woo. This indicator utilizes average and top market cap methodologies to provide a relative measure for current market cap valuation.

Get on TradingView
This indicator is available on TradingView web charting platform. Signing up for a free account is required, no downloads.
Get on TradingView
This indicator is available on TradingView web charting platform. Signing up for a free account is required, no downloads.
🔑
Open Source
Listing has publically available source code that can be audited and modified as needed.
🔑
Open Source
Listing has publically available source code that can be audited and modified as needed.
💸
Free Access
All features of this listing are fully free to use with no pricing tiers. Simply start using.
💸
Free Access
All features of this listing are fully free to use with no pricing tiers. Simply start using.
🥇
Trusted Publisher
Publisher of this listing is well recognized in social channels and receives overwhelmingly positive feedback.
🥇
Trusted Publisher
Publisher of this listing is well recognized in social channels and receives overwhelmingly positive feedback.
Published by theheirophant on TradingView
Published by theheirophant on TradingView
Average Cap and Top Cap Explained
The Average Cap calculates the cumulative daily average of Bitcoin's market capitalization since inception. The Top Cap is derived by multiplying the Average Cap by a constant, creating an upper boundary that historically marks cycle tops. Together, these metrics create a valuation band for long-term Bitcoin analysis.
Origin of the Methodology
This framework was originally developed by Renato Shirakashi and later popularized by on-chain analyst Willy Woo. Their research showed that the Average Cap acts as a slow-moving fundamental floor, while the Top Cap serves as a ceiling. The relationship between current market cap and these boundaries defines the market cycle position.


Cycle Bottom and Top Identification
When Bitcoin's market cap approaches or dips below the Average Cap, it has historically marked generational buying opportunities near cycle bottoms. When market cap extends toward the Top Cap, it signals late-stage euphoria. Previous cycle peaks saw market cap approaching the Top Cap boundary before correcting sharply.
Relative Valuation Framework
Rather than predicting specific prices, this indicator provides a relative valuation framework. It answers whether current market cap is cheap, fair, or expensive relative to its long-term cumulative average. This perspective helps investors maintain discipline during both panic and euphoria phases of the market cycle.
Crypto top and bottom prediction using past data
Crypto top and bottom prediction using past data
Average Cap and Top Cap create a valuation band using cumulative market capitalization data since Bitcoin's inception. The Average Cap acts as a fundamental floor while Top Cap marks a ceiling, defining where the market sits within its historical cycle.
Average Cap and Top Cap create a valuation band using cumulative market capitalization data since Bitcoin's inception. The Average Cap acts as a fundamental floor while Top Cap marks a ceiling, defining where the market sits within its historical cycle.
Track Bitcoin cycle positioning
Compare current market cap to the Average and Top Cap boundaries. Position within the band indicates cycle phase.
Identify historical extremes as levels
Market cap approaching Average Cap has marked generational buying opportunities. Approaching Top Cap has signaled euphoric peaks.
Maintain strategic allocation discipline
Use the relative valuation framework to guide accumulation and distribution decisions across the full market cycle.
Common Questions About Average Cap and Top Cap Valuation
Common Questions About Average Cap and Top Cap Valuation
Average Cap and Top Cap create valuation boundaries based on cumulative market cap history. These questions address how these metrics identify cycle extremes and provide a relative valuation framework.
Average Cap and Top Cap create valuation boundaries based on cumulative market cap history. These questions address how these metrics identify cycle extremes and provide a relative valuation framework.
What is the difference between Average Cap and Top Cap?
Average Cap calculates the cumulative daily average of Bitcoin's market cap since inception. Top Cap multiplies Average Cap by a constant to create an upper boundary. Together they define a valuation band for cycle analysis.
How do these metrics identify cycle bottoms?
When Bitcoin's market cap approaches or dips below the Average Cap, it has historically marked generational buying opportunities near cycle bottoms. Previous bear market bottoms registered deep lows on this metric.
What does approaching Top Cap signal?
When market cap extends toward Top Cap, it signals late-stage euphoria. Previous cycle peaks saw market cap approaching this boundary before correcting sharply. This helps holders recognize when price exceeds sustainable fundamentals.
🌐
🌐
Web sentiment
Web sentiment
Traders on the web feel highly positive about Blockchain Fundamentals - Average Cap & Top Cap -Cryptorhythms, praising its indispensable features, speed, and value in enhancing trading activities.
Traders on the web feel highly positive about Blockchain Fundamentals - Average Cap & Top Cap -Cryptorhythms, praising its indispensable features, speed, and value in enhancing trading activities.
Source: Online Discussion
Source: Online Discussion
Source: Online Discussion
✍️
✍️
TradersList Reviews (2)
TradersList Reviews (2)
TradersList Community has given this listing two stars, indicating mild trust and some utility value. Do your research first.
TradersList Community has given this listing two stars, indicating mild trust and some utility value. Do your research first.
⭐️
⭐️
⭐️
⭐️
⭐️
Source: TradersList Reviews
Source: TradersList Reviews


Bookmark
Saved here
🤖
Get Indicator
Find Indicator
Review
Review Indicator
✍️
⭐️
⭐️
⭐️
⭐️
⭐️
3
Comments
Read on Telegram
Listing by third party publisher. Not financial advice.
Risk Disclosure


Share Listing
🤖
🤖
Get Indicator
Get Indicator
Find Indicator
Find Indicator
✍️
Review
Review
Review Indicator
Review Indicator
⭐️
⭐️
⭐️
⭐️
⭐️
Saved here
Bookmark
Listing by third party publisher. Not financial advice.
Listing by third party publisher. Not financial advice.
Risk Disclosure
Risk Disclosure
Share
🤖
3


🤖
3
🤖
3
✍️
By Author
More by theheirophant

🤖
by theheirophant

Free
TradingView Indicator
Blockchain Fundamentals: 200 Week MA Heatmap [CR]
🔑
🏅
Blockchain Fundamentals: 200 Week MA Heatmap [CR] is a TradingView indicator that visually represents long-term cryptocurrency market trends using a 200-week moving average with heatmap style colors.

🤖
by theheirophant
Free
TradingView Indicator
Blockchain Fundamentals - Active Address Sentiment Osc. [CR]
🔑
🌐
🏅
Blockchain Fundamentals - Active Address Sentiment Osc. [CR] is a TradingView Indicator that analyzes daily active Bitcoin addresses on the BTC blockchain relative BTC’s daily returns to identify discrepancies in Bitcoin’s intrinsic value.

🤖
by theheirophant

Free
TradingView Indicator
CME Bitcoin Gap Finder Orderblock Support Resistance
🔑
🌐
🏅
CME Bitcoin Gap Finder Orderblock Support Resistance is a TradingView indicator that identifies orderblocks on Bitcoin based on CME gaps.
Load More
🤖
by theheirophant
Free
TradingView Indicator
Blockchain Fundamentals: 200 Week MA Heatmap [CR]
🔑
🏅
Blockchain Fundamentals: 200 Week MA Heatmap [CR] is a TradingView indicator that visually represents long-term cryptocurrency market trends using a 200-week moving average with heatmap style colors.
🤖
by theheirophant
Free
TradingView Indicator
Blockchain Fundamentals - Active Address Sentiment Osc. [CR]
🔑
🌐
🏅
Blockchain Fundamentals - Active Address Sentiment Osc. [CR] is a TradingView Indicator that analyzes daily active Bitcoin addresses on the BTC blockchain relative BTC’s daily returns to identify discrepancies in Bitcoin’s intrinsic value.
Load More
🔥
New Listings
Featured this week

🤖
by allanster
Free
TradingView Indicator
Growing or Waning Patterns [Alerts]
New
🔑
🌐
Growing or Waning Patterns [Alerts] is a TradingView indicator that detects reversal signals based on three candle body patterns. The patterns are classified as increasing or decreasing depending on bullish and bearish states. Additional features include alerts and trend filter.

📟
Free*
Trade Analytics Platform
TRDR.IO
New
🌐
✅
🏅
TRDR.IO is a crypto orderflow platform providing various tools visualizing crypto exchange order book activity. See bid-ask imbalances, buy and sell demand as well as order book depth in real-time with intuitive visual overlays. Additional features include alerts and scanning crypto markets for orderflow events.

🤖
by LeviathanCapital
Free
TradingView Indicator
Swing Levels and Liquidity - By Leviathan
New
🔑
🌐
✅
Swing Levels and Liquidity is a TradingView Indicator that displays swing high and low levels with volume traded at the pivots. Once formed, these levels likely retain liquidity that traders can expect to produce support and resistance in price when swept.
🤖
by allanster
Free
TradingView Indicator
Growing or Waning Patterns [Alerts]
New
🔑
🌐
Growing or Waning Patterns [Alerts] is a TradingView indicator that detects reversal signals based on three candle body patterns. The patterns are classified as increasing or decreasing depending on bullish and bearish states. Additional features include alerts and trend filter.
📟
Free*
Trade Analytics Platform
TRDR.IO
New
🌐
✅
🏅
TRDR.IO is a crypto orderflow platform providing various tools visualizing crypto exchange order book activity. See bid-ask imbalances, buy and sell demand as well as order book depth in real-time with intuitive visual overlays. Additional features include alerts and scanning crypto markets for orderflow events.
Load More
🤖
Similar Listings
Traders also viewed
All


🤖
by jdehorty
Free
TradingView Indicator
Machine Learning: Lorentzian Classification
🔑
✅
🏅
Machine Learning: Lorentzian Classification is an Indicator that uses the Lorentzian Distance Classifier machine learning algorithm to categorize historical price data for predicting future price movements.

🤖
by sbtnc
Free
TradingView Indicator
Tops & Bottoms - Time of Day Report
🔑
🌐
✅
Tops & Bottoms - Time of Day Report is an Indicator that tracks and reports daily market tops and bottoms by time of day, analyzing their timing and frequency for statistical edge based on simple time periods.
🤖
by iravan
Free
TradingView Indicator
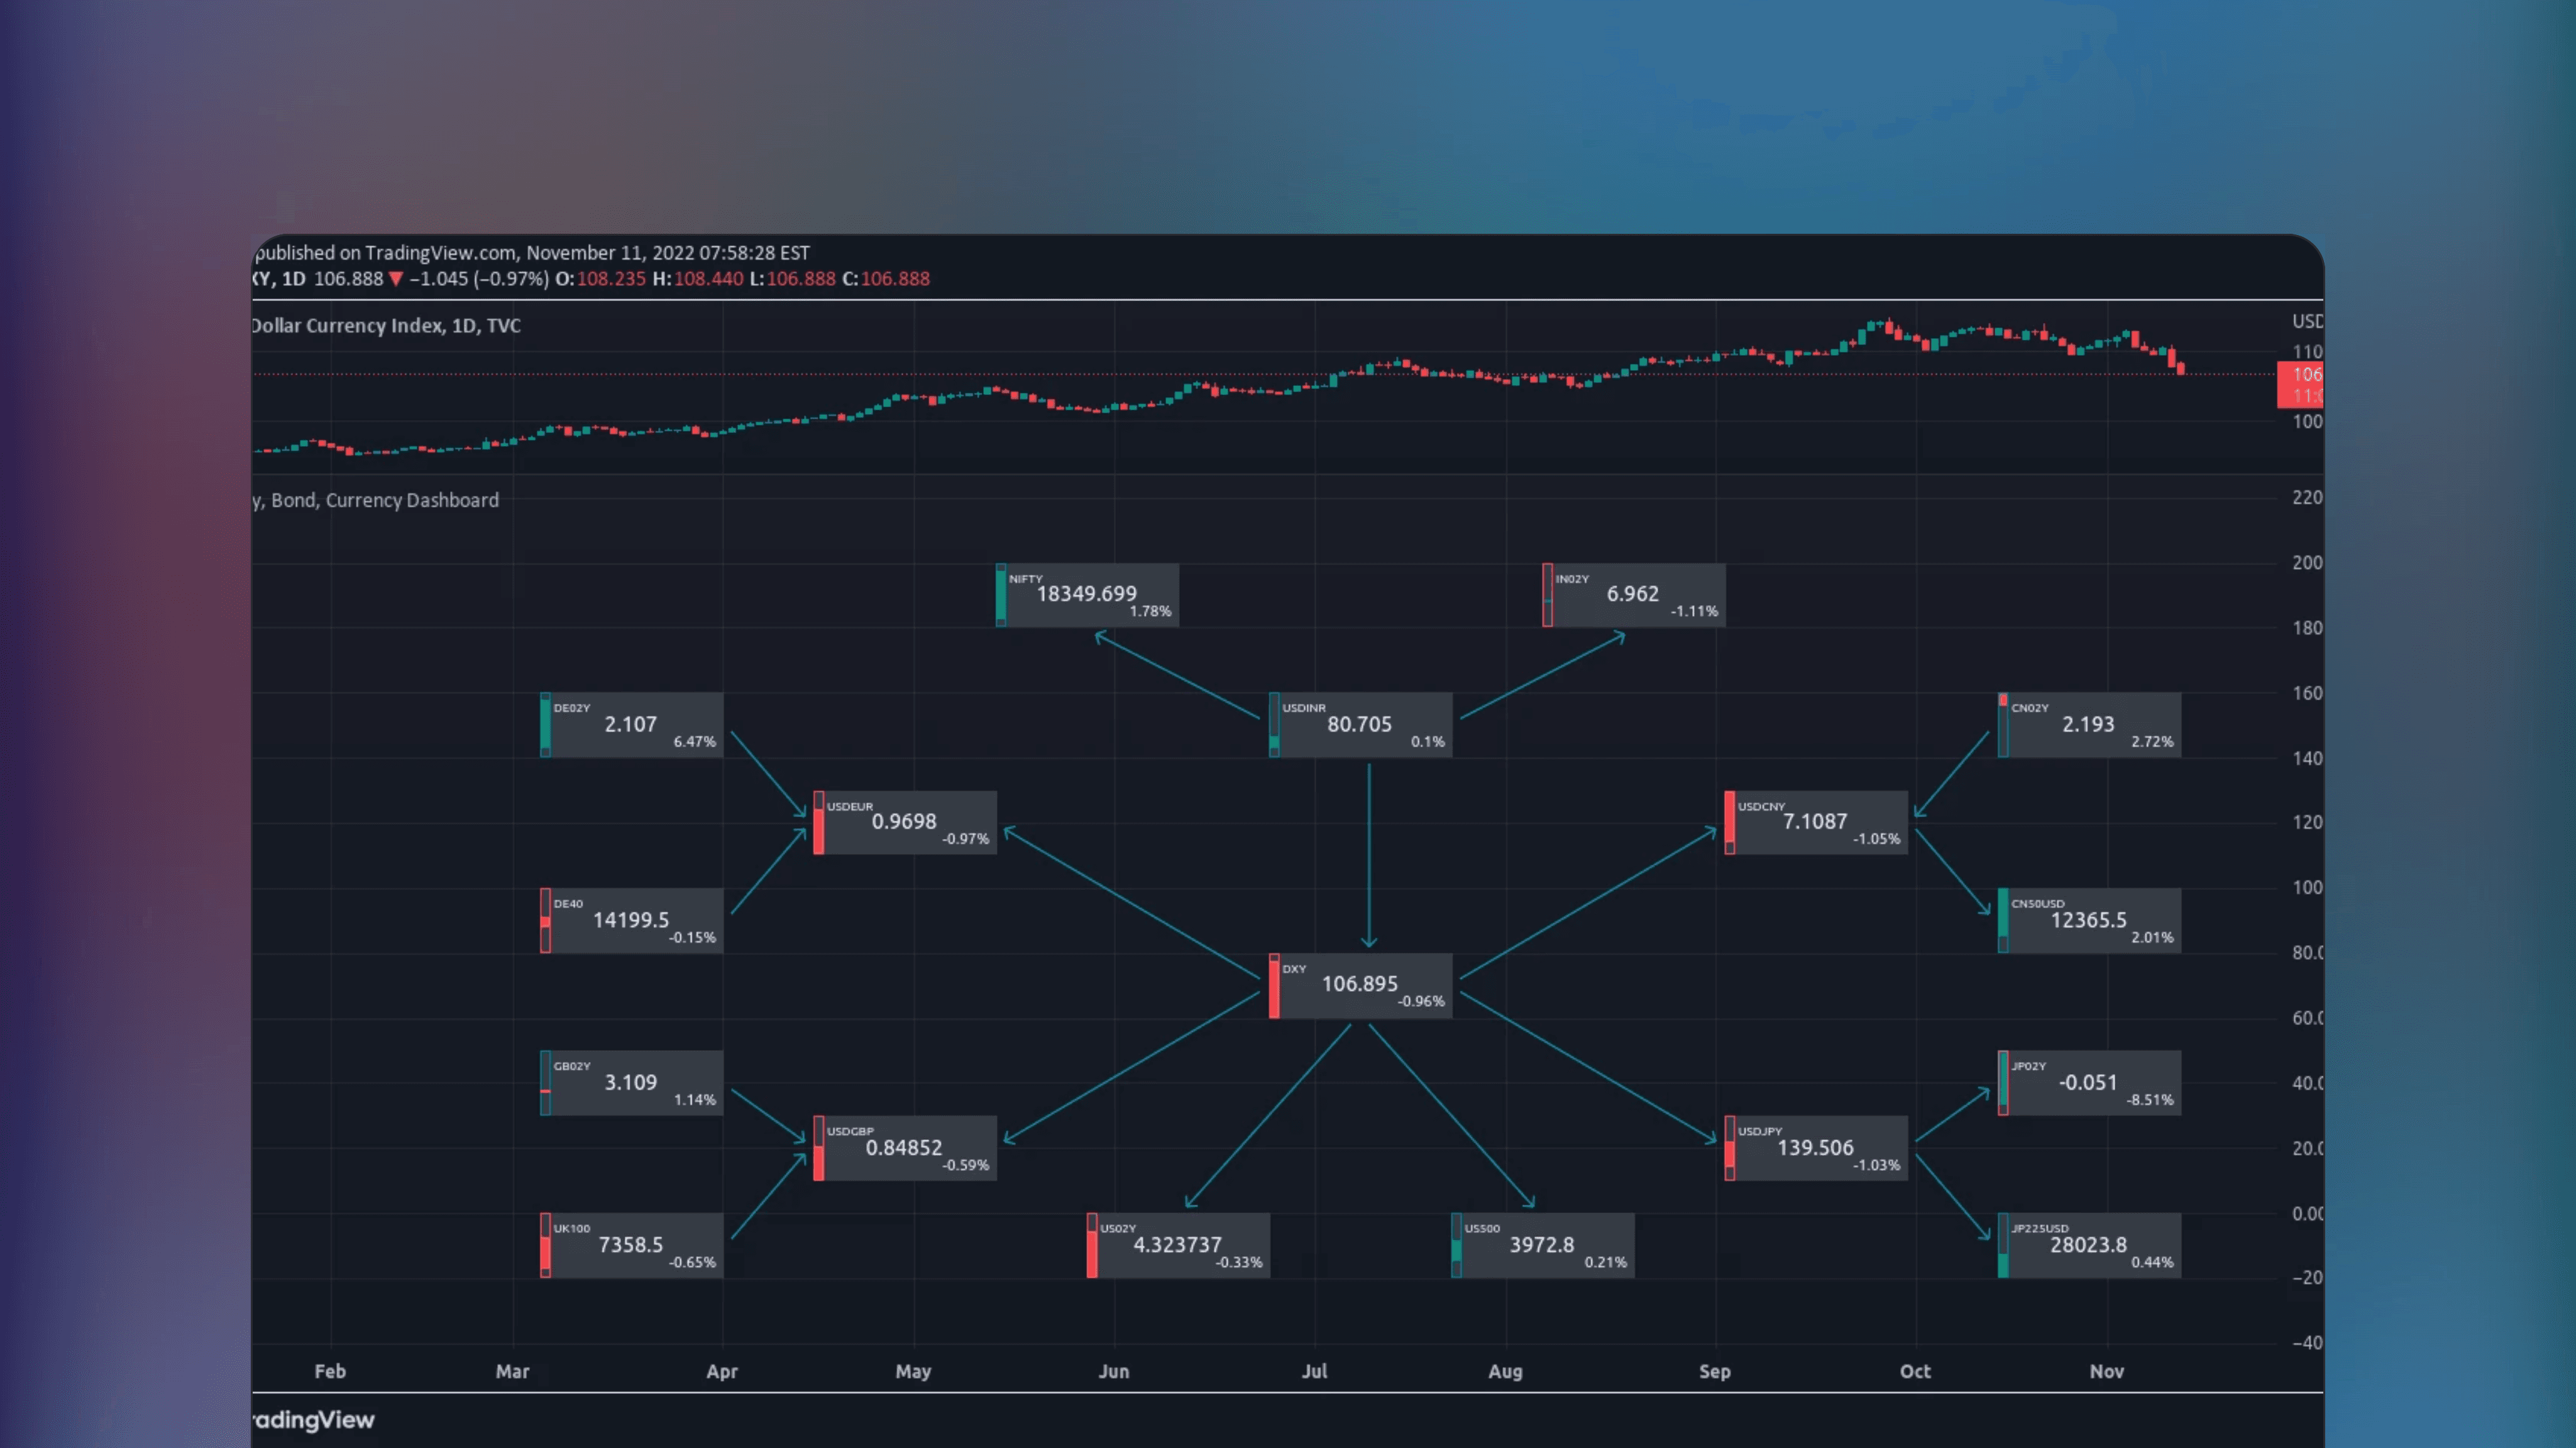
Equity Bond Currency Dashboard
🔑
🌐
✅
Equity Bond Currency Dashboard is a TradingView Indicator that visualizes demand-flow between equities, bonds and currencies across six countries, allowing track of institutional money flows and visuals for interconnected market dynamics.

🤖
by KioseffTrading
Free
TradingView Indicator
Fundamentals Graphing [Kioseff Trading]
🔑
✅
🏅
Fundamentals Graphing [Kioseff Trading] is a TradingView indicator that displays essential fundamental metrics for up to 40 stocks. It allows users to compare various key financial metrics like earnings and revenue for easy benchmarking.

🤖
by Zeiierman
Free
TradingView Indicator
Day/Week/Month Metrics (Zeiierman)
🔑
🌐
✅
Day/Week/Month Metrics (Zeiierman) is a TradingView indicator that computes daily, weekly and monthly performance. This indicator displays edge metrics, depicting how often an asset is likely to be bullish or bearish in a given time period.

🤖
by KioseffTrading
Free
TradingView Indicator
Monte Carlo Simulation - Your Strategy [Kioseff Trading]
🔑
🌐
✅
🏅
Monte Carlo Simulation - Your Strategy by Kioseff Trading is a free TradingView indicator that leverages Monte Carlo simulations to analyze the variability and potential outcomes of your inputted trading strategies or the assets displayed on your chart. Calculate your luck factor using this indicator.

🤖
by KioseffTrading
Free
TradingView Indicator
The Next Pivot [Kioseff Trading]
🔑
🌐
🏅
The Next Pivot [Kioseff Trading] is a TradingView indicator that employs similarity measures to compare historical price sequences with current data, formulating potential paths for future price action.

🤖
by KioseffTrading
Free
TradingView Indicator
(Quartile Vol.; Vol. Aggregation; Range US Bars; Gaps) [Kioseff]
🔑
🏅
The (Quartile Vol.; Vol. Aggregation; Range US Bars; Gaps) [Kioseff] Indicator is a TradingView tool that analyzes price action and volume by breaking volume into aggregated quartiles for noise filtered price and volume analysis.
![TradingView chart interface displaying the Seasonality [TFO] statistics indicator panel showing average asset performance across daily, monthly and quarterly timeframes based on a 252-day trading calendar.](https://framerusercontent.com/images/nvPXFfuC5h7lkcLmxaOhlHbStb8.png?width=4098&height=2304)
🤖
by tradeforopp
Free
TradingView Indicator
Seasonality [TFO]
🔑
🌐
✅
🏅
Seasonality [TFO] is a TradingView indicator that analyzes an asset's average performance across daily, monthly, and quarterly timeframes. It uses a 252-trading day calendar, aggregating daily data into 21-day months and 63-day quarters for gauging seasonal trends.

🤖
by KioseffTrading
Free
TradingView Indicator
Crypto Terminal [Kioseff Trading]
🔑
🌐
🏅
Crypto Terminal [Kioseff Trading] is a TradingView indicator that uses on-chain data to provide real-time cryptocurrency statistics directly on your Tradingview charts.

🤖
by toodegrees
Free
TradingView Indicator
Seasonal Open Interest° by toodegrees
🔑
🌐
✅
🏅
Seasonal Open Interest° by toodegrees is a TradingView Indicator that displays the daily number of outstanding futures contracts for specific commodities and markets, based on Open Interest data released after each trading day.

🤖
by pAulseperformance
Free
TradingView Indicator
Portfolio Backtester Engine
🔑
🌐
✅
🏅
Portfolio Backtester Engine is a TradingView indicator that enables backtesting trading strategies across multiple symbols simultaneously. Adapted from PineCoders’ engine, it retains all key functionalities while offering simultaneous backtesting in one go.

🤖
by KioseffTrading
Free
TradingView Indicator
Portfolio Laboratory [Kioseff Trading]
🔑
✅
Portfolio Laboratory [Kioseff Trading] is a free TradingView Indicator that analyzes historical portfolio performance using weighted percentage changes and provides comparison to popular indices as well as various risk metrics.

🤖
by reees
Free
TradingView Indicator
Harmonic Pattern Detection, Prediction, and Backtesting Tool
🔑
🌐
The Harmonic Pattern Detection, Prediction, and Backtesting Tool is a free TradingView indicator that automatically identifies and predicts harmonic XABCD patterns and allows users to backtest signals generated by them.
![TradingView price chart displaying the Captain Backtest Model [TFO] indicator on the NQ 5m timeframe highlighting the 10:00 to 14:00 EST trading window and statistical breakout setups](https://framerusercontent.com/images/3M4FGdZiXeXPv2u1vJZtccXkOeE.png?width=4098&height=2304)
🤖
by tradeforopp
Free
TradingView Indicator
Captain Backtest Model [TFO]
🔑
Captain Backtest Model [TFO] is a TradingView indicator using a systematic model to capture market breakouts during the 10:00-14:00 EST with three simple steps constituting a "trading setup". This systematic rule is backtested over historical data, allowing data-driven insights on model performance.

🤖
by MUQWISHI
Free
TradingView Indicator
Annual Returns % Comparison [By MUQWISHI]
🔑
🌐
✅
🏅
Annual Returns % Comparison [By MUQWISHI] is a free TradingView indicator that benchmarks the historical annual percentage change between two symbols using a simple to understand column visualization.

🤖
by SegaRKO
Free
TradingView Indicator
Black-Scholes Options Pricing Model
🔑
🌐
✅
The Black-Scholes Options Pricing Model is a TradingView indicator that applies the Black-Scholes formula to determine the theoretical value of options. Features all important greeks, such as Delta, Gamma, Theta, Vanna and more.

🤖
by toodegrees
Free
TradingView Indicator
ICT Commitment of Traders° by toodegrees
🔑
🌐
✅
The ICT Commitment of Traders° by toodegrees is a TradingView indicator that analyzes weekly CFTC Commitment of Traders reports, displaying the long and short positions of three key market participants: commercial traders, large traders and small speculators.

🤖
by toodegrees
Free
TradingView Indicator
Interest Rate and GDP Dashboard by toodegrees
🔑
🌐
✅
🏅
Interest Rate and GDP Dashboard by toodegrees is a TradingView Indicator that aggregates interest rates and GDP data from major Central Banks into one view for timely nsights into key economic metrics.

🤖
by iravan
Free
TradingView Indicator
Top 40 constituents of S&P 500 Index
🔑
🌐
✅
Top 40 constituents of S&P 500 Index is a free TradingView Indicator presenting real-time candle data for the top 40 S&P 500 stocks side-by-side, highlighting broad market breadth and depth in a given time frame.
![TradingView price chart displaying the AR Forecast Scatterplot [SS] indicator visualizing autoregressive forecasts as a scatterplot of potential price outcomes and statistical ranges](https://framerusercontent.com/images/h2fN8rx6z7CcyNxtZqArYu9O5M.png?width=4098&height=2304)
🤖
by Steversteves
Free
TradingView Indicator
AR Forecast Scatterplot [SS]
🔑
✅
AR Forecast Scatterplot [SS] is a free TradingView Indicator that calculates and visualizes forecasted trends using statistical methods based on historical price data.

🤖
by ChartPrime
Free
TradingView Indicator
Risk Reward Optimiser [ChartPrime]
🔑
🌐
🏅
Risk Reward Optimiser [ChartPrime] is a TradingView Indicator that automates the optimization of risk-reward ratios using a variety of different benchmarks.

🤖
by MUQWISHI
Free
TradingView Indicator
Treasury Yields Heatmap [By MUQWISHI]
🔑
🌐
✅
Treasury Yields Heatmap by MUQWISHI is a TradingView indicator that displays treasury yield rates over time and indicates the yield curve status - normal, flat, or inverted. Users can customize starting period, timeframe and reference country for bond data.

🤖
by roamin129
Free
TradingView Indicator
AMDX Time Zone
🔑
AMDX Time Zone is a TradingView indicator based on Accumulation and Manipulation theory, highlighting extreme price levels within specific time zones and trading sessions, also known as kill zones.

🤖
by BarefootJoey
Free
TradingView Indicator
Astro: Planetary Aspect Table
🔑
Astro: Planetary Aspect Table is a free TradingView indicator that maps planetary angles between, showing their positions in an easy to read dashboard. An experimental indicator displaying potential celestial influences on Earth events and financial markets.

🤖
by MUQWISHI
Free
TradingView Indicator
Financial Data Spreadsheet [By MUQWISHI]
🔑
🌐
✅
🏅
Financial Data Spreadsheet by MUQWISHI is a TradingView indicator displaying spreadsheet-like tables of key financial metrics from income statements to cash flow statements, based on most recent reporting period.
🤖
by iravan
Free
TradingView Indicator
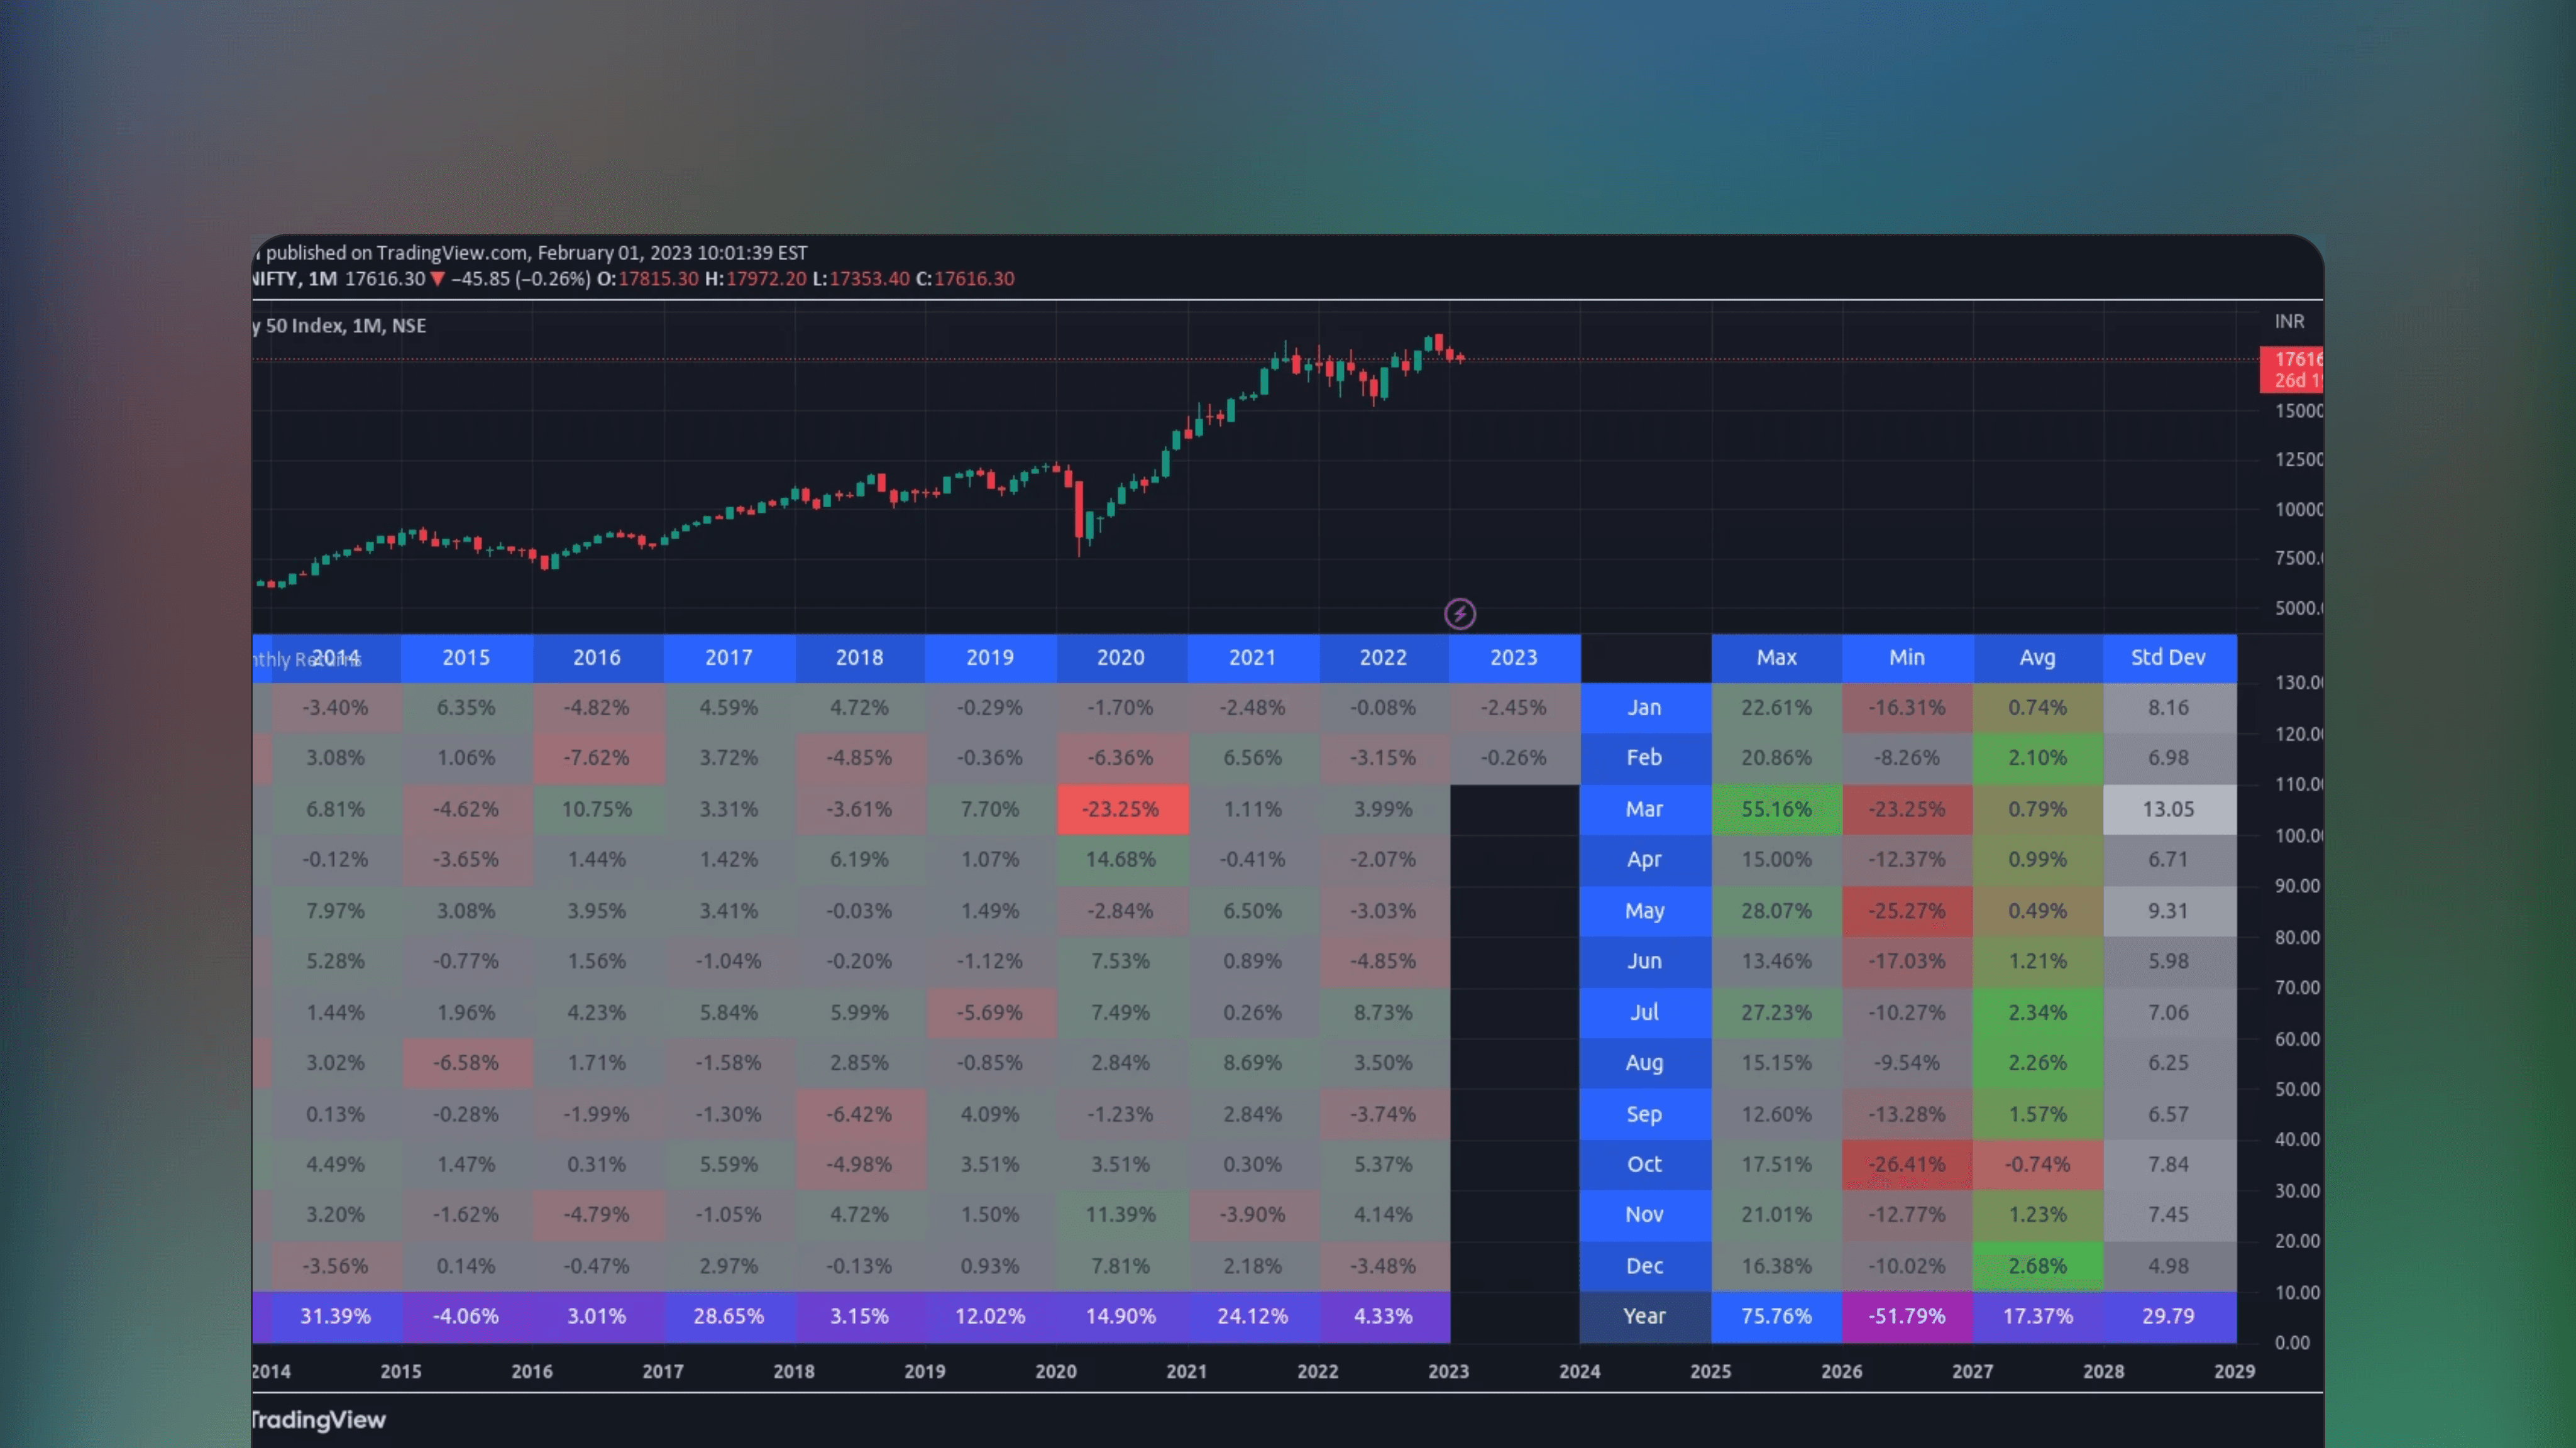
Monthly Returns
🔑
🌐
✅
🏅
Monthly Returns is a free TradingView indicator that displays monthly and yearly investment returns in a table, including maximum, minimum and average returns as well as standard deviations, providing a statistical summary of performance.

🤖
by ILuvMarkets
Free
TradingView Indicator
NSE Sector Performance
🔑
🌐
NSE Sector Performance displays various stock market sector performance metrics from daily, weekly, quarterly and annual timeframes. Indicator includes additional metrics such as 250 day high/low and distance of current price from these points. Supports user selected custom sectors.

🤖
by Zeiierman
Free
TradingView Indicator
Dividend Calendar (Zeiierman)
🔑
🌐
✅
🏅
Dividend Calendar (Zeiierman) is a TradingView indicator that provides a schedule of expected dividend payouts from public companies.

🤖
by loxx
Free
TradingView Indicator
Black Scholes Option Pricing Model w/ Greeks [Loxx]
🔑
🌐
✅
🏅
Black Scholes Option Pricing Model w/ Greeks [Loxx] is a TradingView indicator that uses the Black Scholes Merton model to automatically calculate option Greeks, displayed in a user-friendly dashboard format.
🤖
by jdehorty
Free
TradingView Indicator
Machine Learning: Lorentzian Classification
🔑
✅
🏅
Machine Learning: Lorentzian Classification is an Indicator that uses the Lorentzian Distance Classifier machine learning algorithm to categorize historical price data for predicting future price movements.
🤖
by sbtnc
Free
TradingView Indicator
Tops & Bottoms - Time of Day Report
🔑
🌐
✅
Tops & Bottoms - Time of Day Report is an Indicator that tracks and reports daily market tops and bottoms by time of day, analyzing their timing and frequency for statistical edge based on simple time periods.
🤖
by iravan
Free
TradingView Indicator
Equity Bond Currency Dashboard
🔑
🌐
✅
Equity Bond Currency Dashboard is a TradingView Indicator that visualizes demand-flow between equities, bonds and currencies across six countries, allowing track of institutional money flows and visuals for interconnected market dynamics.
🤖
by KioseffTrading
Free
TradingView Indicator
Fundamentals Graphing [Kioseff Trading]
🔑
✅
🏅
Fundamentals Graphing [Kioseff Trading] is a TradingView indicator that displays essential fundamental metrics for up to 40 stocks. It allows users to compare various key financial metrics like earnings and revenue for easy benchmarking.
🤖
by Zeiierman
Free
TradingView Indicator
Day/Week/Month Metrics (Zeiierman)
🔑
🌐
✅
Day/Week/Month Metrics (Zeiierman) is a TradingView indicator that computes daily, weekly and monthly performance. This indicator displays edge metrics, depicting how often an asset is likely to be bullish or bearish in a given time period.
🤖
by KioseffTrading
Free
TradingView Indicator
Monte Carlo Simulation - Your Strategy [Kioseff Trading]
🔑
🌐
✅
🏅
Monte Carlo Simulation - Your Strategy by Kioseff Trading is a free TradingView indicator that leverages Monte Carlo simulations to analyze the variability and potential outcomes of your inputted trading strategies or the assets displayed on your chart. Calculate your luck factor using this indicator.
🤖
by KioseffTrading
Free
TradingView Indicator
The Next Pivot [Kioseff Trading]
🔑
🌐
🏅
The Next Pivot [Kioseff Trading] is a TradingView indicator that employs similarity measures to compare historical price sequences with current data, formulating potential paths for future price action.
🤖
by KioseffTrading
Free
TradingView Indicator
(Quartile Vol.; Vol. Aggregation; Range US Bars; Gaps) [Kioseff]
🔑
🏅
The (Quartile Vol.; Vol. Aggregation; Range US Bars; Gaps) [Kioseff] Indicator is a TradingView tool that analyzes price action and volume by breaking volume into aggregated quartiles for noise filtered price and volume analysis.
🤖
by tradeforopp
Free
TradingView Indicator
Seasonality [TFO]
🔑
🌐
✅
🏅
Seasonality [TFO] is a TradingView indicator that analyzes an asset's average performance across daily, monthly, and quarterly timeframes. It uses a 252-trading day calendar, aggregating daily data into 21-day months and 63-day quarters for gauging seasonal trends.
🤖
by KioseffTrading
Free
TradingView Indicator
Crypto Terminal [Kioseff Trading]
🔑
🌐
🏅
Crypto Terminal [Kioseff Trading] is a TradingView indicator that uses on-chain data to provide real-time cryptocurrency statistics directly on your Tradingview charts.
🤖
by toodegrees
Free
TradingView Indicator
Seasonal Open Interest° by toodegrees
🔑
🌐
✅
🏅
Seasonal Open Interest° by toodegrees is a TradingView Indicator that displays the daily number of outstanding futures contracts for specific commodities and markets, based on Open Interest data released after each trading day.
🤖
by pAulseperformance
Free
TradingView Indicator
Portfolio Backtester Engine
🔑
🌐
✅
🏅
Portfolio Backtester Engine is a TradingView indicator that enables backtesting trading strategies across multiple symbols simultaneously. Adapted from PineCoders’ engine, it retains all key functionalities while offering simultaneous backtesting in one go.
🤖
by KioseffTrading
Free
TradingView Indicator
Portfolio Laboratory [Kioseff Trading]
🔑
✅
Portfolio Laboratory [Kioseff Trading] is a free TradingView Indicator that analyzes historical portfolio performance using weighted percentage changes and provides comparison to popular indices as well as various risk metrics.
🤖
by reees
Free
TradingView Indicator
Harmonic Pattern Detection, Prediction, and Backtesting Tool
🔑
🌐
The Harmonic Pattern Detection, Prediction, and Backtesting Tool is a free TradingView indicator that automatically identifies and predicts harmonic XABCD patterns and allows users to backtest signals generated by them.
🤖
by tradeforopp
Free
TradingView Indicator
Captain Backtest Model [TFO]
🔑
Captain Backtest Model [TFO] is a TradingView indicator using a systematic model to capture market breakouts during the 10:00-14:00 EST with three simple steps constituting a "trading setup". This systematic rule is backtested over historical data, allowing data-driven insights on model performance.
🤖
by MUQWISHI
Free
TradingView Indicator
Annual Returns % Comparison [By MUQWISHI]
🔑
🌐
✅
🏅
Annual Returns % Comparison [By MUQWISHI] is a free TradingView indicator that benchmarks the historical annual percentage change between two symbols using a simple to understand column visualization.
🤖
by SegaRKO
Free
TradingView Indicator
Black-Scholes Options Pricing Model
🔑
🌐
✅
The Black-Scholes Options Pricing Model is a TradingView indicator that applies the Black-Scholes formula to determine the theoretical value of options. Features all important greeks, such as Delta, Gamma, Theta, Vanna and more.
🤖
by toodegrees
Free
TradingView Indicator
ICT Commitment of Traders° by toodegrees
🔑
🌐
✅
The ICT Commitment of Traders° by toodegrees is a TradingView indicator that analyzes weekly CFTC Commitment of Traders reports, displaying the long and short positions of three key market participants: commercial traders, large traders and small speculators.
🤖
by toodegrees
Free
TradingView Indicator
Interest Rate and GDP Dashboard by toodegrees
🔑
🌐
✅
🏅
Interest Rate and GDP Dashboard by toodegrees is a TradingView Indicator that aggregates interest rates and GDP data from major Central Banks into one view for timely nsights into key economic metrics.
🤖
by iravan
Free
TradingView Indicator
Top 40 constituents of S&P 500 Index
🔑
🌐
✅
Top 40 constituents of S&P 500 Index is a free TradingView Indicator presenting real-time candle data for the top 40 S&P 500 stocks side-by-side, highlighting broad market breadth and depth in a given time frame.
🤖
by jdehorty
Free
TradingView Indicator
Machine Learning: Lorentzian Classification
🔑
✅
🏅
Machine Learning: Lorentzian Classification is an Indicator that uses the Lorentzian Distance Classifier machine learning algorithm to categorize historical price data for predicting future price movements.
🤖
by sbtnc
Free
TradingView Indicator
Tops & Bottoms - Time of Day Report
🔑
🌐
✅
Tops & Bottoms - Time of Day Report is an Indicator that tracks and reports daily market tops and bottoms by time of day, analyzing their timing and frequency for statistical edge based on simple time periods.
🤖
by iravan
Free
TradingView Indicator
Equity Bond Currency Dashboard
🔑
🌐
✅
Equity Bond Currency Dashboard is a TradingView Indicator that visualizes demand-flow between equities, bonds and currencies across six countries, allowing track of institutional money flows and visuals for interconnected market dynamics.
🤖
by KioseffTrading
Free
TradingView Indicator
Fundamentals Graphing [Kioseff Trading]
🔑
✅
🏅
Fundamentals Graphing [Kioseff Trading] is a TradingView indicator that displays essential fundamental metrics for up to 40 stocks. It allows users to compare various key financial metrics like earnings and revenue for easy benchmarking.
🤖
by Zeiierman
Free
TradingView Indicator
Day/Week/Month Metrics (Zeiierman)
🔑
🌐
✅
Day/Week/Month Metrics (Zeiierman) is a TradingView indicator that computes daily, weekly and monthly performance. This indicator displays edge metrics, depicting how often an asset is likely to be bullish or bearish in a given time period.
🤖
by KioseffTrading
Free
TradingView Indicator
Monte Carlo Simulation - Your Strategy [Kioseff Trading]
🔑
🌐
✅
🏅
Monte Carlo Simulation - Your Strategy by Kioseff Trading is a free TradingView indicator that leverages Monte Carlo simulations to analyze the variability and potential outcomes of your inputted trading strategies or the assets displayed on your chart. Calculate your luck factor using this indicator.
🤖
by KioseffTrading
Free
TradingView Indicator
The Next Pivot [Kioseff Trading]
🔑
🌐
🏅
The Next Pivot [Kioseff Trading] is a TradingView indicator that employs similarity measures to compare historical price sequences with current data, formulating potential paths for future price action.
🤖
by KioseffTrading
Free
TradingView Indicator
(Quartile Vol.; Vol. Aggregation; Range US Bars; Gaps) [Kioseff]
🔑
🏅
The (Quartile Vol.; Vol. Aggregation; Range US Bars; Gaps) [Kioseff] Indicator is a TradingView tool that analyzes price action and volume by breaking volume into aggregated quartiles for noise filtered price and volume analysis.
🤖
by tradeforopp
Free
TradingView Indicator
Seasonality [TFO]
🔑
🌐
✅
🏅
Seasonality [TFO] is a TradingView indicator that analyzes an asset's average performance across daily, monthly, and quarterly timeframes. It uses a 252-trading day calendar, aggregating daily data into 21-day months and 63-day quarters for gauging seasonal trends.
🤖
by KioseffTrading
Free
TradingView Indicator
Crypto Terminal [Kioseff Trading]
🔑
🌐
🏅
Crypto Terminal [Kioseff Trading] is a TradingView indicator that uses on-chain data to provide real-time cryptocurrency statistics directly on your Tradingview charts.
Discover trading edge
Discover trading edge
Indicators, Platforms & Education
Indicators, Platforms & Education
TradersList
Discover trading edge
Join Telegram
Weekly listings
Join Telegram
Disclaimer
Our goal is to achieve greater transparency, guidance and safety in trading and investing by providing means to discover, research and discuss trading/investing related sites/services.
Content provided on this site is not financial advice, meant for educational purposes only. TradersList does not endorse or guarantee any result for listed sites/services. Do your own research.
Read full disclaimer
TradersList
Discover trading edge
Join Telegram
Disclaimer
Our goal is to achieve greater transparency, guidance and safety in trading and investing by providing means to discover, research and discuss trading/investing related sites/services.
Content provided on this site is not financial advice, meant for educational purposes only. TradersList does not endorse or guarantee any result for listed sites/services. Do your own research.
Read full disclaimer