

From TradersList Editors
From TradersList Editors
Uncover early market trends and potential reversals with visual guides using this streamlined opening range and VWAP indicator.
Uncover early market trends and potential reversals with visual guides using this streamlined opening range and VWAP indicator.


ThinkOrSwim Indicator
ThinkOrSwim Indicator
Opening Range Indicator with VWAP and Measured Moves for ThinkOrSwim
Opening Range Indicator with VWAP and Measured Moves for ThinkOrSwim

by futuretony on ThinkOrSwim
by futuretony on ThinkOrSwim
🤖
🤖
Opening Range Indicator with Measured Moves and VWAP For ThinkOrSwim
Opening Range Indicator with Measured Moves and VWAP For ThinkOrSwim
The Opening Range Indicator with Measured Moves and VWAP for ThinkOrSwim highlights selected market events during a set period, plotting key levels and VWAP to track fair value and high probability price levels.
The Opening Range Indicator with Measured Moves and VWAP for ThinkOrSwim highlights selected market events during a set period, plotting key levels and VWAP to track fair value and high probability price levels.
Get on ThinkOrSwim
This indicator is available on ThinkOrSwim charting platform. Signing up for a free account and downloading ThinkOrSwim software is required.
Get on ThinkOrSwim
This indicator is available on ThinkOrSwim charting platform. Signing up for a free account and downloading ThinkOrSwim software is required.
🔑
Open Source
Listing has publically available source code that can be audited and modified as needed.
🔑
Open Source
Listing has publically available source code that can be audited and modified as needed.
💸
Free Access
All features of this listing are fully free to use with no pricing tiers. Simply start using.
💸
Free Access
All features of this listing are fully free to use with no pricing tiers. Simply start using.
🥇
Trusted Publisher
Publisher of this listing is well recognized in social channels and receives overwhelmingly positive feedback.
🥇
Trusted Publisher
Publisher of this listing is well recognized in social channels and receives overwhelmingly positive feedback.
🌐
Popular Topic
Concepts and theories mentioned in listing are popular topics in web search
🌐
Popular Topic
Concepts and theories mentioned in listing are popular topics in web search
Published by futuretony on ThinkOrSwim
Published by futuretony on ThinkOrSwim
Defining the Opening Range
The opening range captures the high and low of a specified period at the market open - typically the first 5, 15 or 30 minutes. This range establishes the day's initial balance zone. Breakouts above or below the opening range often set the directional tone for the rest of the trading session.
Measured Move Projections
Once a breakout occurs, the indicator projects measured move targets based on the height of the opening range. If the range is 5 points wide and price breaks above, the first target is 5 points above the high. These levels serve as profit targets and help traders set realistic expectations for the move.


VWAP as a Fair Value Reference
The Volume Weighted Average Price (VWAP) line provides a real-time reference for fair value. When price is above VWAP, buyers are in control; when below, sellers dominate. Combining VWAP with the opening range creates a framework - a breakout above the range with price above VWAP is a high-conviction long setup.
Day Trading Workflow Integration
Day traders can build their entire morning routine around this indicator. Identify the opening range, wait for a breakout, confirm with VWAP direction and target the measured move levels. This structured approach removes emotional decision-making and provides clear rules for entries, exits and risk management.
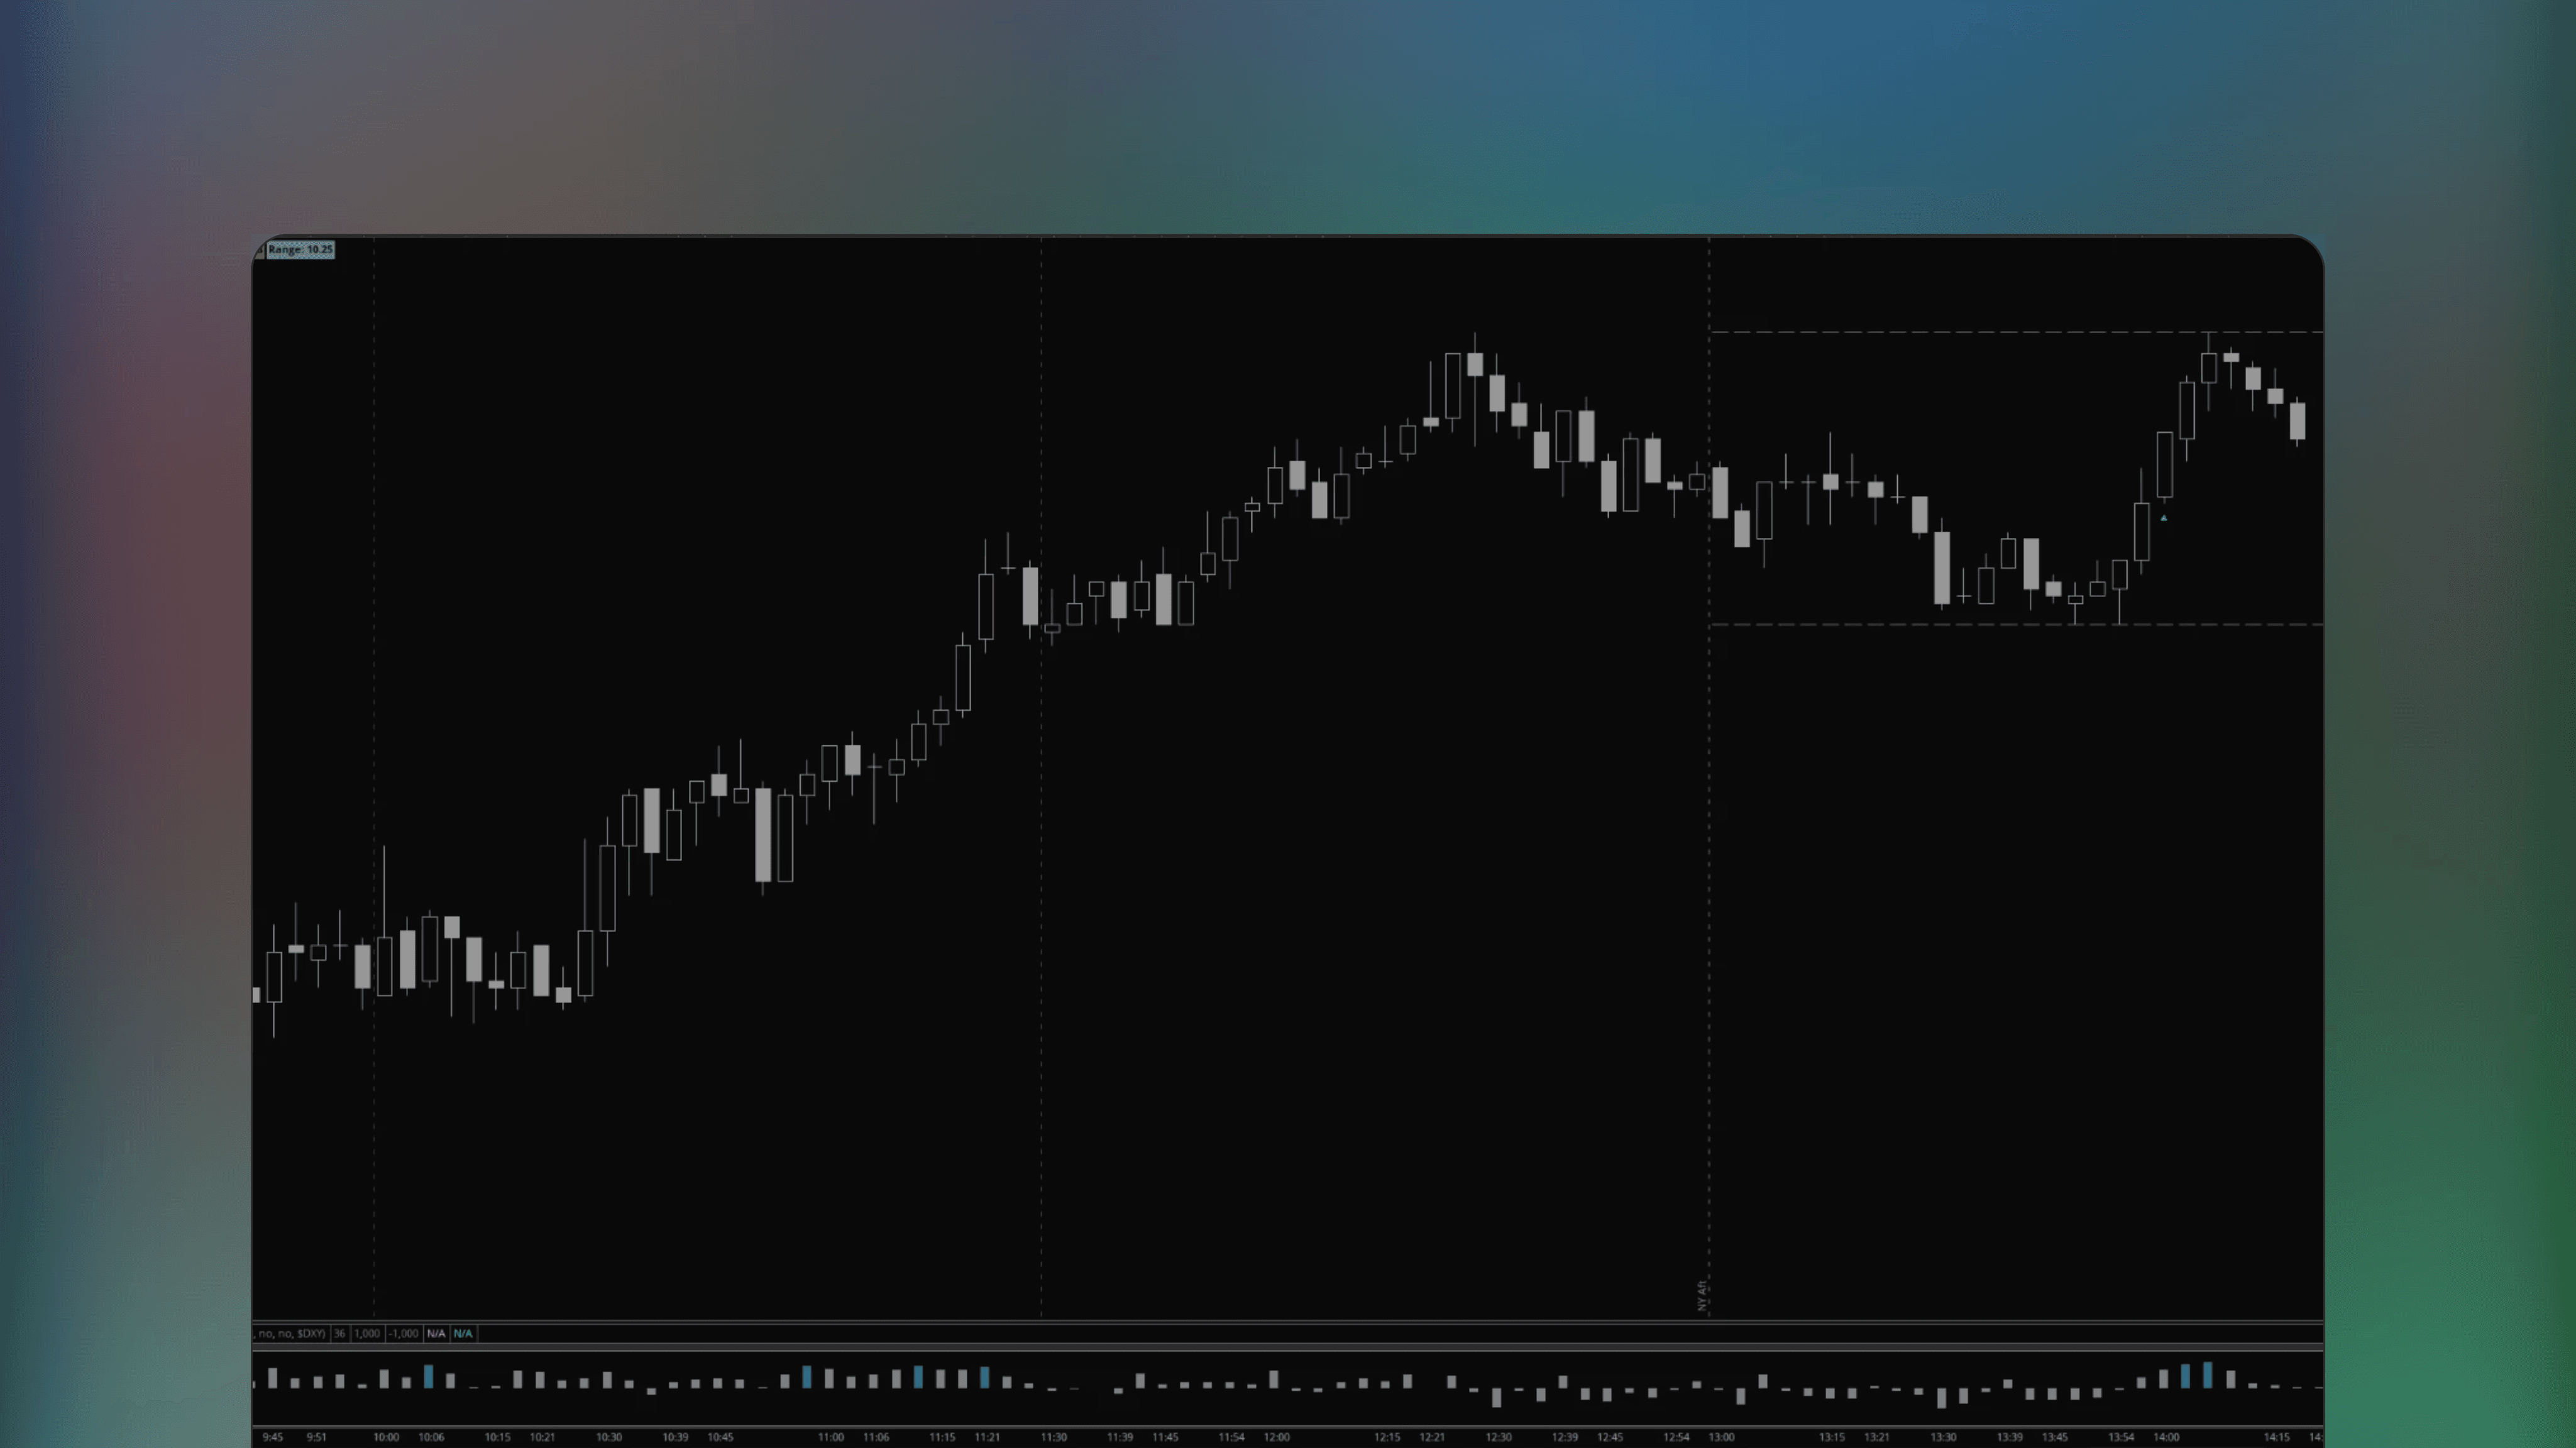
Opening range with a few extras
Opening range with a few extras
This indicator plots the opening range high and low along with measured move targets and VWAP. Breakouts from the range set directional bias while VWAP serves as a fair value reference and the measured moves provide profit targets.
This indicator plots the opening range high and low along with measured move targets and VWAP. Breakouts from the range set directional bias while VWAP serves as a fair value reference and the measured moves provide profit targets.
Define Session Structure
The opening range establishes the initial balance zone, and breakouts above or below set the directional tone for the trading day.
Confirm Directional Strength
A breakout above the range with price holding above VWAP confirms bullish control; the reverse confirms bearish momentum.
Target Range-Based Extensions
Measured move projections based on the opening range height provide logical profit targets after a breakout occurs.
Common Questions About Opening Range Breakout Trading
Common Questions About Opening Range Breakout Trading
The opening range establishes the day's initial balance zone. Here are common questions about trading opening range breakouts with measured move targets.
The opening range establishes the day's initial balance zone. Here are common questions about trading opening range breakouts with measured move targets.
What timeframe works best for the opening range?
Common settings include the first 5, 15 or 30 minutes. Shorter ranges produce more signals but more false breakouts. Longer ranges provide cleaner signals but less opportunity. Many traders prefer 15 or 30 minutes as a balance.
How are the measured move targets calculated?
Measured move targets project the opening range height above or below the breakout level. If the range is 5 points wide and price breaks above, the first target is 5 points above the range high. Multiple extensions can be plotted.
Why include VWAP with the opening range?
VWAP confirms directional bias. A breakout above the opening range with price also above VWAP shows both momentum and value favoring longs. This confluence increases confidence compared to a breakout against VWAP direction.
🌐
🌐
Web sentiment
Web sentiment
Traders appreciate the Opening Range Indicator with Measured Moves and VWAP for ThinkOrSwim, valuing its utility, customization, and the supportive community surrounding it.
Traders appreciate the Opening Range Indicator with Measured Moves and VWAP for ThinkOrSwim, valuing its utility, customization, and the supportive community surrounding it.
Source: Online Discussion
Source: Online Discussion
Source: Online Discussion
✍️
✍️
TradersList Reviews (4)
TradersList Reviews (4)
TradersList Community has given this listing three stars, indicating decent trust and value for traders' toolkit. Make sure you understand functionality before using.
TradersList Community has given this listing three stars, indicating decent trust and value for traders' toolkit. Make sure you understand functionality before using.
⭐️
⭐️
⭐️
⭐️
⭐️
Source: TradersList Reviews
Source: TradersList Reviews


Bookmark
Saved here
🤖
Get Indicator
Find Indicator
Review
Review Indicator
✍️
⭐️
⭐️
⭐️
⭐️
⭐️
3
Comments
Read on Telegram
Listing by third party publisher. Not financial advice.
Risk Disclosure


Share Listing
🤖
🤖
Get Indicator
Get Indicator
Find Indicator
Find Indicator
✍️
Review
Review
Review Indicator
Review Indicator
⭐️
⭐️
⭐️
⭐️
⭐️
Saved here
Bookmark
Listing by third party publisher. Not financial advice.
Listing by third party publisher. Not financial advice.
Risk Disclosure
Risk Disclosure
Share
🤖
3


🤖
3
🤖
3
✍️
By Author
More by futuretony
🤖
by futuretony

Free
ThinkOrSwim Indicator
HTF PO3 Indicator For ThinkOrSwim
🔑
🏅
HTF PO3 Indicator For ThinkOrSwim is an Indicator that leverages the ICT Power of 3 concept to analyze market phases by identifying Accumulation, Manipulation and Distribution.

🤖
by futuretony
Free
ThinkOrSwim Indicator
Quarterly Theory For ThinkOrSwim
🔑
✅
Quarterly Theory is a ThinkOrSwim indicator that visualizes and analyzes market cycles through ICT based time cycle concept. The indicator picks up and analyzes distinct cycle phases - accumulation, manipulation, distribution and reversal/continuation.

🤖
by futuretony

Free
ThinkOrSwim Indicator
Naked POC finder For ThinkOrSwim
🔑
✅
Naked POC Finder is a ThinkOrSwim indicator that displays Volume Point of Control (vPOC) for levels where price has not returned yet, using either previous month, week and daily timeframes. Additionally, the indicator displays Value Area (VA) for the selected timeframes.
Load More
🤖
by futuretony
Free
ThinkOrSwim Indicator
HTF PO3 Indicator For ThinkOrSwim
🔑
🏅
HTF PO3 Indicator For ThinkOrSwim is an Indicator that leverages the ICT Power of 3 concept to analyze market phases by identifying Accumulation, Manipulation and Distribution.
🤖
by futuretony
Free
ThinkOrSwim Indicator
Quarterly Theory For ThinkOrSwim
🔑
✅
Quarterly Theory is a ThinkOrSwim indicator that visualizes and analyzes market cycles through ICT based time cycle concept. The indicator picks up and analyzes distinct cycle phases - accumulation, manipulation, distribution and reversal/continuation.
Load More
🔥
New Listings
Featured this week

🤖
by allanster

Free
TradingView Indicator
Growing or Waning Patterns [Alerts]
New
🔑
🌐
Growing or Waning Patterns [Alerts] is a TradingView indicator that detects reversal signals based on three candle body patterns. The patterns are classified as increasing or decreasing depending on bullish and bearish states. Additional features include alerts and trend filter.

📟
Free*
Trade Analytics Platform
TRDR.IO
New
🌐
✅
🏅
TRDR.IO is a crypto orderflow platform providing various tools visualizing crypto exchange order book activity. See bid-ask imbalances, buy and sell demand as well as order book depth in real-time with intuitive visual overlays. Additional features include alerts and scanning crypto markets for orderflow events.

🤖
by LeviathanCapital
Free
TradingView Indicator
Swing Levels and Liquidity - By Leviathan
New
🔑
🌐
✅
Swing Levels and Liquidity is a TradingView Indicator that displays swing high and low levels with volume traded at the pivots. Once formed, these levels likely retain liquidity that traders can expect to produce support and resistance in price when swept.
🤖
by allanster
Free
TradingView Indicator
Growing or Waning Patterns [Alerts]
New
🔑
🌐
Growing or Waning Patterns [Alerts] is a TradingView indicator that detects reversal signals based on three candle body patterns. The patterns are classified as increasing or decreasing depending on bullish and bearish states. Additional features include alerts and trend filter.
📟
Free*
Trade Analytics Platform
TRDR.IO
New
🌐
✅
🏅
TRDR.IO is a crypto orderflow platform providing various tools visualizing crypto exchange order book activity. See bid-ask imbalances, buy and sell demand as well as order book depth in real-time with intuitive visual overlays. Additional features include alerts and scanning crypto markets for orderflow events.
Load More
🤖
Similar Listings
Traders also viewed
All


🤖
by ziongotoptions
Free
ThinkOrSwim Indicator
Option Heatmap and OI Strikes For ThinkOrSwim
🔑
🌐
✅
Option Heatmap and OI Strikes For ThinkOrSwim is a ThinkOrSwim Indicator that visualizes option volume and open interest through heatmaps with added ADX to analyze trend strength.

🤖
by tiredoflosing
Free
ThinkOrSwim Indicator
NextSignal's Market Volume Profile For ThinkOrSwim
🔑
🌐
✅
NextSignal's Market Volume Profile is a ThinkOrSwim indicator that displays key orderflow levels overlayed on top for each candle, volume point of control (VPOC) and time point of control (TPOC).

🤖
by cwparker23
Free
ThinkOrSwim Indicator
Buy Sell Pressure Candle Overlay For ThinkOrSwim
🔑
🌐
🏅
Buy Sell Pressure Candle Overlay for ThinkOrSwim is an indicator that visualizes buying and selling pressure on candlestick charts in a simple meter format, allowing an easy glance at dominating side for given candle.

🤖
by markos
Free
ThinkOrSwim Indicator
Market Profile (TPOProfile) Monkey Bars For ThinkOrSwim
🔑
🌐
✅
Market Profile (TPOProfile) Monkey Bars for ThinkorSwim is a free ThinkorSwim indicator that combines Time Price Opportunity and Monkey Bars studies to map time and price opportunities for classical orderflow analysis. Includes value area and an easy distinction of points of control (POC).

🤖
by sudoshu
Free
ThinkOrSwim Indicator
OptionsHacker - Volume/Open Interest/Gamma
🔑
🌐
✅
OptionsHacker is a ThinkOrSwim indicator that scans the options chain to display volume, open interest and estimated gamma exposure for multiple assets. Monitor and analyze unusual options activity using this indicator.

🤖
by samer800
Free
ThinkOrSwim Indicator
Fair value bands For ThinkOrSwim
🔑
🌐
✅
Fair value bands for ThinkOrSwim utilizes dynamic price bands to detect normal and abnormal price behavior by gauging divergence from the mean. Smooth and reliable price bands without repainting.

🤖
by gilda
Free
ThinkOrSwim Indicator
Volume Profile Indicator & POCs For ThinkOrSwim
🔑
🌐
✅
Volume Profile Indicator & POCs For ThinkOrSwim displays how prices moved during the trading day using time and volume distribution. This indicator offers a variety of customizable settings like switching profile type and adjusting price per row height.

🤖
by tiredoflosing
Free
ThinkOrSwim Indicator
NextSignals Aggressive Buy & Sell Pressure Volume For ThinkOrSwim
🔑
✅
NextSignals Aggressive Buy & Sell Pressure Volume is a free ThinkOrSwim indicator that analyzes volume data and closing price to identify aggressive buying and selling pressure, associated with new trends and reversals in price.

🤖
by benten
Free
ThinkOrSwim Indicator
Volume Reversal Model For ThinkOrSwim
🔑
🏅
The Volume Reversal Model for ThinkorSwim is a free indicator that identifies potential reversals using unusual volume patterns, displayed as simple arrows and colored candles.

🤖
by benten
Free
ThinkOrSwim Indicator
Market Value Areas Indicator For ThinkOrSwim
🔑
🌐
✅
🏅
Market Value Areas Indicator for ThinkorSwim is an Indicator utilizing Market Profile to detect high-volume trading areas within candles. Features additional features like value area, a price-in-value-area scanner, volume spike detection and more.

🤖
by benten
Free
ThinkOrSwim Indicator
Unusual Volume For ThinkOrSwim
🔑
🌐
✅
🏅
Unusual Volume For ThinkOrSwim is a ThinkOrSwim Indicator and scanner that identifies stocks with significant and sudden changes in trading volume, helping users detect unusual volume activity and its implications for price action.

🤖
by samer800
Free
ThinkOrSwim Indicator
L3 Banker Fund Flow Trend Oscillator For ThinkOrSwim
🔑
🌐
🏅
The L3 Banker Fund Flow Trend Oscillator is a ThinkOrSwim Indicator that tracks the buying and selling activities of large institutional investors, or "whales," to identify where high value orders are creating buy or sell pressure.

🤖
by benten
Free
ThinkOrSwim Indicator
Price Volume Divergence Indicator For ThinkOrSwim
🔑
🌐
🏅
The Price Volume Divergence Indicator for ThinkorSwim detects bullish and bearish divergences in price and volume, signaling potential market reversals.
🤖
by futuretony
Free
ThinkOrSwim Indicator
Naked POC finder For ThinkOrSwim
🔑
✅
Naked POC Finder is a ThinkOrSwim indicator that displays Volume Point of Control (vPOC) for levels where price has not returned yet, using either previous month, week and daily timeframes. Additionally, the indicator displays Value Area (VA) for the selected timeframes.

🤖
by benten
Free
ThinkOrSwim Indicator
Time Weighted Average Price (TWAP) Indicator For ThinkOrSwim
🔑
🌐
✅
Time Weighted Average Price (TWAP) is a ThinkOrSwim indicator that calculates average price based on time. Similar to volume weighted average price (VWAP), TWAP aims to keep track of fair value in a given market.

🤖
by benten
Free
ThinkOrSwim Indicator
Intraday VWAP Reversion Indicator For ThinkOrSwim
🔑
🌐
🏅
The Intraday VWAP Reversion Indicator for ThinkorSwim is an Indicator based on a mean reversion strategy using VWAP and ATR, generating signals when the closing price deviates from VWAP by more than a user-defined threshold.

🤖
by samer800
Free
ThinkOrSwim Indicator
VWAP Oscillator (Normalized)
🔑
✅
🏅
VWAP Oscillator (Normalized) is an Indicator for ThinkOrSwim that calculates VWAP using both volume and price data to display the information in a normalized oscillator format.

🤖
by samer800
Free
ThinkOrSwim Indicator
Volume Divergence VN For ThinkOrSwim
🔑
🌐
🏅
Volume Divergence VN for ThinkOrSwim is an indicator that uses weighted moving averages of trading volume to identify discrepancies between volume and price movements for potential shifts in trend direction.

🤖
by redtogreen
Free
ThinkOrSwim Indicator
Working Volume Indicator for Range/Renko Bars
🔑
🌐
Working Volume Indicator for Range/Renko Bars is a ThinkOrSwim indicator that visualizes volume fluctuations on Range and Renko bars by combining multiple indicators.
🤖
by ziongotoptions
Free
ThinkOrSwim Indicator
Option Heatmap and OI Strikes For ThinkOrSwim
🔑
🌐
✅
Option Heatmap and OI Strikes For ThinkOrSwim is a ThinkOrSwim Indicator that visualizes option volume and open interest through heatmaps with added ADX to analyze trend strength.
🤖
by tiredoflosing
Free
ThinkOrSwim Indicator
NextSignal's Market Volume Profile For ThinkOrSwim
🔑
🌐
✅
NextSignal's Market Volume Profile is a ThinkOrSwim indicator that displays key orderflow levels overlayed on top for each candle, volume point of control (VPOC) and time point of control (TPOC).
🤖
by cwparker23
Free
ThinkOrSwim Indicator
Buy Sell Pressure Candle Overlay For ThinkOrSwim
🔑
🌐
🏅
Buy Sell Pressure Candle Overlay for ThinkOrSwim is an indicator that visualizes buying and selling pressure on candlestick charts in a simple meter format, allowing an easy glance at dominating side for given candle.
🤖
by markos
Free
ThinkOrSwim Indicator
Market Profile (TPOProfile) Monkey Bars For ThinkOrSwim
🔑
🌐
✅
Market Profile (TPOProfile) Monkey Bars for ThinkorSwim is a free ThinkorSwim indicator that combines Time Price Opportunity and Monkey Bars studies to map time and price opportunities for classical orderflow analysis. Includes value area and an easy distinction of points of control (POC).
🤖
by sudoshu
Free
ThinkOrSwim Indicator
OptionsHacker - Volume/Open Interest/Gamma
🔑
🌐
✅
OptionsHacker is a ThinkOrSwim indicator that scans the options chain to display volume, open interest and estimated gamma exposure for multiple assets. Monitor and analyze unusual options activity using this indicator.
🤖
by samer800
Free
ThinkOrSwim Indicator
Fair value bands For ThinkOrSwim
🔑
🌐
✅
Fair value bands for ThinkOrSwim utilizes dynamic price bands to detect normal and abnormal price behavior by gauging divergence from the mean. Smooth and reliable price bands without repainting.
🤖
by gilda
Free
ThinkOrSwim Indicator
Volume Profile Indicator & POCs For ThinkOrSwim
🔑
🌐
✅
Volume Profile Indicator & POCs For ThinkOrSwim displays how prices moved during the trading day using time and volume distribution. This indicator offers a variety of customizable settings like switching profile type and adjusting price per row height.
🤖
by tiredoflosing
Free
ThinkOrSwim Indicator
NextSignals Aggressive Buy & Sell Pressure Volume For ThinkOrSwim
🔑
✅
NextSignals Aggressive Buy & Sell Pressure Volume is a free ThinkOrSwim indicator that analyzes volume data and closing price to identify aggressive buying and selling pressure, associated with new trends and reversals in price.
🤖
by benten
Free
ThinkOrSwim Indicator
Volume Reversal Model For ThinkOrSwim
🔑
🏅
The Volume Reversal Model for ThinkorSwim is a free indicator that identifies potential reversals using unusual volume patterns, displayed as simple arrows and colored candles.
🤖
by benten
Free
ThinkOrSwim Indicator
Market Value Areas Indicator For ThinkOrSwim
🔑
🌐
✅
🏅
Market Value Areas Indicator for ThinkorSwim is an Indicator utilizing Market Profile to detect high-volume trading areas within candles. Features additional features like value area, a price-in-value-area scanner, volume spike detection and more.
Discover trading edge
Discover trading edge
Indicators, Platforms & Education
Indicators, Platforms & Education
TradersList
Discover trading edge
Join Telegram
Weekly listings
Join Telegram
Disclaimer
Our goal is to achieve greater transparency, guidance and safety in trading and investing by providing means to discover, research and discuss trading/investing related sites/services.
Content provided on this site is not financial advice, meant for educational purposes only. TradersList does not endorse or guarantee any result for listed sites/services. Do your own research.
Read full disclaimer
TradersList
Discover trading edge
Join Telegram
Disclaimer
Our goal is to achieve greater transparency, guidance and safety in trading and investing by providing means to discover, research and discuss trading/investing related sites/services.
Content provided on this site is not financial advice, meant for educational purposes only. TradersList does not endorse or guarantee any result for listed sites/services. Do your own research.
Read full disclaimer