

From TradersList Editors
From TradersList Editors
Enhance your trading strategy with visual insights into market dynamics using TPO and Monkey Bars to spot trends and crucial price levels.
Enhance your trading strategy with visual insights into market dynamics using TPO and Monkey Bars to spot trends and crucial price levels.


ThinkOrSwim Indicator
ThinkOrSwim Indicator
Market Profile TPO Monkey Bars Indicator for ThinkOrSwim: Volume and Price Analysis Tool
Market Profile TPO Monkey Bars Indicator for ThinkOrSwim: Volume and Price Analysis Tool

by markos on ThinkOrSwim
by markos on ThinkOrSwim
🤖
🤖
Market Profile (TPOProfile) Monkey Bars For ThinkOrSwim
Market Profile (TPOProfile) Monkey Bars For ThinkOrSwim
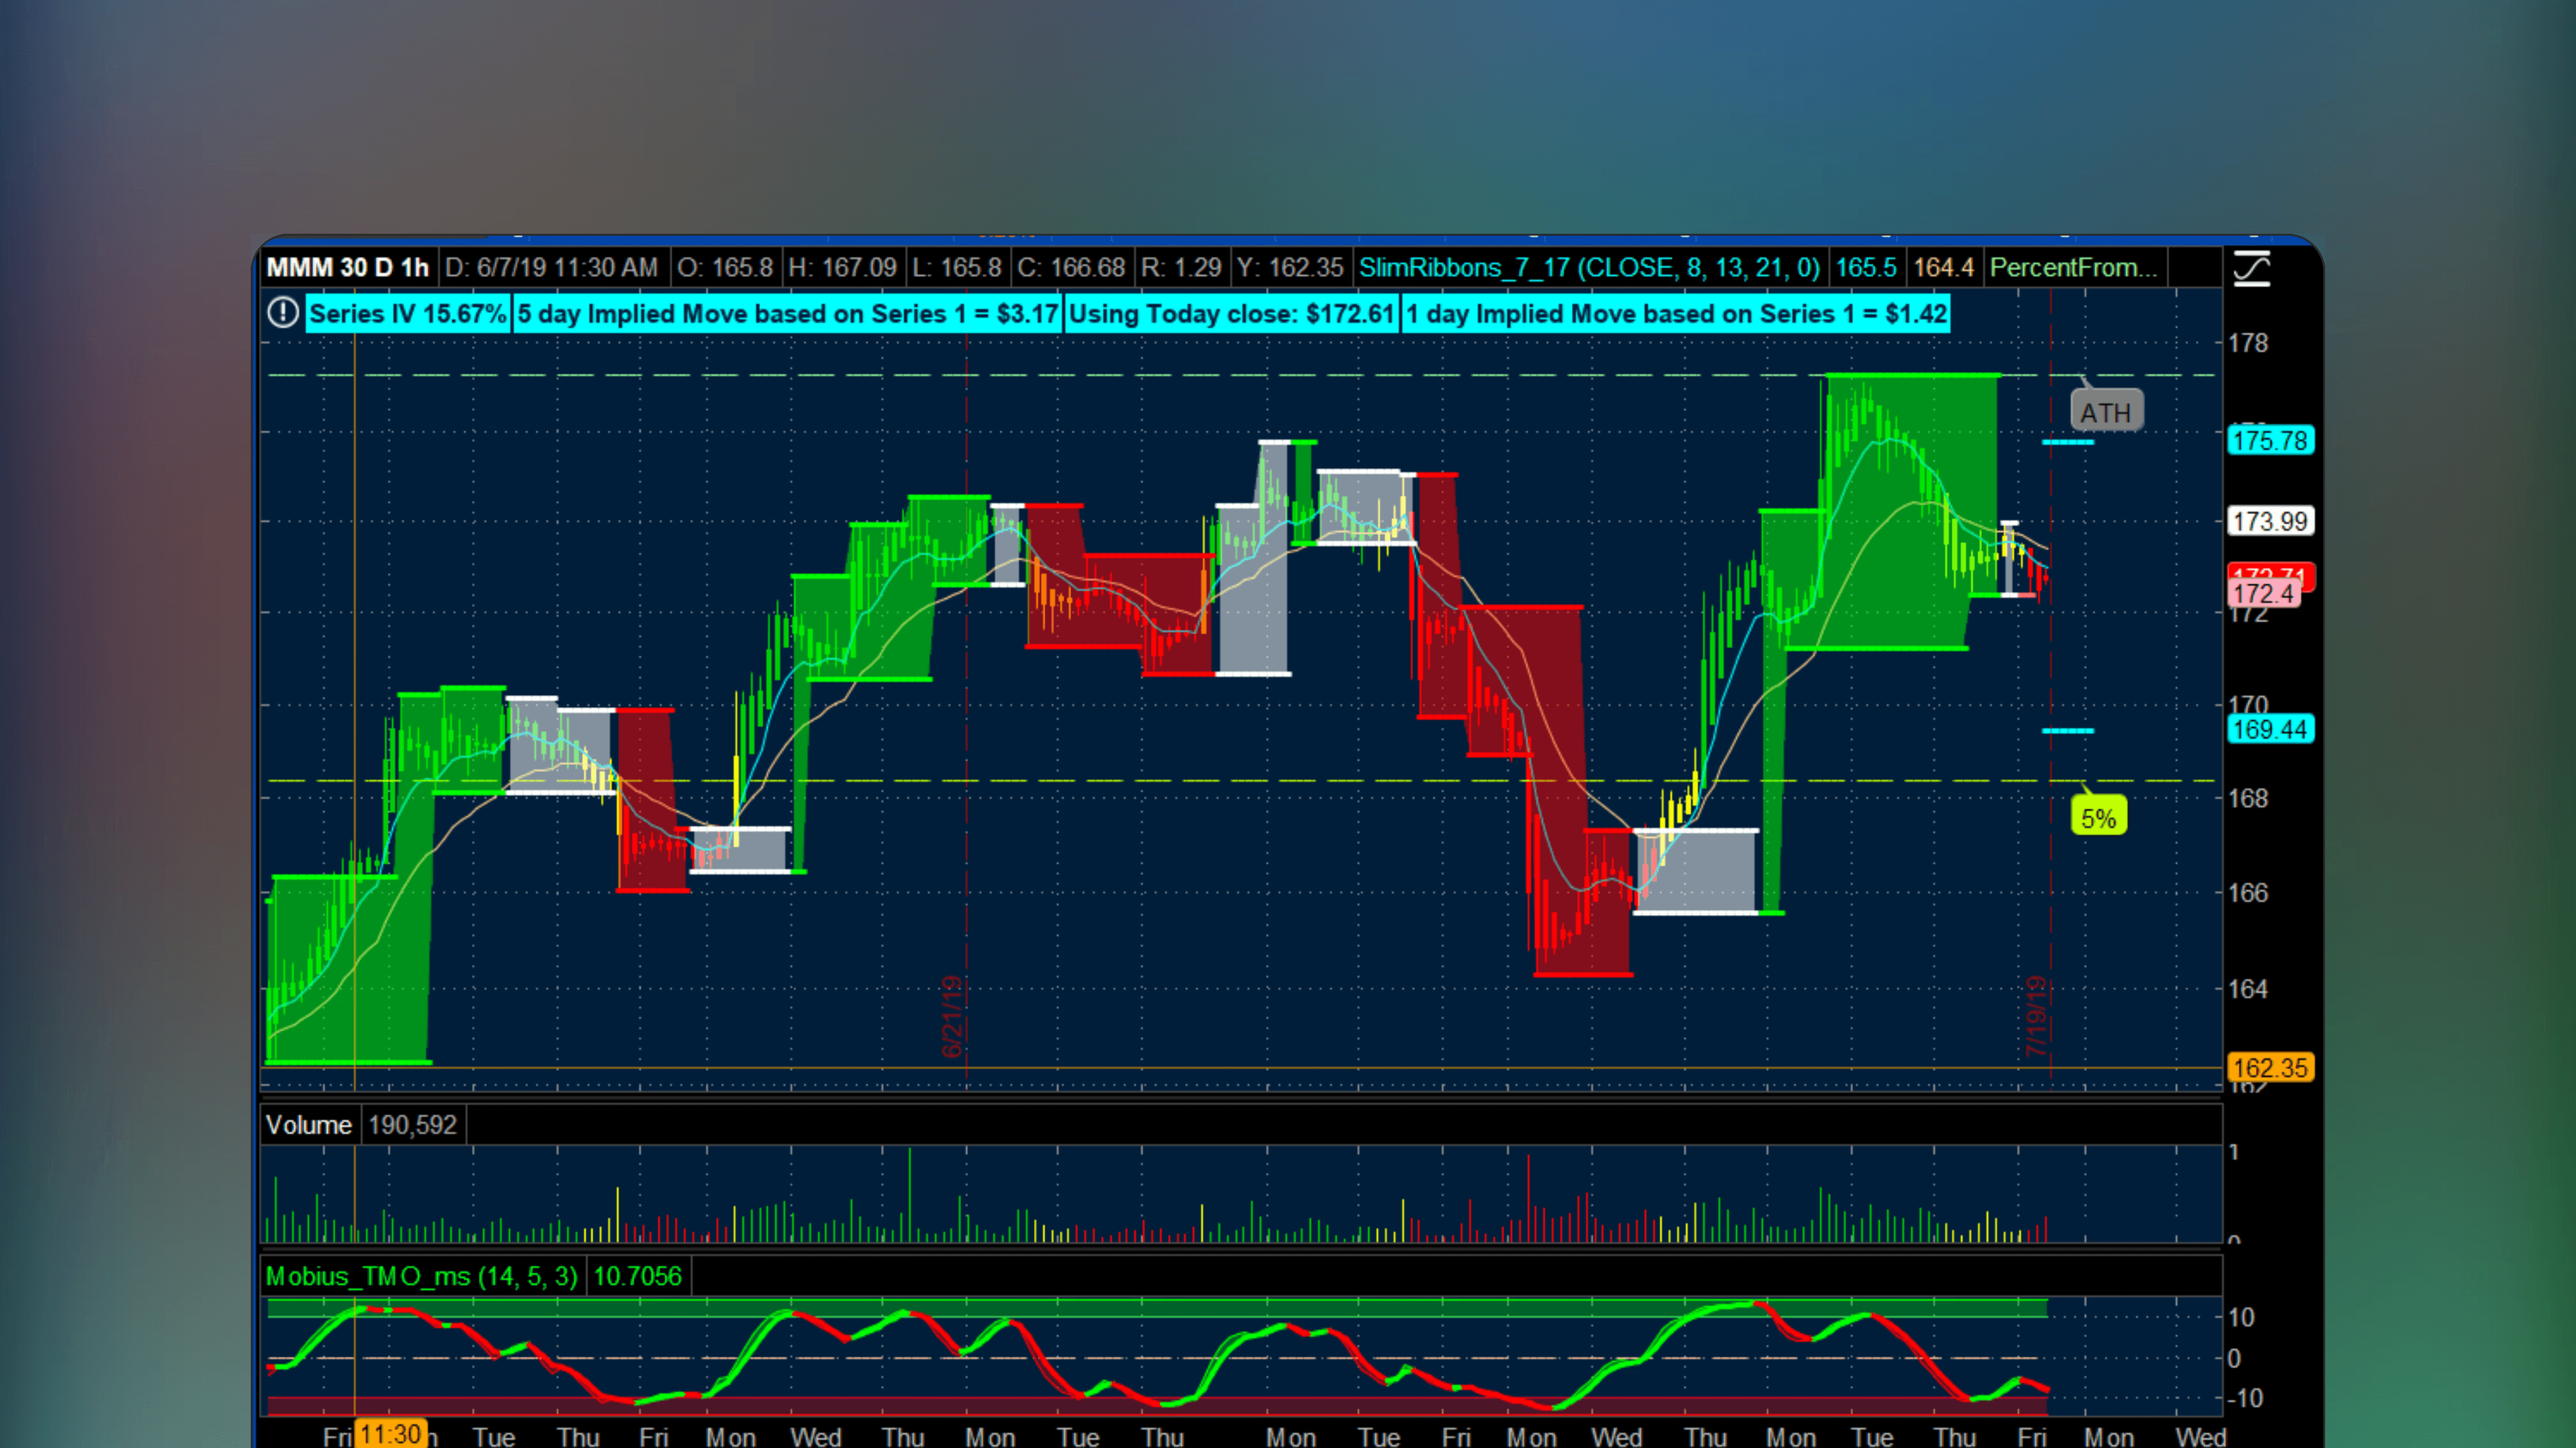
Market Profile (TPOProfile) Monkey Bars for ThinkorSwim is a free ThinkorSwim indicator that combines Time Price Opportunity and Monkey Bars studies to map time and price opportunities for classical orderflow analysis. Includes value area and an easy distinction of points of control (POC).
Market Profile (TPOProfile) Monkey Bars for ThinkorSwim is a free ThinkorSwim indicator that combines Time Price Opportunity and Monkey Bars studies to map time and price opportunities for classical orderflow analysis. Includes value area and an easy distinction of points of control (POC).
Get on ThinkOrSwim
This indicator is available on ThinkOrSwim charting platform. Signing up for a free account and downloading ThinkOrSwim software is required.
Get on ThinkOrSwim
This indicator is available on ThinkOrSwim charting platform. Signing up for a free account and downloading ThinkOrSwim software is required.
🔑
Open Source
Listing has publically available source code that can be audited and modified as needed.
🔑
Open Source
Listing has publically available source code that can be audited and modified as needed.
💸
Free Access
All features of this listing are fully free to use with no pricing tiers. Simply start using.
💸
Free Access
All features of this listing are fully free to use with no pricing tiers. Simply start using.
✅
Robust Theory
Concepts and theories mentioned in listing are based on generally approved and well established notions.
✅
Robust Theory
Concepts and theories mentioned in listing are based on generally approved and well established notions.
🌐
Popular Topic
Concepts and theories mentioned in listing are popular topics in web search
🌐
Popular Topic
Concepts and theories mentioned in listing are popular topics in web search
Published by markos on ThinkOrSwim
Published by markos on ThinkOrSwim
Time Price Opportunity and Monkey Bars Combined
This indicator merges two classic profile tools into one. TPO maps the distribution of time at each price level using letter blocks, while Monkey Bars add visual clarity by highlighting key structural zones. Together, they provide a comprehensive orderflow framework directly on ThinkOrSwim charts.
Value Area Identification
The Value Area represents where approximately 70% of trading activity concentrated during a session. Price opening inside the prior Value Area suggests balance - expect rotation. Opening outside signals an imbalance that often leads to directional moves as the market seeks new equilibrium.


Point of Control (POC) as Fair Value
The POC marks the single price level with the most time spent - the session's fair value. Naked POCs from prior sessions that were never revisited act as magnets. When price approaches these untested levels days later, traders anticipate reactions because the market has unfinished business there.
Classical Orderflow Application
Market Profile is the foundation of classical orderflow trading. By reading the shape of the distribution - whether it forms a normal bell curve, a double distribution or a trending profile - traders identify the market type for the session and apply the appropriate strategy before the day unfolds.
Market profile equipped with everything essential
Market profile equipped with everything essential
This indicator merges TPO mapping with Monkey Bars visual clarity into one tool. Time-at-price distribution combined with key structural zone highlighting provides a comprehensive orderflow framework directly on ThinkOrSwim charts.
This indicator merges TPO mapping with Monkey Bars visual clarity into one tool. Time-at-price distribution combined with key structural zone highlighting provides a comprehensive orderflow framework directly on ThinkOrSwim charts.
Apply Classical Orderflow Analysis
Reading the distribution shape identifies the market type for the session. Normal bell curves versus trending profiles inform which strategy to apply.
Identify Unfinished Auction Business
Naked POCs from prior sessions that were never revisited act as magnets. When price approaches these untested levels, reactions are anticipated.
Reference POC and Value Area Levels
Price opening inside the prior Value Area suggests balance and rotation. Opening outside signals an imbalance likely leading to directional moves.
Common Questions About Market Profile and TPO Charts
Common Questions About Market Profile and TPO Charts
Market Profile organizes price and time to reveal where the market finds fair value and where imbalances exist. These questions address the core concepts that confuse traders new to TPO analysis and value area interpretation.
Market Profile organizes price and time to reveal where the market finds fair value and where imbalances exist. These questions address the core concepts that confuse traders new to TPO analysis and value area interpretation.
What is the difference between Point of Control and Value Area?
The Point of Control (POC) is the single price level where the most time was spent during a session. The Value Area encompasses the range around the POC containing 70% of trading activity. Think of POC as the fairest price and Value Area as the fair price zone.
How do I trade using Value Area High and Low levels?
Price opening outside the Value Area often attempts to return inside. Opening inside often tests the extremes. VAH acts as resistance when price approaches from below and VAL acts as support from above. Rejection at these levels provides entry opportunities.
Why does the TPO profile sometimes look very different from the volume profile?
TPO measures time spent at each level while volume profile measures contracts traded. A level can have high volume in minutes but low TPO count. Conversely, price can sit at a level for hours with minimal volume. Both perspectives reveal different aspects of acceptance.
🌐
🌐
Web sentiment
Web sentiment
Traders view Market Profile Monkey Bars for ThinkorSwim positively, praising its utility, customizability, and effectiveness, reflecting high user satisfaction and a supportive community.
Traders view Market Profile Monkey Bars for ThinkorSwim positively, praising its utility, customizability, and effectiveness, reflecting high user satisfaction and a supportive community.
Source: Online Discussion
Source: Online Discussion
Source: Online Discussion
✍️
✍️
TradersList Reviews (6)
TradersList Reviews (6)
TradersList Community has given this listing four stars, indicating a well trusted listing with great utility value. This listing is one of the better ones on TradersList.
TradersList Community has given this listing four stars, indicating a well trusted listing with great utility value. This listing is one of the better ones on TradersList.
⭐️
⭐️
⭐️
⭐️
⭐️
Source: TradersList Reviews
Source: TradersList Reviews


Bookmark
Saved here
🤖
Get Indicator
Find Indicator
Review
Review Indicator
✍️
⭐️
⭐️
⭐️
⭐️
⭐️
3
Comments
Read on Telegram
Listing by third party publisher. Not financial advice.
Risk Disclosure


Share Listing
🤖
🤖
Get Indicator
Get Indicator
Find Indicator
Find Indicator
✍️
Review
Review
Review Indicator
Review Indicator
⭐️
⭐️
⭐️
⭐️
⭐️
Saved here
Bookmark
Listing by third party publisher. Not financial advice.
Listing by third party publisher. Not financial advice.
Risk Disclosure
Risk Disclosure
Share
🤖
3


🤖
3
🤖
3
✍️
By Author
More by markos

🤖
by markos

Free
ThinkOrSwim Indicator
Sector Rotation Indicator For ThinkOrSwim
🔑
🌐
✅
Sector Rotation is a ThinkorSwim indicator that visually analyzes shifting investment allocations between sectors, revealing outperforming and underperforming themes.
🤖
by markos

Free
ThinkOrSwim Indicator
Fractal Boxes by Mobius For ThinkOrSwim
🔑
Fractal Boxes by Mobius for ThinkorSwim is an indicator that uses altered fractals to identify and highlight market states, such as breakouts, consolidation and trends up/down.
🔥
New Listings
Featured this week

🤖
by allanster

Free
TradingView Indicator
Growing or Waning Patterns [Alerts]
New
🔑
🌐
Growing or Waning Patterns [Alerts] is a TradingView indicator that detects reversal signals based on three candle body patterns. The patterns are classified as increasing or decreasing depending on bullish and bearish states. Additional features include alerts and trend filter.

📟
Free*
Trade Analytics Platform
TRDR.IO
New
🌐
✅
🏅
TRDR.IO is a crypto orderflow platform providing various tools visualizing crypto exchange order book activity. See bid-ask imbalances, buy and sell demand as well as order book depth in real-time with intuitive visual overlays. Additional features include alerts and scanning crypto markets for orderflow events.

🤖
by LeviathanCapital
Free
TradingView Indicator
Swing Levels and Liquidity - By Leviathan
New
🔑
🌐
✅
Swing Levels and Liquidity is a TradingView Indicator that displays swing high and low levels with volume traded at the pivots. Once formed, these levels likely retain liquidity that traders can expect to produce support and resistance in price when swept.
🤖
by allanster
Free
TradingView Indicator
Growing or Waning Patterns [Alerts]
New
🔑
🌐
Growing or Waning Patterns [Alerts] is a TradingView indicator that detects reversal signals based on three candle body patterns. The patterns are classified as increasing or decreasing depending on bullish and bearish states. Additional features include alerts and trend filter.
📟
Free*
Trade Analytics Platform
TRDR.IO
New
🌐
✅
🏅
TRDR.IO is a crypto orderflow platform providing various tools visualizing crypto exchange order book activity. See bid-ask imbalances, buy and sell demand as well as order book depth in real-time with intuitive visual overlays. Additional features include alerts and scanning crypto markets for orderflow events.
Load More
🤖
Similar Listings
Traders also viewed
All


🤖
by ziongotoptions

Free
ThinkOrSwim Indicator
Option Heatmap and OI Strikes For ThinkOrSwim
🔑
🌐
✅
Option Heatmap and OI Strikes For ThinkOrSwim is a ThinkOrSwim Indicator that visualizes option volume and open interest through heatmaps with added ADX to analyze trend strength.

🤖
by tiredoflosing
Free
ThinkOrSwim Indicator
NextSignal's Market Volume Profile For ThinkOrSwim
🔑
🌐
✅
NextSignal's Market Volume Profile is a ThinkOrSwim indicator that displays key orderflow levels overlayed on top for each candle, volume point of control (VPOC) and time point of control (TPOC).

🤖
by cwparker23
Free
ThinkOrSwim Indicator
Buy Sell Pressure Candle Overlay For ThinkOrSwim
🔑
🌐
🏅
Buy Sell Pressure Candle Overlay for ThinkOrSwim is an indicator that visualizes buying and selling pressure on candlestick charts in a simple meter format, allowing an easy glance at dominating side for given candle.

🤖
by sudoshu
Free
ThinkOrSwim Indicator
OptionsHacker - Volume/Open Interest/Gamma
🔑
🌐
✅
OptionsHacker is a ThinkOrSwim indicator that scans the options chain to display volume, open interest and estimated gamma exposure for multiple assets. Monitor and analyze unusual options activity using this indicator.

🤖
by samer800
Free
ThinkOrSwim Indicator
Fair value bands For ThinkOrSwim
🔑
🌐
✅
Fair value bands for ThinkOrSwim utilizes dynamic price bands to detect normal and abnormal price behavior by gauging divergence from the mean. Smooth and reliable price bands without repainting.

🤖
by gilda
Free
ThinkOrSwim Indicator
Volume Profile Indicator & POCs For ThinkOrSwim
🔑
🌐
✅
Volume Profile Indicator & POCs For ThinkOrSwim displays how prices moved during the trading day using time and volume distribution. This indicator offers a variety of customizable settings like switching profile type and adjusting price per row height.

🤖
by tiredoflosing
Free
ThinkOrSwim Indicator
NextSignals Aggressive Buy & Sell Pressure Volume For ThinkOrSwim
🔑
✅
NextSignals Aggressive Buy & Sell Pressure Volume is a free ThinkOrSwim indicator that analyzes volume data and closing price to identify aggressive buying and selling pressure, associated with new trends and reversals in price.

🤖
by benten
Free
ThinkOrSwim Indicator
Volume Reversal Model For ThinkOrSwim
🔑
🏅
The Volume Reversal Model for ThinkorSwim is a free indicator that identifies potential reversals using unusual volume patterns, displayed as simple arrows and colored candles.

🤖
by benten
Free
ThinkOrSwim Indicator
Market Value Areas Indicator For ThinkOrSwim
🔑
🌐
✅
🏅
Market Value Areas Indicator for ThinkorSwim is an Indicator utilizing Market Profile to detect high-volume trading areas within candles. Features additional features like value area, a price-in-value-area scanner, volume spike detection and more.

🤖
by benten
Free
ThinkOrSwim Indicator
Unusual Volume For ThinkOrSwim
🔑
🌐
✅
🏅
Unusual Volume For ThinkOrSwim is a ThinkOrSwim Indicator and scanner that identifies stocks with significant and sudden changes in trading volume, helping users detect unusual volume activity and its implications for price action.

🤖
by samer800
Free
ThinkOrSwim Indicator
L3 Banker Fund Flow Trend Oscillator For ThinkOrSwim
🔑
🌐
🏅
The L3 Banker Fund Flow Trend Oscillator is a ThinkOrSwim Indicator that tracks the buying and selling activities of large institutional investors, or "whales," to identify where high value orders are creating buy or sell pressure.

🤖
by futuretony
Free
ThinkOrSwim Indicator
Opening Range Indicator with Measured Moves and VWAP For ThinkOrSwim
🔑
🌐
🏅
The Opening Range Indicator with Measured Moves and VWAP for ThinkOrSwim highlights selected market events during a set period, plotting key levels and VWAP to track fair value and high probability price levels.

🤖
by benten
Free
ThinkOrSwim Indicator
Price Volume Divergence Indicator For ThinkOrSwim
🔑
🌐
🏅
The Price Volume Divergence Indicator for ThinkorSwim detects bullish and bearish divergences in price and volume, signaling potential market reversals.

🤖
by futuretony
Free
ThinkOrSwim Indicator
Naked POC finder For ThinkOrSwim
🔑
✅
Naked POC Finder is a ThinkOrSwim indicator that displays Volume Point of Control (vPOC) for levels where price has not returned yet, using either previous month, week and daily timeframes. Additionally, the indicator displays Value Area (VA) for the selected timeframes.

🤖
by benten
Free
ThinkOrSwim Indicator
Time Weighted Average Price (TWAP) Indicator For ThinkOrSwim
🔑
🌐
✅
Time Weighted Average Price (TWAP) is a ThinkOrSwim indicator that calculates average price based on time. Similar to volume weighted average price (VWAP), TWAP aims to keep track of fair value in a given market.

🤖
by benten
Free
ThinkOrSwim Indicator
Intraday VWAP Reversion Indicator For ThinkOrSwim
🔑
🌐
🏅
The Intraday VWAP Reversion Indicator for ThinkorSwim is an Indicator based on a mean reversion strategy using VWAP and ATR, generating signals when the closing price deviates from VWAP by more than a user-defined threshold.

🤖
by samer800
Free
ThinkOrSwim Indicator
VWAP Oscillator (Normalized)
🔑
✅
🏅
VWAP Oscillator (Normalized) is an Indicator for ThinkOrSwim that calculates VWAP using both volume and price data to display the information in a normalized oscillator format.

🤖
by samer800
Free
ThinkOrSwim Indicator
Volume Divergence VN For ThinkOrSwim
🔑
🌐
🏅
Volume Divergence VN for ThinkOrSwim is an indicator that uses weighted moving averages of trading volume to identify discrepancies between volume and price movements for potential shifts in trend direction.

🤖
by redtogreen
Free
ThinkOrSwim Indicator
Working Volume Indicator for Range/Renko Bars
🔑
🌐
Working Volume Indicator for Range/Renko Bars is a ThinkOrSwim indicator that visualizes volume fluctuations on Range and Renko bars by combining multiple indicators.
🤖
by ziongotoptions
Free
ThinkOrSwim Indicator
Option Heatmap and OI Strikes For ThinkOrSwim
🔑
🌐
✅
Option Heatmap and OI Strikes For ThinkOrSwim is a ThinkOrSwim Indicator that visualizes option volume and open interest through heatmaps with added ADX to analyze trend strength.
🤖
by tiredoflosing
Free
ThinkOrSwim Indicator
NextSignal's Market Volume Profile For ThinkOrSwim
🔑
🌐
✅
NextSignal's Market Volume Profile is a ThinkOrSwim indicator that displays key orderflow levels overlayed on top for each candle, volume point of control (VPOC) and time point of control (TPOC).
🤖
by cwparker23
Free
ThinkOrSwim Indicator
Buy Sell Pressure Candle Overlay For ThinkOrSwim
🔑
🌐
🏅
Buy Sell Pressure Candle Overlay for ThinkOrSwim is an indicator that visualizes buying and selling pressure on candlestick charts in a simple meter format, allowing an easy glance at dominating side for given candle.
🤖
by sudoshu
Free
ThinkOrSwim Indicator
OptionsHacker - Volume/Open Interest/Gamma
🔑
🌐
✅
OptionsHacker is a ThinkOrSwim indicator that scans the options chain to display volume, open interest and estimated gamma exposure for multiple assets. Monitor and analyze unusual options activity using this indicator.
🤖
by samer800
Free
ThinkOrSwim Indicator
Fair value bands For ThinkOrSwim
🔑
🌐
✅
Fair value bands for ThinkOrSwim utilizes dynamic price bands to detect normal and abnormal price behavior by gauging divergence from the mean. Smooth and reliable price bands without repainting.
🤖
by gilda
Free
ThinkOrSwim Indicator
Volume Profile Indicator & POCs For ThinkOrSwim
🔑
🌐
✅
Volume Profile Indicator & POCs For ThinkOrSwim displays how prices moved during the trading day using time and volume distribution. This indicator offers a variety of customizable settings like switching profile type and adjusting price per row height.
🤖
by tiredoflosing
Free
ThinkOrSwim Indicator
NextSignals Aggressive Buy & Sell Pressure Volume For ThinkOrSwim
🔑
✅
NextSignals Aggressive Buy & Sell Pressure Volume is a free ThinkOrSwim indicator that analyzes volume data and closing price to identify aggressive buying and selling pressure, associated with new trends and reversals in price.
🤖
by benten
Free
ThinkOrSwim Indicator
Volume Reversal Model For ThinkOrSwim
🔑
🏅
The Volume Reversal Model for ThinkorSwim is a free indicator that identifies potential reversals using unusual volume patterns, displayed as simple arrows and colored candles.
🤖
by benten
Free
ThinkOrSwim Indicator
Market Value Areas Indicator For ThinkOrSwim
🔑
🌐
✅
🏅
Market Value Areas Indicator for ThinkorSwim is an Indicator utilizing Market Profile to detect high-volume trading areas within candles. Features additional features like value area, a price-in-value-area scanner, volume spike detection and more.
🤖
by benten
Free
ThinkOrSwim Indicator
Unusual Volume For ThinkOrSwim
🔑
🌐
✅
🏅
Unusual Volume For ThinkOrSwim is a ThinkOrSwim Indicator and scanner that identifies stocks with significant and sudden changes in trading volume, helping users detect unusual volume activity and its implications for price action.
Discover trading edge
Discover trading edge
Indicators, Platforms & Education
Indicators, Platforms & Education
TradersList
Discover trading edge
Join Telegram
Weekly listings
Join Telegram
Disclaimer
Our goal is to achieve greater transparency, guidance and safety in trading and investing by providing means to discover, research and discuss trading/investing related sites/services.
Content provided on this site is not financial advice, meant for educational purposes only. TradersList does not endorse or guarantee any result for listed sites/services. Do your own research.
Read full disclaimer
TradersList
Discover trading edge
Join Telegram
Disclaimer
Our goal is to achieve greater transparency, guidance and safety in trading and investing by providing means to discover, research and discuss trading/investing related sites/services.
Content provided on this site is not financial advice, meant for educational purposes only. TradersList does not endorse or guarantee any result for listed sites/services. Do your own research.
Read full disclaimer