

From TradersList Editors
From TradersList Editors
Utilize Finviz Screener to filter stocks through 60+ criteria, spot trends with visual tools, and manage portfolios in real-time.
Utilize Finviz Screener to filter stocks through 60+ criteria, spot trends with visual tools, and manage portfolios in real-time.

Trade Analytics Platform
Trade Analytics Platform
Finviz Screener: Stock Screening with Charts, Maps, and Technical Analysis
Finviz Screener: Stock Screening with Charts, Maps, and Technical Analysis

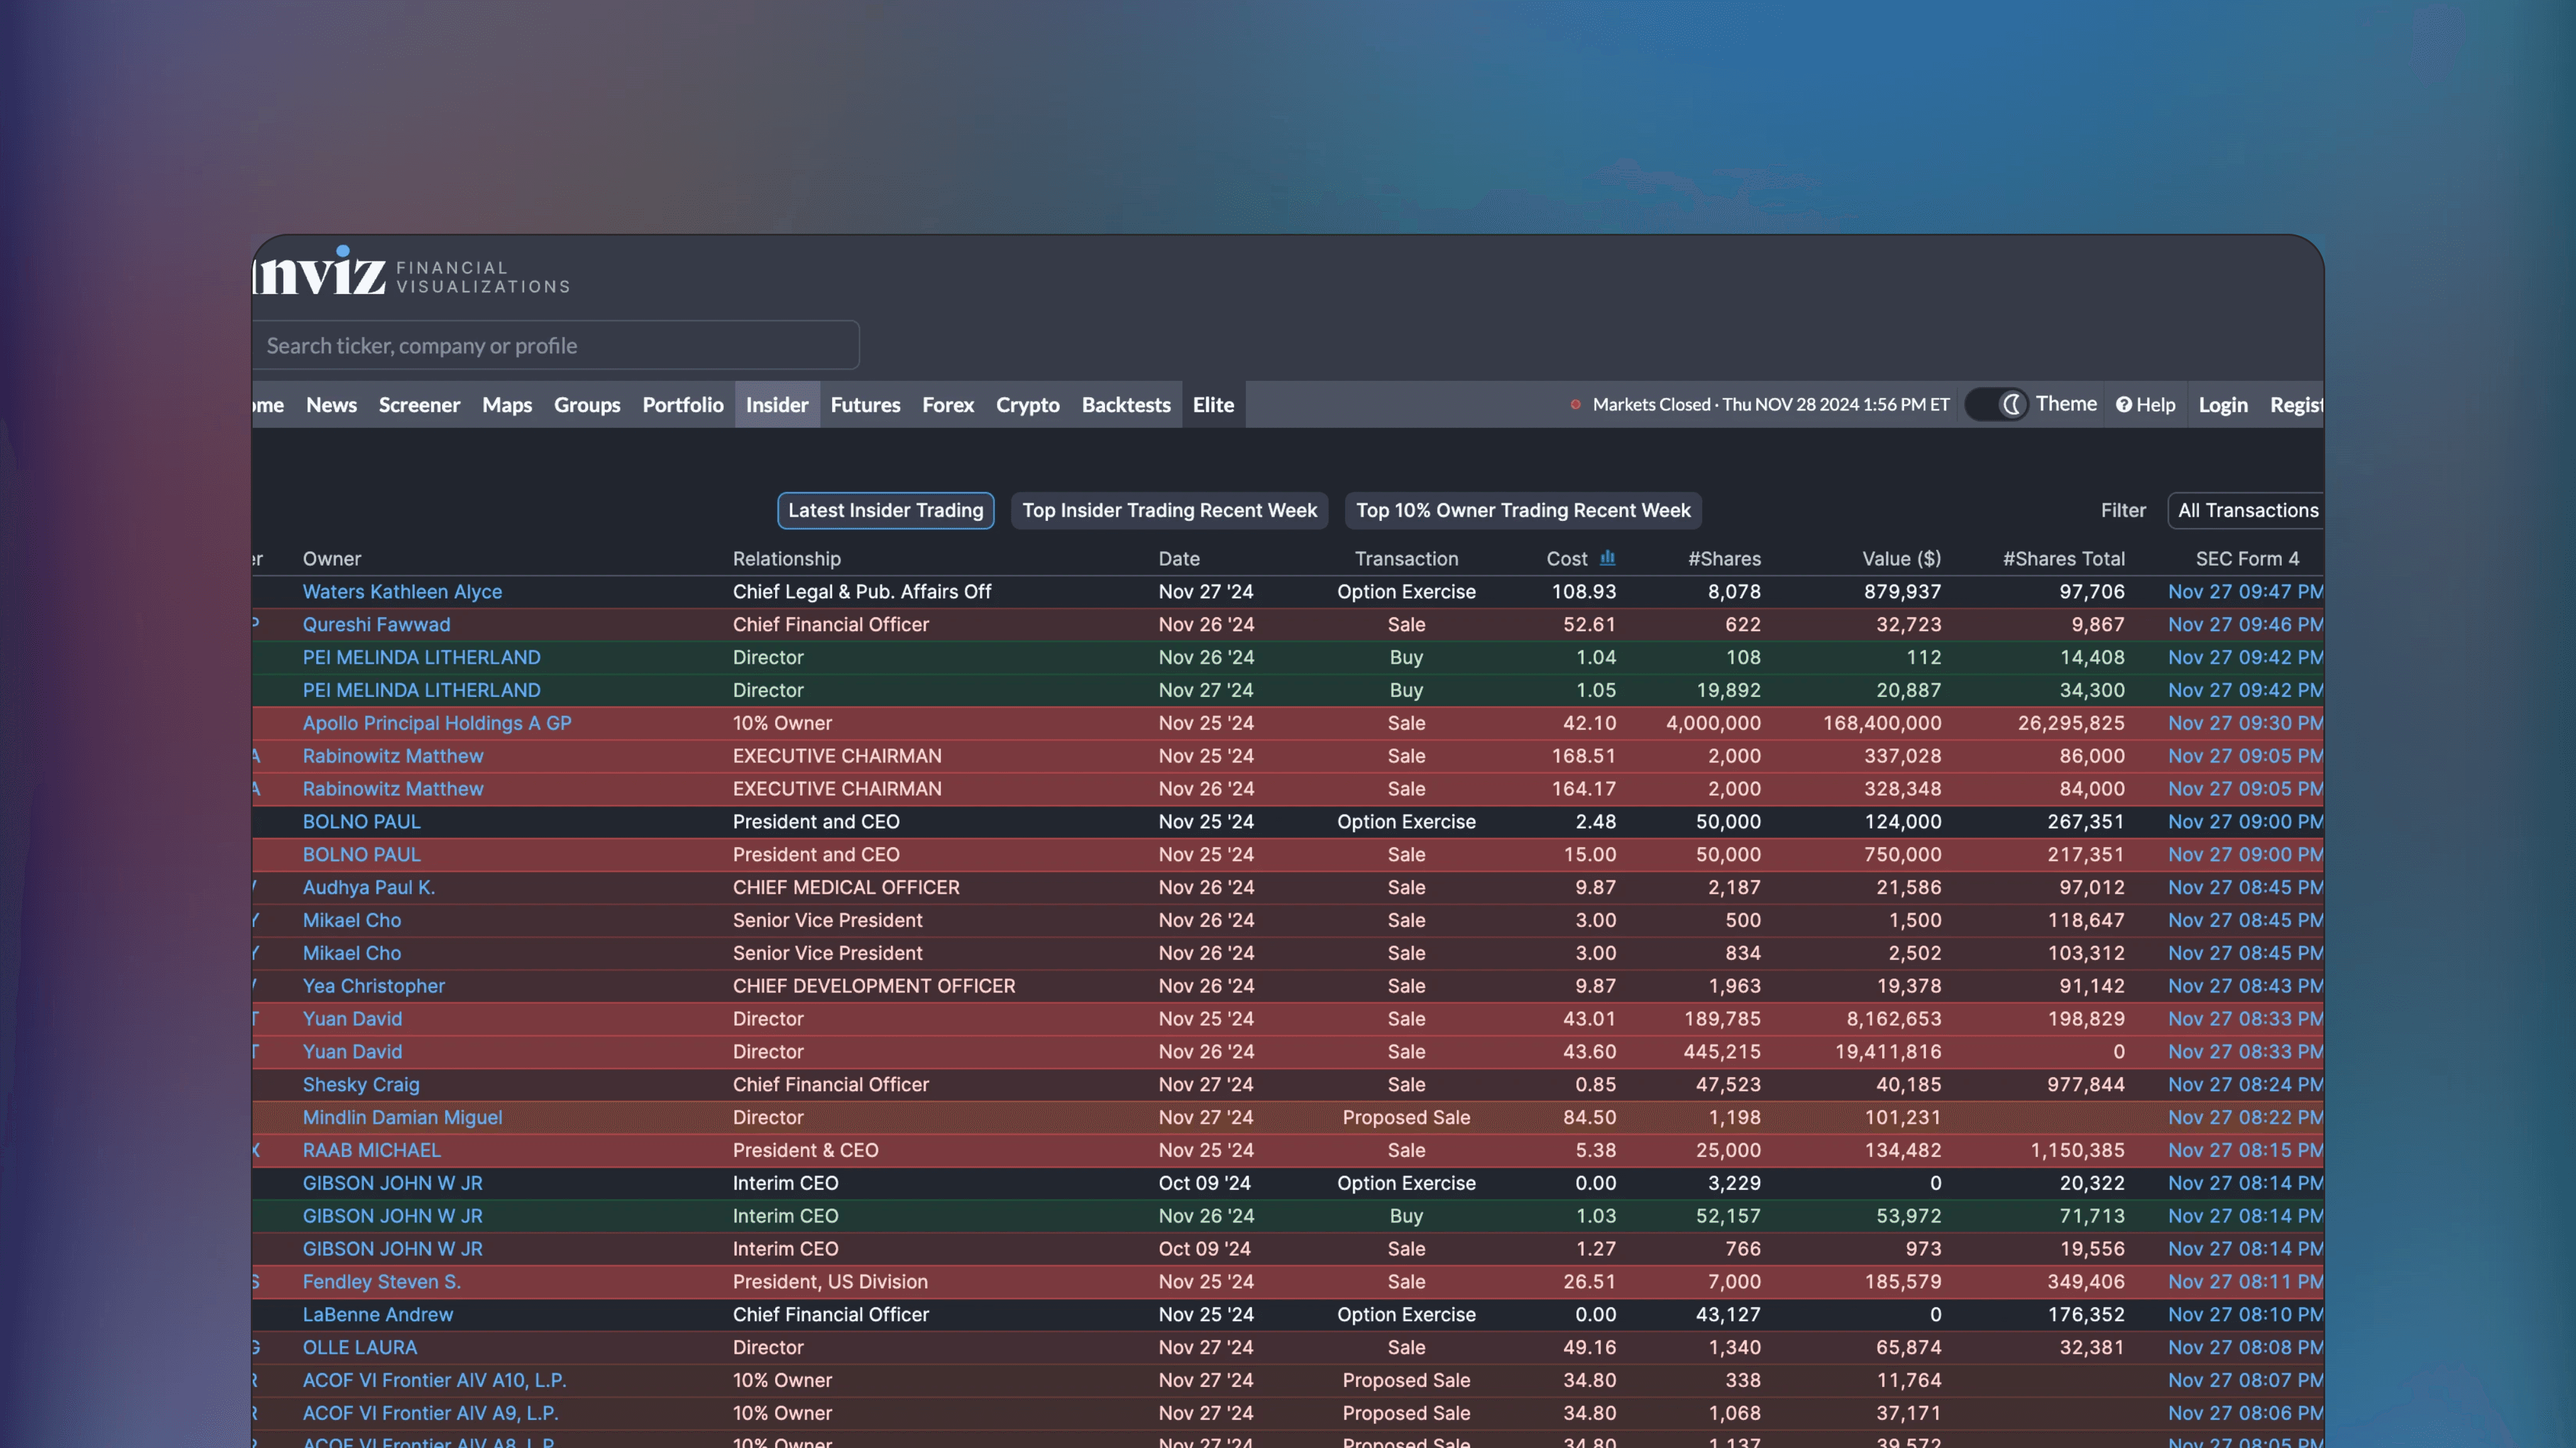
Finviz Website Preview
Finviz Website Preview
📟
📟
Finviz Screener offers a simple stock screener with 60+ filtering criteria across fundamental, and technical categories. Access advanced analytics like heatmaps, sector analysis, and customizable alerts.
Finviz Screener offers a simple stock screener with 60+ filtering criteria across fundamental, and technical categories. Access advanced analytics like heatmaps, sector analysis, and customizable alerts.
💸
Free/Paid Access
Some features of this listing are fully free to use, but for unlimited access a payment is required.
💸
Free/Paid Access
Some features of this listing are fully free to use, but for unlimited access a payment is required.
🥇
Trusted Publisher
Publisher of this listing is well recognized in social channels and receives overwhelmingly positive feedback.
🥇
Trusted Publisher
Publisher of this listing is well recognized in social channels and receives overwhelmingly positive feedback.
✅
Robust Theory
Concepts and theories mentioned in listing are based on generally approved and well established notions.
✅
Robust Theory
Concepts and theories mentioned in listing are based on generally approved and well established notions.
🌐
Popular Topic
Concepts and theories mentioned in listing are popular topics in web search
🌐
Popular Topic
Concepts and theories mentioned in listing are popular topics in web search
Published by Finviz
60+ Filtering Criteria for Stock Discovery
Finviz Screener offers over 60 filters spanning fundamental metrics like P/E ratio and debt-to-equity, technical signals like RSI and moving average position, and descriptive criteria like market cap and sector. This breadth enables precise stock discovery across multiple dimensions.
Visual Market Heatmaps
The heatmap feature displays the entire stock market as color-coded blocks organized by sector and market cap. A quick glance reveals which sectors are leading or lagging on any given day - making it easy to spot sector rotations and broad market themes.


Sector and Industry Analysis
Finviz provides performance breakdowns by sector and industry, showing relative strength across the market. Traders use this to identify capital flows - for example, money rotating out of technology into energy - and align their positions with prevailing trends.
Customizable Alerts for Monitoring
Users can set alerts based on screener criteria to receive notifications when stocks meet specific conditions. This automation means traders do not need to manually rerun screens - the platform watches the market and flags opportunities as they emerge.
A comprehensive US stock market screener
A comprehensive US stock market screener
Finviz Screener offers over 60 filters spanning fundamental metrics, technical signals and descriptive criteria with visual heatmaps and sector analysis. The platform provides customizable alerts that notify traders when stocks meet specific conditions.
Finviz Screener offers over 60 filters spanning fundamental metrics, technical signals and descriptive criteria with visual heatmaps and sector analysis. The platform provides customizable alerts that notify traders when stocks meet specific conditions.
Screen across the US equity market
View market heatmaps displaying color-coded blocks organized by sector and market cap to spot sector rotations and broad themes at a glance.
Apply filters to discover opportunities
Combine P/E ratio, debt-to-equity, RSI and moving average positioning across 60+ criteria for precise multi-factor stock discovery.
Configure custom screening alerts
Automate monitoring by setting alerts based on screener criteria that flag opportunities as they emerge without manual rescanning.
Common Questions About Finviz Stock Screening
Common Questions About Finviz Stock Screening
Finviz Screener offers 60+ filtering criteria across fundamental and technical categories along with visual heatmaps. These questions address screening capabilities and sector analysis features.
Finviz Screener offers 60+ filtering criteria across fundamental and technical categories along with visual heatmaps. These questions address screening capabilities and sector analysis features.
What filtering criteria are available?
Over 60 filters span fundamental metrics like P/E ratio and debt-to-equity, technical signals like RSI and moving average position, and descriptive criteria like market cap and sector.
How do the market heatmaps work?
The heatmap displays the entire stock market as color-coded blocks organized by sector and market cap. A quick glance reveals which sectors are leading or lagging on any given day.
Can I track sector rotations?
Yes. Performance breakdowns by sector and industry show relative strength across the market. Identify capital flows like money rotating out of technology into energy and align positions with trends.
🌐
🌐
Web sentiment
Web sentiment
Traders and investors online widely appreciate Finviz Screener, praising its user-friendly interface and robust features, resulting in a largely positive sentiment.
Traders and investors online widely appreciate Finviz Screener, praising its user-friendly interface and robust features, resulting in a largely positive sentiment.
Source: Online Discussion
Source: Online Discussion
Source: Online Discussion
✍️
✍️
TradersList Reviews (2)
TradersList Reviews (2)
TradersList Community has given this listing three stars, indicating decent trust and value for traders' toolkit. Make sure you understand functionality before using.
TradersList Community has given this listing three stars, indicating decent trust and value for traders' toolkit. Make sure you understand functionality before using.
⭐️
⭐️
⭐️
⭐️
⭐️
Source: TradersList Reviews
Source: TradersList Reviews


Bookmark
Saved here
📟
Get Platform
Find Platform
Review
Review Platform
✍️
⭐️
⭐️
⭐️
⭐️
⭐️
3
Comments
Read on Telegram
Risk Disclosure


Share Listing
📟
📟
Get Platform
Get Platform
Find Platform
Find Platform
✍️
Review
Review
Review Platform
Review Platform
⭐️
⭐️
⭐️
⭐️
⭐️
Saved here
Bookmark
Listing by third party publisher. Not financial advice.
Listing by third party publisher. Not financial advice.
Risk Disclosure
Risk Disclosure
Share
🤖
3


🤖
3
🤖
3
🔥
New Listings
Featured this week

🤖
by allanster


Free
TradingView Indicator
Growing or Waning Patterns [Alerts]
New
🔑
🌐
Growing or Waning Patterns [Alerts] is a TradingView indicator that detects reversal signals based on three candle body patterns. The patterns are classified as increasing or decreasing depending on bullish and bearish states. Additional features include alerts and trend filter.

📟
Free*
Trade Analytics Platform
TRDR.IO
New
🌐
✅
🏅
TRDR.IO is a crypto orderflow platform providing various tools visualizing crypto exchange order book activity. See bid-ask imbalances, buy and sell demand as well as order book depth in real-time with intuitive visual overlays. Additional features include alerts and scanning crypto markets for orderflow events.

🤖
by LeviathanCapital
Free
TradingView Indicator
Swing Levels and Liquidity - By Leviathan
New
🔑
🌐
✅
Swing Levels and Liquidity is a TradingView Indicator that displays swing high and low levels with volume traded at the pivots. Once formed, these levels likely retain liquidity that traders can expect to produce support and resistance in price when swept.
🤖
by allanster
Free
TradingView Indicator
Growing or Waning Patterns [Alerts]
New
🔑
🌐
Growing or Waning Patterns [Alerts] is a TradingView indicator that detects reversal signals based on three candle body patterns. The patterns are classified as increasing or decreasing depending on bullish and bearish states. Additional features include alerts and trend filter.
📟
Free*
Trade Analytics Platform
TRDR.IO
New
🌐
✅
🏅
TRDR.IO is a crypto orderflow platform providing various tools visualizing crypto exchange order book activity. See bid-ask imbalances, buy and sell demand as well as order book depth in real-time with intuitive visual overlays. Additional features include alerts and scanning crypto markets for orderflow events.
Load More
📟
Similar Listings
Traders also viewed
All


📟
Free*
Trade Analytics Platform
TradingView Screener
🌐
✅
🏅
TradingView Screener lets users filter and analyze global financial instruments like stocks, cryptocurrencies, ETFs, forex, and futures using a wide range of fundamental and technical criteria.

📟
Paid
Trade Analytics Platform
Seeking Alpha Stock Screener
🌐
✅
🏅
Seeking Alpha Stock Screener allows filtering and identifying stocks using various metrics and proprietary ratings such as market capitalization, PE ratio, EPS, profitability and growth rates.

📟
Paid
Trade Analytics Platform
Streamlined Finance
🌐
✅
Streamlined Finance is a platform offering a variety of trade analytics for US stock market. The platform has numerous fundamental and technical analysis indicators for analytical, data driven decision making.

📟
Free
Trade Analytics Platform
FRED (Federal Reserve Economic Data)
🌐
✅
🏅
FRED (Federal Reserve Economic Data) offers an extensive online database for official economic data from various sources. Users can search, graph, map and manipulate data via the website and export data to third-party applications.

📟
Free*
Trade Analytics Platform
Tickertape Stock Screener
🌐
✅
Tickertape Stock Screener provides over 200 filters for screening and analyzing Indian stocks and mutual funds, offering pre-built screening templates, custom stock groups, real-time data, portfolio building and broker integration.

📟
Paid
Trade Analytics Platform
Stocklabs
🏅
Stocklabs is a offering a comprehensive screener with technical and fundamental filters as well as algorithmic overbought/oversold signals. Access tools like Volume Surge Analyze and track portfolio holdings using a clean and modern interface.

📟
Free
Trade Analytics Platform
S&P Global Ratings
🌐
✅
🏅
S&P Global Ratings provides credit ratings to assess the creditworthiness of countries and companies. Find independent credit evaluations using a scale from AAA to D, including CreditWatch and outlooks.

📟
Free*
Trade Analytics Platform
Investing.com Stock Screener
🌐
✅
🏅
Investing.com Stock Screener offers a simple screener with basic filters for the US stock market. The platform also features over 167 customizable metrics, real-time and historical data with data export capability.

📟
Free
Trade Analytics Platform
Trading Economics
🌐
✅
🏅
Trading Economics is a platform providing access to extensive global economic and financial data for 196 countries, offering over 23 million indicators, real-time quotes, an economic calendar, APIs and data export capability.

📟
Paid
Trade Analytics Platform
Strike
🌐
✅
Strike leverages quantitative data and algorithms to deliver technical and fundamental insights on US stock market. Access proprietary indicators, customizable dashboards, sentiment analysis, real-time stock data and market participant information.

📟
Free
Trade Analytics Platform
Alpha Spread
🌐
✅
Alpha Spread is a platform that simplifies stock valuation using AI and machine learning-driven models. Access customizable watchlists, stock screeners, valuation scores and earnings transcripts for informed fundamental investing.
📟
Free*
Trade Analytics Platform
TradingView Screener
🌐
✅
🏅
TradingView Screener lets users filter and analyze global financial instruments like stocks, cryptocurrencies, ETFs, forex, and futures using a wide range of fundamental and technical criteria.
📟
Paid
Trade Analytics Platform
Seeking Alpha Stock Screener
🌐
✅
🏅
Seeking Alpha Stock Screener allows filtering and identifying stocks using various metrics and proprietary ratings such as market capitalization, PE ratio, EPS, profitability and growth rates.
📟
Paid
Trade Analytics Platform
Streamlined Finance
🌐
✅
Streamlined Finance is a platform offering a variety of trade analytics for US stock market. The platform has numerous fundamental and technical analysis indicators for analytical, data driven decision making.
📟
Free
Trade Analytics Platform
FRED (Federal Reserve Economic Data)
🌐
✅
🏅
FRED (Federal Reserve Economic Data) offers an extensive online database for official economic data from various sources. Users can search, graph, map and manipulate data via the website and export data to third-party applications.
📟
Free*
Trade Analytics Platform
Tickertape Stock Screener
🌐
✅
Tickertape Stock Screener provides over 200 filters for screening and analyzing Indian stocks and mutual funds, offering pre-built screening templates, custom stock groups, real-time data, portfolio building and broker integration.
📟
Paid
Trade Analytics Platform
Stocklabs
🏅
Stocklabs is a offering a comprehensive screener with technical and fundamental filters as well as algorithmic overbought/oversold signals. Access tools like Volume Surge Analyze and track portfolio holdings using a clean and modern interface.
📟
Free
Trade Analytics Platform
S&P Global Ratings
🌐
✅
🏅
S&P Global Ratings provides credit ratings to assess the creditworthiness of countries and companies. Find independent credit evaluations using a scale from AAA to D, including CreditWatch and outlooks.
📟
Free*
Trade Analytics Platform
Investing.com Stock Screener
🌐
✅
🏅
Investing.com Stock Screener offers a simple screener with basic filters for the US stock market. The platform also features over 167 customizable metrics, real-time and historical data with data export capability.
📟
Free
Trade Analytics Platform
Trading Economics
🌐
✅
🏅
Trading Economics is a platform providing access to extensive global economic and financial data for 196 countries, offering over 23 million indicators, real-time quotes, an economic calendar, APIs and data export capability.
📟
Paid
Trade Analytics Platform
Strike
🌐
✅
Strike leverages quantitative data and algorithms to deliver technical and fundamental insights on US stock market. Access proprietary indicators, customizable dashboards, sentiment analysis, real-time stock data and market participant information.
Discover trading edge
Discover trading edge
Indicators, Platforms & Education
Indicators, Platforms & Education
TradersList
Discover trading edge
Join Telegram
Weekly listings
Join Telegram
Disclaimer
Our goal is to achieve greater transparency, guidance and safety in trading and investing by providing means to discover, research and discuss trading/investing related sites/services.
Content provided on this site is not financial advice, meant for educational purposes only. TradersList does not endorse or guarantee any result for listed sites/services. Do your own research.
Read full disclaimer
TradersList
Discover trading edge
Join Telegram
Disclaimer
Our goal is to achieve greater transparency, guidance and safety in trading and investing by providing means to discover, research and discuss trading/investing related sites/services.
Content provided on this site is not financial advice, meant for educational purposes only. TradersList does not endorse or guarantee any result for listed sites/services. Do your own research.
Read full disclaimer