

From TradersList Editors
From TradersList Editors
Gain real-time market insights by analyzing trade direction, price, and volume to make informed decisions with this free tool.
Gain real-time market insights by analyzing trade direction, price, and volume to make informed decisions with this free tool.


TradingView Indicator
TradingView Indicator
Time and Sales Tape Indicator for TradingView: Real-Time Trade Data Display
Time and Sales Tape Indicator for TradingView: Real-Time Trade Data Display

by MUQWISHI on TradingView
by MUQWISHI on TradingView
🤖
🤖
Time & Sales (Tape) [By MUQWISHI]
Time & Sales (Tape) [By MUQWISHI]
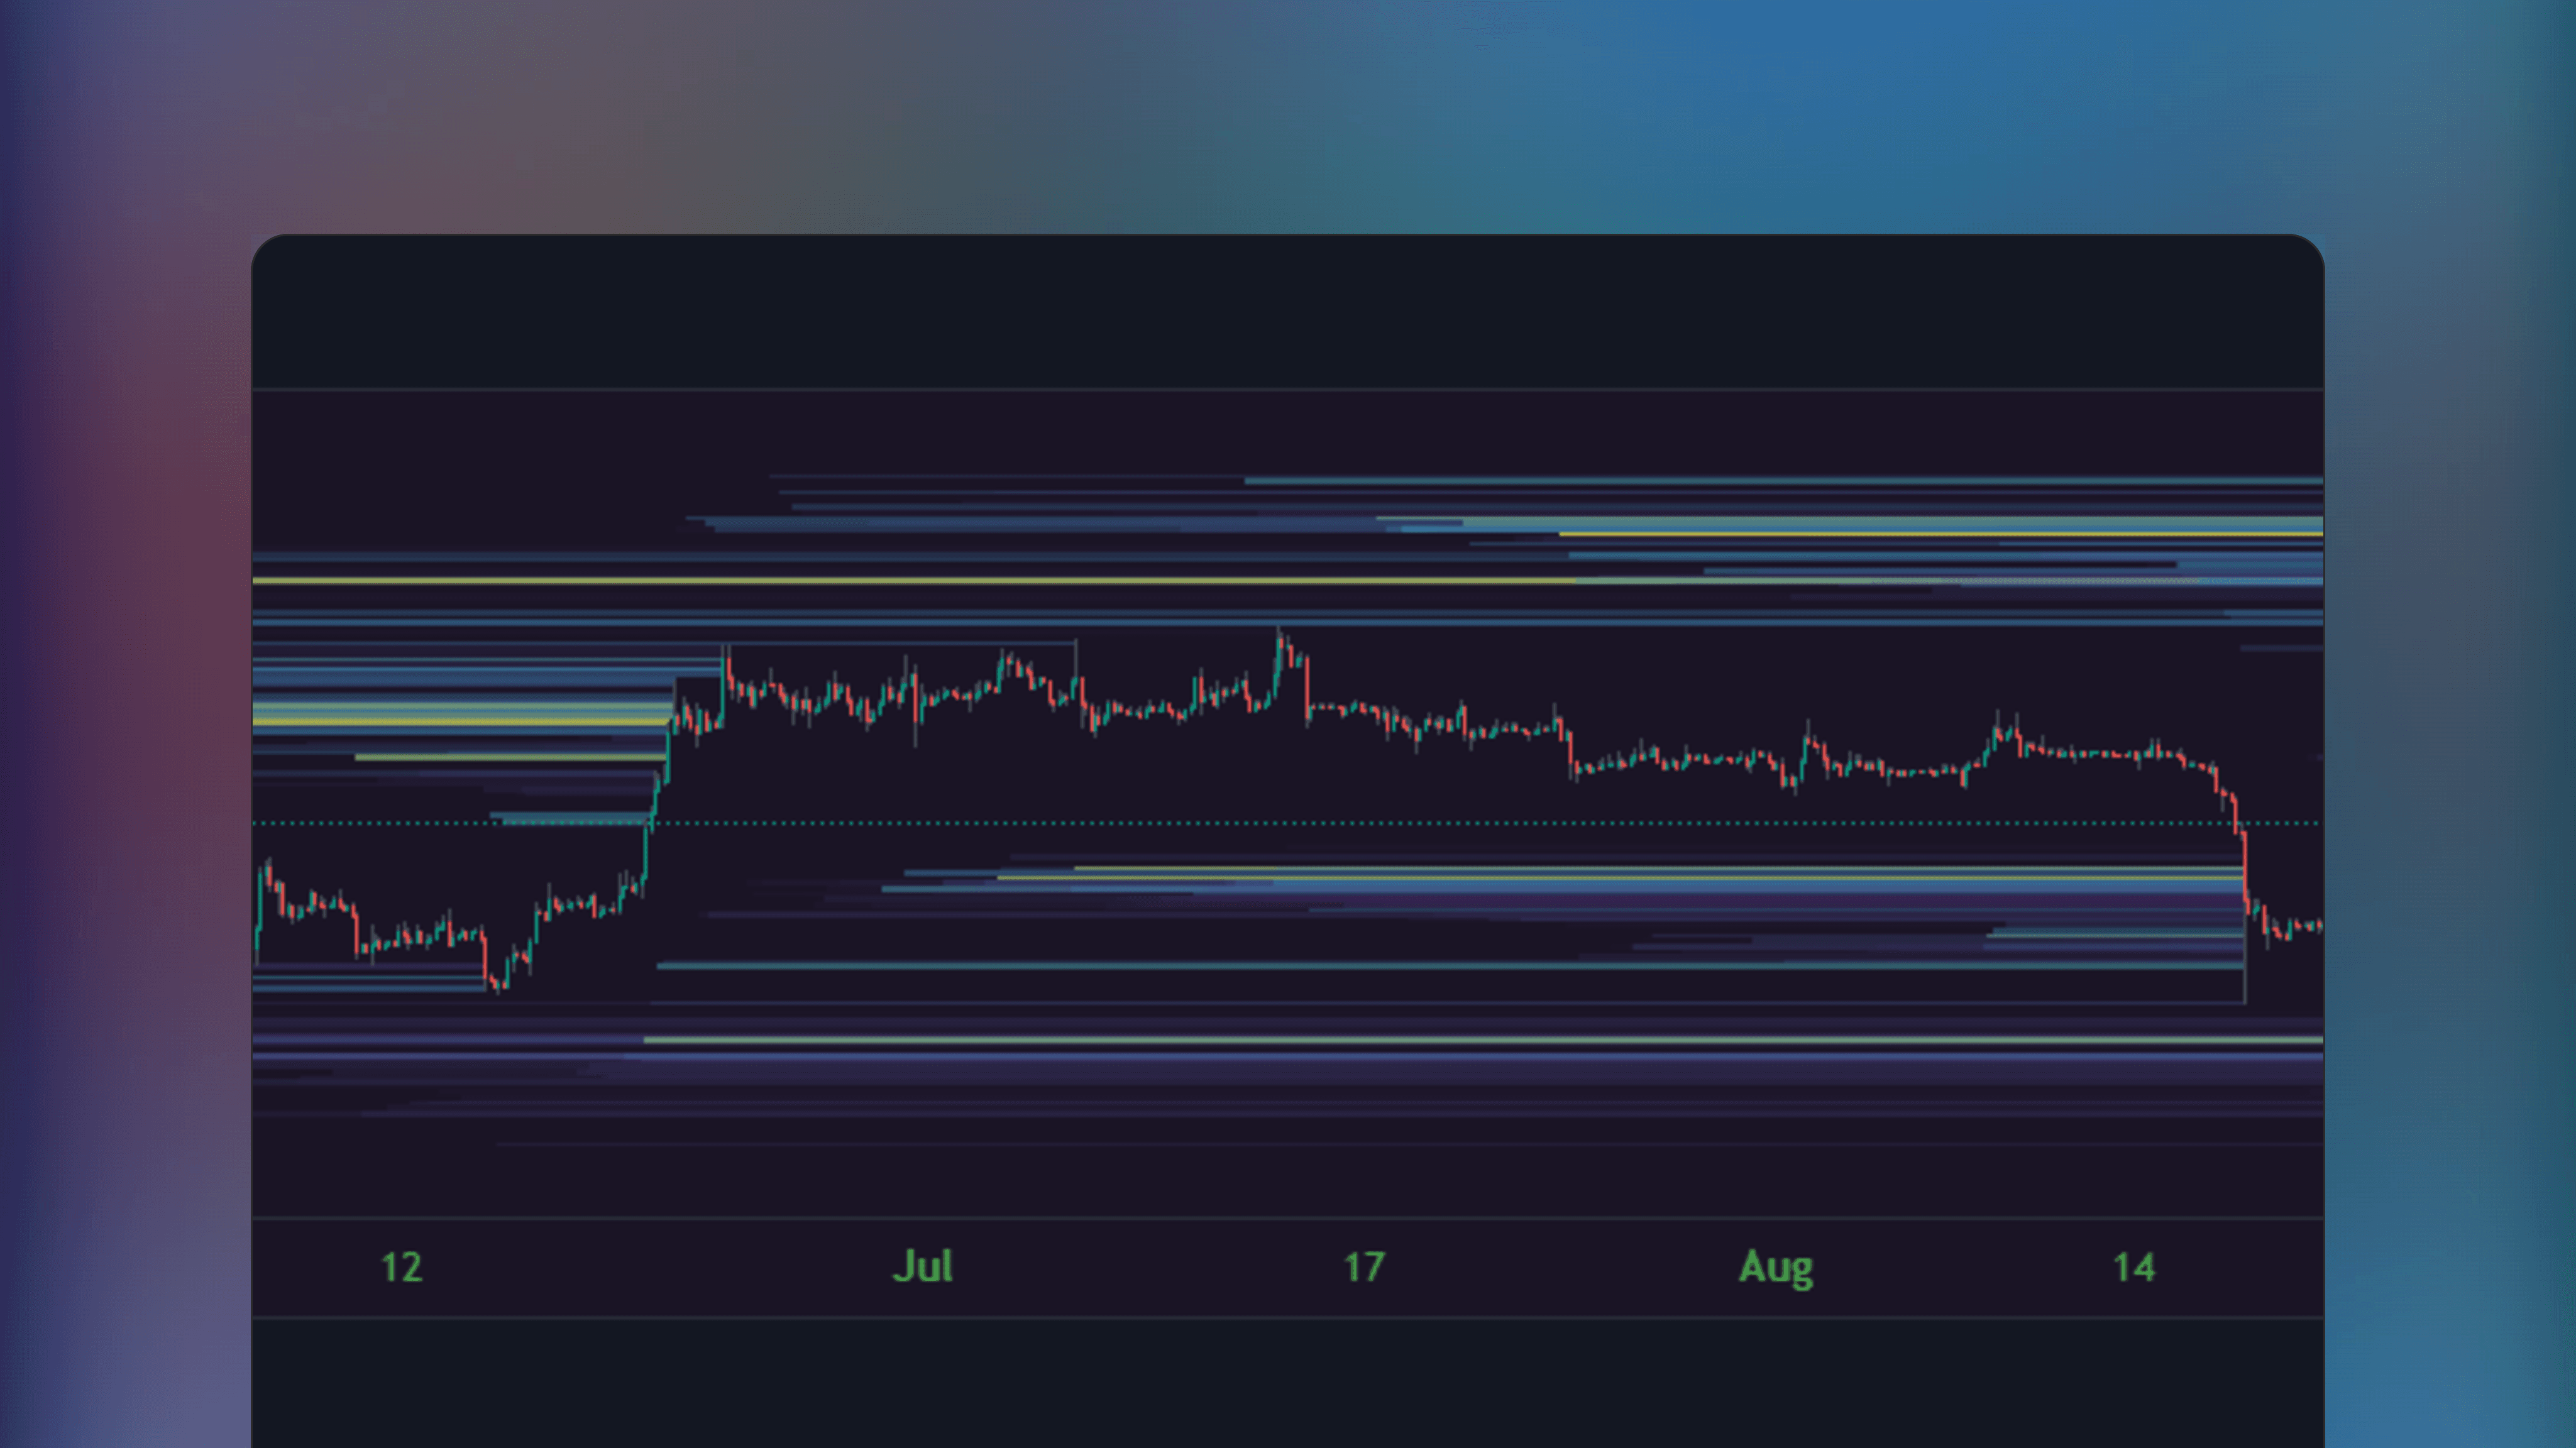
Time & Sales (Tape) [By MUQWISHI] is an Indicator that provides real-time executed trades in a tape format, including trade direction, executed price and volume traded. Updates tick-by-tick real-time or based on lower timeframes for historical values.
Time & Sales (Tape) [By MUQWISHI] is an Indicator that provides real-time executed trades in a tape format, including trade direction, executed price and volume traded. Updates tick-by-tick real-time or based on lower timeframes for historical values.

Get on TradingView
This indicator is available on TradingView web charting platform. Signing up for a free account is required, no downloads.
Get on TradingView
This indicator is available on TradingView web charting platform. Signing up for a free account is required, no downloads.
🔑
Open Source
Listing has publically available source code that can be audited and modified as needed.
🔑
Open Source
Listing has publically available source code that can be audited and modified as needed.
💸
Free Access
All features of this listing are fully free to use with no pricing tiers. Simply start using.
💸
Free Access
All features of this listing are fully free to use with no pricing tiers. Simply start using.
🥇
Trusted Publisher
Publisher of this listing is well recognized in social channels and receives overwhelmingly positive feedback.
🥇
Trusted Publisher
Publisher of this listing is well recognized in social channels and receives overwhelmingly positive feedback.
✅
Robust Theory
Concepts and theories mentioned in listing are based on generally approved and well established notions.
✅
Robust Theory
Concepts and theories mentioned in listing are based on generally approved and well established notions.
🌐
Popular Topic
Concepts and theories mentioned in listing are popular topics in web search
🌐
Popular Topic
Concepts and theories mentioned in listing are popular topics in web search
Published by MUQWISHI on TradingView
Published by MUQWISHI on TradingView
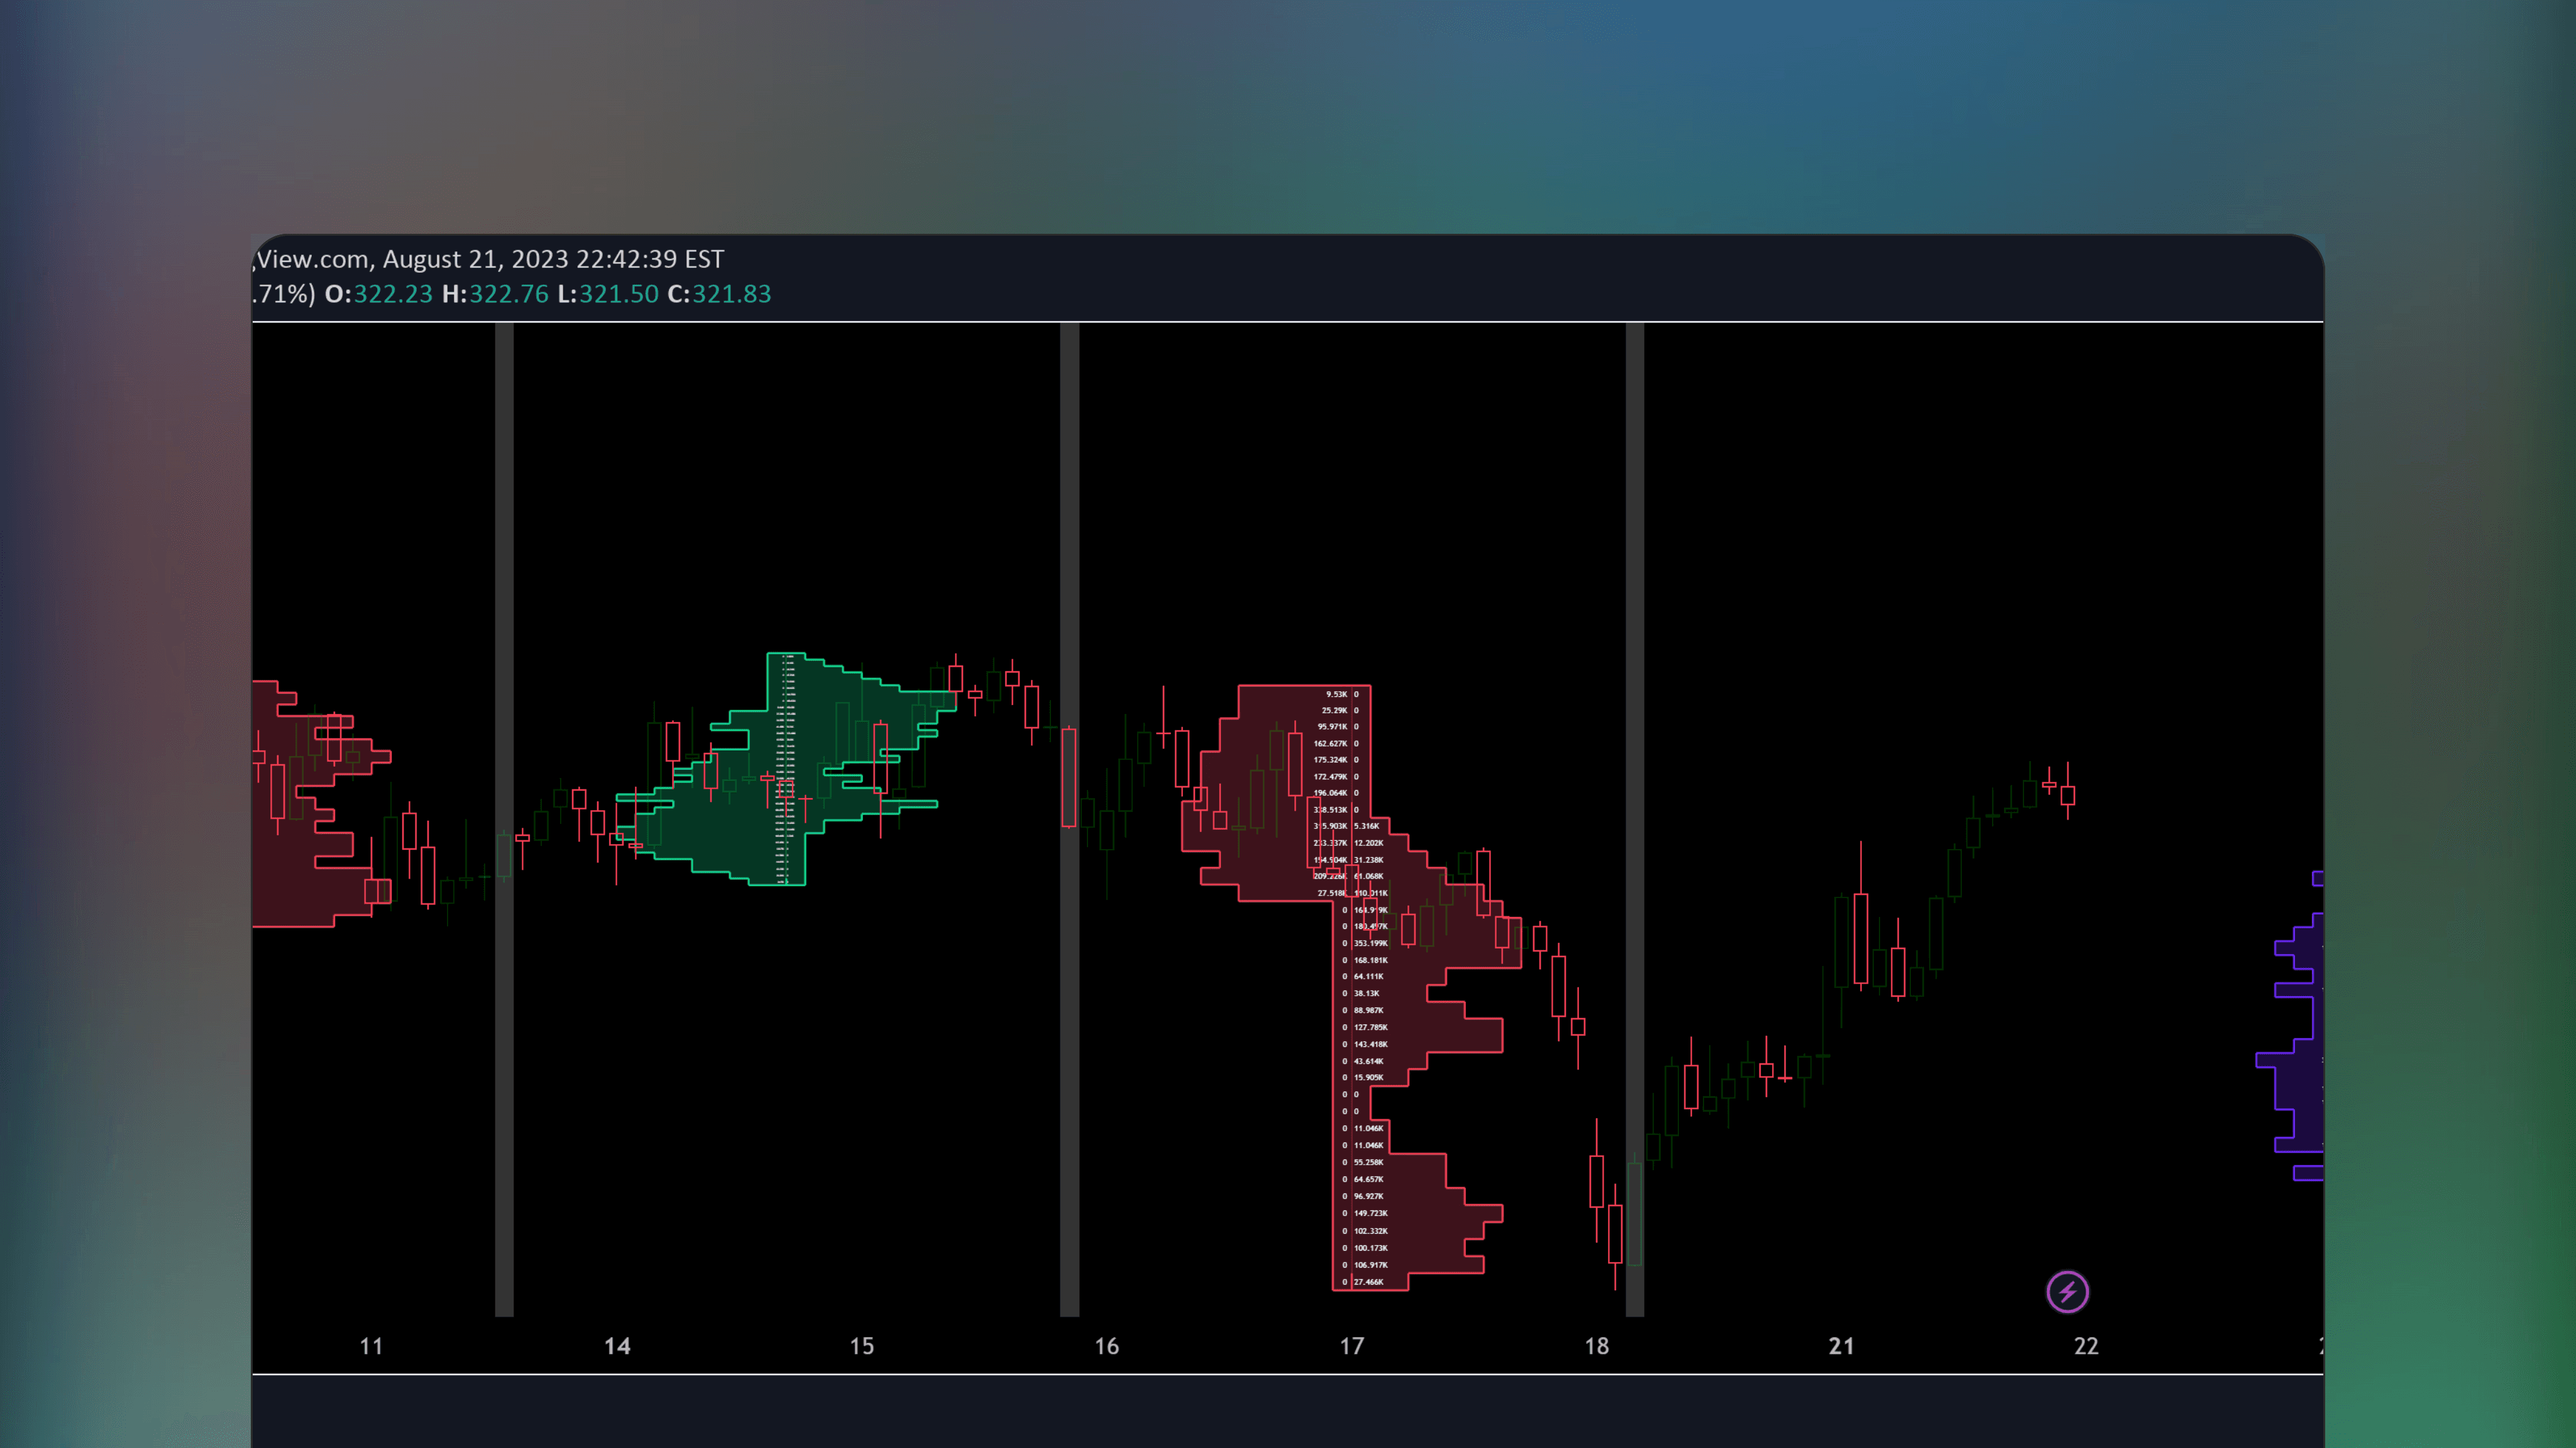
Real-Time Trade Execution Data
This indicator replicates a traditional Time and Sales window directly on the TradingView chart. It displays each executed trade as it happens, showing the direction (buy or sell), the exact execution price and the volume traded - giving traders a tape-reading experience within the charting interface.
Tick-by-Tick and Historical Modes
In real-time, the indicator updates tick-by-tick as new trades execute. For historical analysis, it reconstructs the tape using lower timeframe data, allowing traders to review past trade flow even when they were not watching the chart live.


Why Tape Reading Matters
The tape reveals the urgency behind price movement. Large volume prints at the ask suggest aggressive buying, while heavy prints at the bid indicate selling pressure. For example, spotting a cluster of large buy trades at a support level can confirm that demand is stepping in.
A Chart-Native Solution
By embedding the tape directly in TradingView, the indicator eliminates the need for a separate platform or data window. Traders can overlay it alongside other technical tools, combining tape analysis with chart patterns and indicators in a single workspace.
Track whale transactions real-time using tape
Track whale transactions real-time using tape
This indicator replicates a traditional Time and Sales window directly on the TradingView chart, displaying each executed trade with direction, price and volume. The tape updates tick-by-tick in real time or reconstructs historical flow using lower timeframe data.
This indicator replicates a traditional Time and Sales window directly on the TradingView chart, displaying each executed trade with direction, price and volume. The tape updates tick-by-tick in real time or reconstructs historical flow using lower timeframe data.
Spot volume spikes on the tape
Watch for clusters of large prints that stand out from normal flow. Unusual volume at specific price levels often signals institutional participation.
Integrate tape reading into chart analysis
The indicator eliminates the need for a separate platform or data window. Combine tape analysis with chart patterns and indicators in one workspace.
Track large block transactions
Identify when big orders hit the market. Large prints at the ask suggest aggressive buying, while heavy prints at the bid indicate selling pressure.
Common Questions About Time and Sales Analysis
Common Questions About Time and Sales Analysis
Tape reading reveals the urgency behind price movement by showing individual trade executions. Here are common questions about Time and Sales analysis.
Tape reading reveals the urgency behind price movement by showing individual trade executions. Here are common questions about Time and Sales analysis.
What can I learn from watching the tape that charts do not show?
The tape shows trade execution details including size and direction. Large volume prints at the ask indicate aggressive buying. Heavy prints at the bid show selling pressure. This urgency information is invisible on standard candlestick charts.
Does the indicator work for historical analysis?
Yes. For historical periods, the indicator reconstructs the tape using lower timeframe data. While not tick-perfect, it approximates past trade flow so you can review activity even when you were not watching live.
How do I identify significant tape activity?
Look for clusters of large trades at key levels. Multiple large buy prints at a support level confirms demand stepping in. Scattered small trades carry less significance. Size and clustering matter most in tape interpretation.
🌐
🌐
Web sentiment
Web sentiment
The Time & Sales (Tape) by MUQWISHI garners positive sentiment on the web; users appreciate its detailed trade data, value open-source access, and report a satisfactory experience.
The Time & Sales (Tape) by MUQWISHI garners positive sentiment on the web; users appreciate its detailed trade data, value open-source access, and report a satisfactory experience.
Source: Online Discussion
Source: Online Discussion
Source: Online Discussion
✍️
✍️
TradersList Reviews (3)
TradersList Reviews (3)
TradersList Community has given this listing two stars, indicating mild trust and some utility value. Do your research first.
TradersList Community has given this listing two stars, indicating mild trust and some utility value. Do your research first.
⭐️
⭐️
⭐️
⭐️
⭐️
Source: TradersList Reviews
Source: TradersList Reviews


Bookmark
Saved here
🤖
Get Indicator
Find Indicator
Review
Review Indicator
✍️
⭐️
⭐️
⭐️
⭐️
⭐️
3
Comments
Read on Telegram
Listing by third party publisher. Not financial advice.
Risk Disclosure


Share Listing
🤖
🤖
Get Indicator
Get Indicator
Find Indicator
Find Indicator
✍️
Review
Review
Review Indicator
Review Indicator
⭐️
⭐️
⭐️
⭐️
⭐️
Saved here
Bookmark
Listing by third party publisher. Not financial advice.
Listing by third party publisher. Not financial advice.
Risk Disclosure
Risk Disclosure
Share
🤖
3


🤖
3
🤖
3
✍️
By Author
More by MUQWISHI

🤖
by MUQWISHI

Free
TradingView Indicator
Annual Returns % Comparison [By MUQWISHI]
🔑
🌐
✅
🏅
Annual Returns % Comparison [By MUQWISHI] is a free TradingView indicator that benchmarks the historical annual percentage change between two symbols using a simple to understand column visualization.

🤖
by MUQWISHI
Free
TradingView Indicator
Treasury Yields Heatmap [By MUQWISHI]
🔑
🌐
✅
Treasury Yields Heatmap by MUQWISHI is a TradingView indicator that displays treasury yield rates over time and indicates the yield curve status - normal, flat, or inverted. Users can customize starting period, timeframe and reference country for bond data.

🤖
by MUQWISHI
Free
TradingView Indicator
Financial Data Spreadsheet [By MUQWISHI]
🔑
🌐
✅
🏅
Financial Data Spreadsheet by MUQWISHI is a TradingView indicator displaying spreadsheet-like tables of key financial metrics from income statements to cash flow statements, based on most recent reporting period.
🤖
by MUQWISHI
Free
TradingView Indicator
Annual Returns % Comparison [By MUQWISHI]
🔑
🌐
✅
🏅
Annual Returns % Comparison [By MUQWISHI] is a free TradingView indicator that benchmarks the historical annual percentage change between two symbols using a simple to understand column visualization.
🤖
by MUQWISHI
Free
TradingView Indicator
Treasury Yields Heatmap [By MUQWISHI]
🔑
🌐
✅
Treasury Yields Heatmap by MUQWISHI is a TradingView indicator that displays treasury yield rates over time and indicates the yield curve status - normal, flat, or inverted. Users can customize starting period, timeframe and reference country for bond data.
Load More
🔥
New Listings
Featured this week

🤖
by allanster

Free
TradingView Indicator
Growing or Waning Patterns [Alerts]
New
🔑
🌐
Growing or Waning Patterns [Alerts] is a TradingView indicator that detects reversal signals based on three candle body patterns. The patterns are classified as increasing or decreasing depending on bullish and bearish states. Additional features include alerts and trend filter.

📟
Free*
Trade Analytics Platform
TRDR.IO
New
🌐
✅
🏅
TRDR.IO is a crypto orderflow platform providing various tools visualizing crypto exchange order book activity. See bid-ask imbalances, buy and sell demand as well as order book depth in real-time with intuitive visual overlays. Additional features include alerts and scanning crypto markets for orderflow events.

🤖
by LeviathanCapital
Free
TradingView Indicator
Swing Levels and Liquidity - By Leviathan
New
🔑
🌐
✅
Swing Levels and Liquidity is a TradingView Indicator that displays swing high and low levels with volume traded at the pivots. Once formed, these levels likely retain liquidity that traders can expect to produce support and resistance in price when swept.
🤖
by allanster
Free
TradingView Indicator
Growing or Waning Patterns [Alerts]
New
🔑
🌐
Growing or Waning Patterns [Alerts] is a TradingView indicator that detects reversal signals based on three candle body patterns. The patterns are classified as increasing or decreasing depending on bullish and bearish states. Additional features include alerts and trend filter.
📟
Free*
Trade Analytics Platform
TRDR.IO
New
🌐
✅
🏅
TRDR.IO is a crypto orderflow platform providing various tools visualizing crypto exchange order book activity. See bid-ask imbalances, buy and sell demand as well as order book depth in real-time with intuitive visual overlays. Additional features include alerts and scanning crypto markets for orderflow events.
Load More
🤖
Similar Listings
Traders also viewed
All


🤖
by LeviathanCapital

Free
TradingView Indicator
Volume and Price Z-Score [Multi-Asset] - By Leviathan
🔑
✅
Volume and Price Z-Score [Multi-Asset] is a TradingView Indicator providing Z-Score analysis of price and volume for up to 200 symbols. Features include scatter plots, histograms and heatmaps to visualize the relationship between price movements and trading volume.

🤖
by LeviathanCapital
Free
TradingView Indicator
Volume / Open Interest "Footprint" - By Leviathan
🔑
🌐
✅
Volume Open Interest Footprint by Leviathan is a TradingView indicator that visualizes trading activity using footprint-style bars based on aggregated volume or open interest data within the visible chart range. The indicator offers three heatmap options: Volume Delta/OI Delta, Total Volume/Total OI, and Buy vs Sell Volume/OI changes.

🤖
by KioseffTrading
Free
TradingView Indicator
Delta Ladder [Kioseff Trading]
🔑
🌐
✅
Delta Ladder [Kioseff Trading] is a free TradingView Indicator that visualizes buy and sell volume at price. This indicator presents volume delta data in various formats, such as Classic mode with volume delta based colored boxes and numeral volume information.

🤖
by LeviathanCapital
Free
TradingView Indicator
Volume Suite - By Leviathan (CVD, Volume Delta, Relative Volume)
🔑
🌐
✅
Volume Suite by Leviathan is a TradingView indicator that combines multiple volume metrics like CVD, Volume Delta, Relative Volume, Buy/Sell Volume and Cumulative Relative Volume into one single view. Offers customizable visualizations, highlighting significant volume and price anomalies.

🤖
by KioseffTrading
Free
TradingView Indicator
Liquidation Ranges + Volume/OI Dots [Kioseff Trading]
🔑
🌐
✅
🏅
Liquidation Ranges + Volume/OI Dots by Kioseff Trading is a TradingView indicator that combines multiple volumetric tools in one. View high volume events (volume dots), liquidation ranges on crypto assets and key points of interest to highlight support and resistance areas.

🤖
by LeviathanCapital
Free
TradingView Indicator
Open Interest Suite [Aggregated] - By Leviathan
🔑
🌐
✅
🏅
Open Interest Suite [Aggregated] by Leviathan is an Indicator that utilizes aggregated Open Interest data to visualize market interest through OI candles, Open Interest Delta and their distribution profiles. It also features innovative metrics like OI x rVOL, OI RSI, an OI Distribution profile and a statistics screener for keeping up with the data.
🤖
by LeviathanCapital
Free
TradingView Indicator
Open Interest Profile [Fixed Range] - By Leviathan
🔑
🌐
✅
🏅
Open Interest Profile [Fixed Range] by Leviathan is a TradingView indicator that aggregates open interest data over a user-specified fixed range, offering a range of tools and metrics like OI Delta Profile, Positive Delta Levels, OI Heatmap, Range Levels, OIWAP and POCs.

🤖
by LeviathanCapital
Free
TradingView Indicator
Net Positions (Net Longs & Net Shorts) - By Leviathan
🔑
🌐
🏅
Net Positions (Net Longs & Net Shorts) by Leviathan is a free TradingView indicator that visualizes net long and short market positions using various methods. It includes tools like NL/NS Profile, Delta, Ratio, Volume Heatmap, Divergence Finder, RSI, EMAs and VWMAs. Author notes this is an experimental tool.

🤖
by KioseffTrading
Free
TradingView Indicator
Zig-Zag Volume Profile (Bull vs. Bear) [Kioseff Trading]
🔑
🌐
Zig-Zag Volume Profile (Bull vs. Bear) [Kioseff Trading] is a TradingView indicator that displays bullish and bearish volume distributions using unique Zig-Zag style visualization.

🤖
by LeviathanCapital
Free
TradingView Indicator
Open Interest Delta - By Leviathan
🔑
🌐
✅
🏅
Open Interest Delta - By Leviathan is a TradingView indicator that visualizes changes in open interest by plotting Open Interest Delta. It includes heatmap style extreme ranges and color-coded candles to highlight bars with significant increases or decreases in open interest.
🤖
by NXT2017
Free
TradingView Indicator
VolumeHeatmap | Experimental Version of Marketorders Matrix
🔑
🌐
VolumeHeatmap is a free experimental TradingView indicator that visualizes buy/sell orders in liquidity heatmap style, keeps track of changing volume dynamics and displays points of control (POC) occuring over time.
🤖
by LeviathanCapital
Free
TradingView Indicator
Volume Bars - Leviathan x Tradingriot
🔑
🌐
✅
🏅
Volume Bars - Leviathan x Tradingriot is a TradingView indicator streamlines volume analysis by coloring volume bars based on relative volume anomalies and price movement criteria to visualize key market moments, such as trend exhaustion or indecision.
![TradingView price chart displaying the TPO Market Profile [Kioseff Trading] indicator showing time-price opportunity distributions and market activity levels](https://framerusercontent.com/images/5AWnzatF5xKZIrD9dfLjLI4xgo.png?width=4098&height=2304)
🤖
by KioseffTrading
Free
TradingView Indicator
TPO Market Profile [Kioseff Trading]
🔑
🌐
✅
TPO Market Profile [Kioseff Trading] is a TradingView Indicator that displays a market profile distribution of time. The indicator maps out how much time was spent at each price level, working on all timeframes. Users can fully customize when the profile resets (e.g., daily or every few hours/days) and can also view profiles from past sessions. Important levels like Point of Control (POC) and the Value Area (VAH/VAL) included.
🤖
by KioseffTrading
Free
TradingView Indicator
TPO Letters [Kioseff Trading]
🔑
🌐
🏅
TPO Letters [Kioseff Trading] is a free TradingView indicator that visualizes classic market profile letters separately, representing the chronological sequence of price formation for selected period.
🤖
by KioseffTrading
Free
TradingView Indicator
Rain Flow Candles
🔑
🏅
Rain Flow Candles is a TradingView indicator that aggregates volume data from lower timeframes to create a volume profile on a higher timeframe in unique rainflow style visuals, illustrating how volume is distributed across different price levels.
🤖
by EmreKb
Free
TradingView Indicator
Volume Density by EmreKb
🔑
🏅
Volume Density by EmreKb is a TradingView indicator that visualizes volume distribution within each candle using color intensity, highlighting price levels with high volume activity using more intense colors.

🤖
by dharmatech
Free
TradingView Indicator
Global Net Liquidity
🔑
✅
Global Net Liquidity is a free TradingView indicator that calculates global net liquidity by aggregating all major central banks' liquidity into one view.

🤖
by MXWLL-Capital-Trading
Free
TradingView Indicator
Genuine Liquidation Delta [Mxwll] - No Estimates
🔑
✅
🏅
Genuine Liquidation Delta [Mxwll] - No Estimates is a free TradingView indicator that displays real-time liquidation delta data for over 100 cryptocurrencies, sourced directly from a popular crypto exchange.
🤖
by Texmoonbeam
Free
TradingView Indicator
All-In-One Auto Anchored VWAPs
🔑
🌐
✅
All-In-One Auto Anchored VWAPs is a free TradingView indicator that draws multiple volume weighted average prices from various chart points, allowing customization of up to three anchored VWAPs with different anchor periods.
![TradingView price chart displaying the Volume Profile [TFO] indicator with a horizontal histogram representing volume at specific price levels. The visual highlights the Point of Control and High Volume Nodes.](https://framerusercontent.com/images/BTSkXkF0tYAs3DdoafULqR293L4.png?width=4098&height=2304)
🤖
by tradeforopp
Free
TradingView Indicator
Volume Profile [TFO]
🔑
🌐
✅
🏅
Volume Profile [TFO] is a TradingView indicator that calculate a classical volume profile with added key featurees like points of control (POC), high volume nodes (HVN) and more.

🤖
by Texmoonbeam
Free
TradingView Indicator
Volume and vPOC Insights
🔑
🌐
✅
Volume and vPOC Insights is a TradingView indicator detecting and displaying the volume point of control (VPOC) on candles with abnormally high volume, filtering noise by leaving out low volume events.
🤖
by MXWLL-Capital-Trading
Free
TradingView Indicator
Market Sessions and TPO (+Forecast)
🔑
🌐
✅
🏅
Market Sessions and TPO (+Forecast) is a free TradingView indicator that combines market sessions based TPO profiles in lettering and bar formats, with statistical forecast for future price paths.

🤖
by TradingView
Free
TradingView Indicator
CVD - Cumulative Volume Delta (Chart)
🔑
✅
🏅
Cumulative Volume Delta (CVD) is a TradingView indicator that displays cumulative volume delta as an on-chart oscillator, using intrabar data for more precise volume analysis.

🤖
by TradingView
Free
TradingView Indicator
CVD - Cumulative Volume Delta Candles
🔑
✅
🏅
CVD - Cumulative Volume Delta Candles is displays cumulative volume delta as candlesticks using intrabar data, offering more precise volume information over a longer period of time.

🤖
by noop-noop
Free
TradingView Indicator
Market Profile Fixed View
🔑
✅
Market Profile Fixed View is a TradingView indicator that visualizes market profiles using a fixed view without relying on volume data, enabling orderflow analysis for instruments the information.

🤖
by KioseffTrading
Free
TradingView Indicator
Dynamic Liquidity Map [Kioseff Trading]
🔑
🌐
🏅
Dynamic Liquidity Map [Kioseff Trading] is a free TradingView indicator that visualizes volume and open interest deltas visualized in a heatmap style.
🤖
by Alien_Algorithms
Free
TradingView Indicator
Crypto Liquidation Heatmap
🔑
Crypto Liquidation Heatmap is a free TradingView volume indicator that uses Open Interest to estimate and display potential crypto liquidation zones at various price levels in a heatmap style. Identify high-risk liquidation areas across various crypto assets.
🤖
by LeviathanCapital
Free
TradingView Indicator
Volume and Price Z-Score [Multi-Asset] - By Leviathan
🔑
✅
Volume and Price Z-Score [Multi-Asset] is a TradingView Indicator providing Z-Score analysis of price and volume for up to 200 symbols. Features include scatter plots, histograms and heatmaps to visualize the relationship between price movements and trading volume.
🤖
by LeviathanCapital
Free
TradingView Indicator
Volume / Open Interest "Footprint" - By Leviathan
🔑
🌐
✅
Volume Open Interest Footprint by Leviathan is a TradingView indicator that visualizes trading activity using footprint-style bars based on aggregated volume or open interest data within the visible chart range. The indicator offers three heatmap options: Volume Delta/OI Delta, Total Volume/Total OI, and Buy vs Sell Volume/OI changes.
🤖
by KioseffTrading
Free
TradingView Indicator
Delta Ladder [Kioseff Trading]
🔑
🌐
✅
Delta Ladder [Kioseff Trading] is a free TradingView Indicator that visualizes buy and sell volume at price. This indicator presents volume delta data in various formats, such as Classic mode with volume delta based colored boxes and numeral volume information.
🤖
by LeviathanCapital
Free
TradingView Indicator
Volume Suite - By Leviathan (CVD, Volume Delta, Relative Volume)
🔑
🌐
✅
Volume Suite by Leviathan is a TradingView indicator that combines multiple volume metrics like CVD, Volume Delta, Relative Volume, Buy/Sell Volume and Cumulative Relative Volume into one single view. Offers customizable visualizations, highlighting significant volume and price anomalies.
🤖
by KioseffTrading
Free
TradingView Indicator
Liquidation Ranges + Volume/OI Dots [Kioseff Trading]
🔑
🌐
✅
🏅
Liquidation Ranges + Volume/OI Dots by Kioseff Trading is a TradingView indicator that combines multiple volumetric tools in one. View high volume events (volume dots), liquidation ranges on crypto assets and key points of interest to highlight support and resistance areas.
🤖
by LeviathanCapital
Free
TradingView Indicator
Open Interest Suite [Aggregated] - By Leviathan
🔑
🌐
✅
🏅
Open Interest Suite [Aggregated] by Leviathan is an Indicator that utilizes aggregated Open Interest data to visualize market interest through OI candles, Open Interest Delta and their distribution profiles. It also features innovative metrics like OI x rVOL, OI RSI, an OI Distribution profile and a statistics screener for keeping up with the data.
🤖
by LeviathanCapital
Free
TradingView Indicator
Open Interest Profile [Fixed Range] - By Leviathan
🔑
🌐
✅
🏅
Open Interest Profile [Fixed Range] by Leviathan is a TradingView indicator that aggregates open interest data over a user-specified fixed range, offering a range of tools and metrics like OI Delta Profile, Positive Delta Levels, OI Heatmap, Range Levels, OIWAP and POCs.
🤖
by LeviathanCapital
Free
TradingView Indicator
Net Positions (Net Longs & Net Shorts) - By Leviathan
🔑
🌐
🏅
Net Positions (Net Longs & Net Shorts) by Leviathan is a free TradingView indicator that visualizes net long and short market positions using various methods. It includes tools like NL/NS Profile, Delta, Ratio, Volume Heatmap, Divergence Finder, RSI, EMAs and VWMAs. Author notes this is an experimental tool.
🤖
by KioseffTrading
Free
TradingView Indicator
Zig-Zag Volume Profile (Bull vs. Bear) [Kioseff Trading]
🔑
🌐
Zig-Zag Volume Profile (Bull vs. Bear) [Kioseff Trading] is a TradingView indicator that displays bullish and bearish volume distributions using unique Zig-Zag style visualization.
🤖
by LeviathanCapital
Free
TradingView Indicator
Open Interest Delta - By Leviathan
🔑
🌐
✅
🏅
Open Interest Delta - By Leviathan is a TradingView indicator that visualizes changes in open interest by plotting Open Interest Delta. It includes heatmap style extreme ranges and color-coded candles to highlight bars with significant increases or decreases in open interest.
🤖
by NXT2017
Free
TradingView Indicator
VolumeHeatmap | Experimental Version of Marketorders Matrix
🔑
🌐
VolumeHeatmap is a free experimental TradingView indicator that visualizes buy/sell orders in liquidity heatmap style, keeps track of changing volume dynamics and displays points of control (POC) occuring over time.
🤖
by LeviathanCapital
Free
TradingView Indicator
Volume Bars - Leviathan x Tradingriot
🔑
🌐
✅
🏅
Volume Bars - Leviathan x Tradingriot is a TradingView indicator streamlines volume analysis by coloring volume bars based on relative volume anomalies and price movement criteria to visualize key market moments, such as trend exhaustion or indecision.
🤖
by KioseffTrading
Free
TradingView Indicator
TPO Market Profile [Kioseff Trading]
🔑
🌐
✅
TPO Market Profile [Kioseff Trading] is a TradingView Indicator that displays a market profile distribution of time. The indicator maps out how much time was spent at each price level, working on all timeframes. Users can fully customize when the profile resets (e.g., daily or every few hours/days) and can also view profiles from past sessions. Important levels like Point of Control (POC) and the Value Area (VAH/VAL) included.
🤖
by KioseffTrading
Free
TradingView Indicator
TPO Letters [Kioseff Trading]
🔑
🌐
🏅
TPO Letters [Kioseff Trading] is a free TradingView indicator that visualizes classic market profile letters separately, representing the chronological sequence of price formation for selected period.
🤖
by KioseffTrading
Free
TradingView Indicator
Rain Flow Candles
🔑
🏅
Rain Flow Candles is a TradingView indicator that aggregates volume data from lower timeframes to create a volume profile on a higher timeframe in unique rainflow style visuals, illustrating how volume is distributed across different price levels.
🤖
by EmreKb
Free
TradingView Indicator
Volume Density by EmreKb
🔑
🏅
Volume Density by EmreKb is a TradingView indicator that visualizes volume distribution within each candle using color intensity, highlighting price levels with high volume activity using more intense colors.
🤖
by dharmatech
Free
TradingView Indicator
Global Net Liquidity
🔑
✅
Global Net Liquidity is a free TradingView indicator that calculates global net liquidity by aggregating all major central banks' liquidity into one view.
🤖
by MXWLL-Capital-Trading
Free
TradingView Indicator
Genuine Liquidation Delta [Mxwll] - No Estimates
🔑
✅
🏅
Genuine Liquidation Delta [Mxwll] - No Estimates is a free TradingView indicator that displays real-time liquidation delta data for over 100 cryptocurrencies, sourced directly from a popular crypto exchange.
🤖
by Texmoonbeam
Free
TradingView Indicator
All-In-One Auto Anchored VWAPs
🔑
🌐
✅
All-In-One Auto Anchored VWAPs is a free TradingView indicator that draws multiple volume weighted average prices from various chart points, allowing customization of up to three anchored VWAPs with different anchor periods.
🤖
by tradeforopp
Free
TradingView Indicator
Volume Profile [TFO]
🔑
🌐
✅
🏅
Volume Profile [TFO] is a TradingView indicator that calculate a classical volume profile with added key featurees like points of control (POC), high volume nodes (HVN) and more.
🤖
by LeviathanCapital
Free
TradingView Indicator
Volume and Price Z-Score [Multi-Asset] - By Leviathan
🔑
✅
Volume and Price Z-Score [Multi-Asset] is a TradingView Indicator providing Z-Score analysis of price and volume for up to 200 symbols. Features include scatter plots, histograms and heatmaps to visualize the relationship between price movements and trading volume.
🤖
by LeviathanCapital
Free
TradingView Indicator
Volume / Open Interest "Footprint" - By Leviathan
🔑
🌐
✅
Volume Open Interest Footprint by Leviathan is a TradingView indicator that visualizes trading activity using footprint-style bars based on aggregated volume or open interest data within the visible chart range. The indicator offers three heatmap options: Volume Delta/OI Delta, Total Volume/Total OI, and Buy vs Sell Volume/OI changes.
🤖
by KioseffTrading
Free
TradingView Indicator
Delta Ladder [Kioseff Trading]
🔑
🌐
✅
Delta Ladder [Kioseff Trading] is a free TradingView Indicator that visualizes buy and sell volume at price. This indicator presents volume delta data in various formats, such as Classic mode with volume delta based colored boxes and numeral volume information.
🤖
by LeviathanCapital
Free
TradingView Indicator
Volume Suite - By Leviathan (CVD, Volume Delta, Relative Volume)
🔑
🌐
✅
Volume Suite by Leviathan is a TradingView indicator that combines multiple volume metrics like CVD, Volume Delta, Relative Volume, Buy/Sell Volume and Cumulative Relative Volume into one single view. Offers customizable visualizations, highlighting significant volume and price anomalies.
🤖
by KioseffTrading
Free
TradingView Indicator
Liquidation Ranges + Volume/OI Dots [Kioseff Trading]
🔑
🌐
✅
🏅
Liquidation Ranges + Volume/OI Dots by Kioseff Trading is a TradingView indicator that combines multiple volumetric tools in one. View high volume events (volume dots), liquidation ranges on crypto assets and key points of interest to highlight support and resistance areas.
🤖
by LeviathanCapital
Free
TradingView Indicator
Open Interest Suite [Aggregated] - By Leviathan
🔑
🌐
✅
🏅
Open Interest Suite [Aggregated] by Leviathan is an Indicator that utilizes aggregated Open Interest data to visualize market interest through OI candles, Open Interest Delta and their distribution profiles. It also features innovative metrics like OI x rVOL, OI RSI, an OI Distribution profile and a statistics screener for keeping up with the data.
🤖
by LeviathanCapital
Free
TradingView Indicator
Open Interest Profile [Fixed Range] - By Leviathan
🔑
🌐
✅
🏅
Open Interest Profile [Fixed Range] by Leviathan is a TradingView indicator that aggregates open interest data over a user-specified fixed range, offering a range of tools and metrics like OI Delta Profile, Positive Delta Levels, OI Heatmap, Range Levels, OIWAP and POCs.
🤖
by LeviathanCapital
Free
TradingView Indicator
Net Positions (Net Longs & Net Shorts) - By Leviathan
🔑
🌐
🏅
Net Positions (Net Longs & Net Shorts) by Leviathan is a free TradingView indicator that visualizes net long and short market positions using various methods. It includes tools like NL/NS Profile, Delta, Ratio, Volume Heatmap, Divergence Finder, RSI, EMAs and VWMAs. Author notes this is an experimental tool.
🤖
by KioseffTrading
Free
TradingView Indicator
Zig-Zag Volume Profile (Bull vs. Bear) [Kioseff Trading]
🔑
🌐
Zig-Zag Volume Profile (Bull vs. Bear) [Kioseff Trading] is a TradingView indicator that displays bullish and bearish volume distributions using unique Zig-Zag style visualization.
🤖
by LeviathanCapital
Free
TradingView Indicator
Open Interest Delta - By Leviathan
🔑
🌐
✅
🏅
Open Interest Delta - By Leviathan is a TradingView indicator that visualizes changes in open interest by plotting Open Interest Delta. It includes heatmap style extreme ranges and color-coded candles to highlight bars with significant increases or decreases in open interest.
Discover trading edge
Discover trading edge
Indicators, Platforms & Education
Indicators, Platforms & Education
TradersList
Discover trading edge
Join Telegram
Weekly listings
Join Telegram
Disclaimer
Our goal is to achieve greater transparency, guidance and safety in trading and investing by providing means to discover, research and discuss trading/investing related sites/services.
Content provided on this site is not financial advice, meant for educational purposes only. TradersList does not endorse or guarantee any result for listed sites/services. Do your own research.
Read full disclaimer
TradersList
Discover trading edge
Join Telegram
Disclaimer
Our goal is to achieve greater transparency, guidance and safety in trading and investing by providing means to discover, research and discuss trading/investing related sites/services.
Content provided on this site is not financial advice, meant for educational purposes only. TradersList does not endorse or guarantee any result for listed sites/services. Do your own research.
Read full disclaimer