

From TradersList Editors
From TradersList Editors
Leverage volume-colored candle insights to identify trading anomalies and trends using VPA principles on ThinkOrSwim.
Leverage volume-colored candle insights to identify trading anomalies and trends using VPA principles on ThinkOrSwim.


ThinkOrSwim Indicator
ThinkOrSwim Indicator
VPA Reversal Candle Anomaly Detector Indicator for ThinkOrSwim: Volume Price Analysis Signals
VPA Reversal Candle Anomaly Detector Indicator for ThinkOrSwim: Volume Price Analysis Signals
by wiinii on ThinkOrSwim
by wiinii on ThinkOrSwim
🤖
🤖
Reversal Candle Anomaly Detector w/Volume-Colored Candles - VPA For ThinkOrSwim
Reversal Candle Anomaly Detector w/Volume-Colored Candles - VPA For ThinkOrSwim
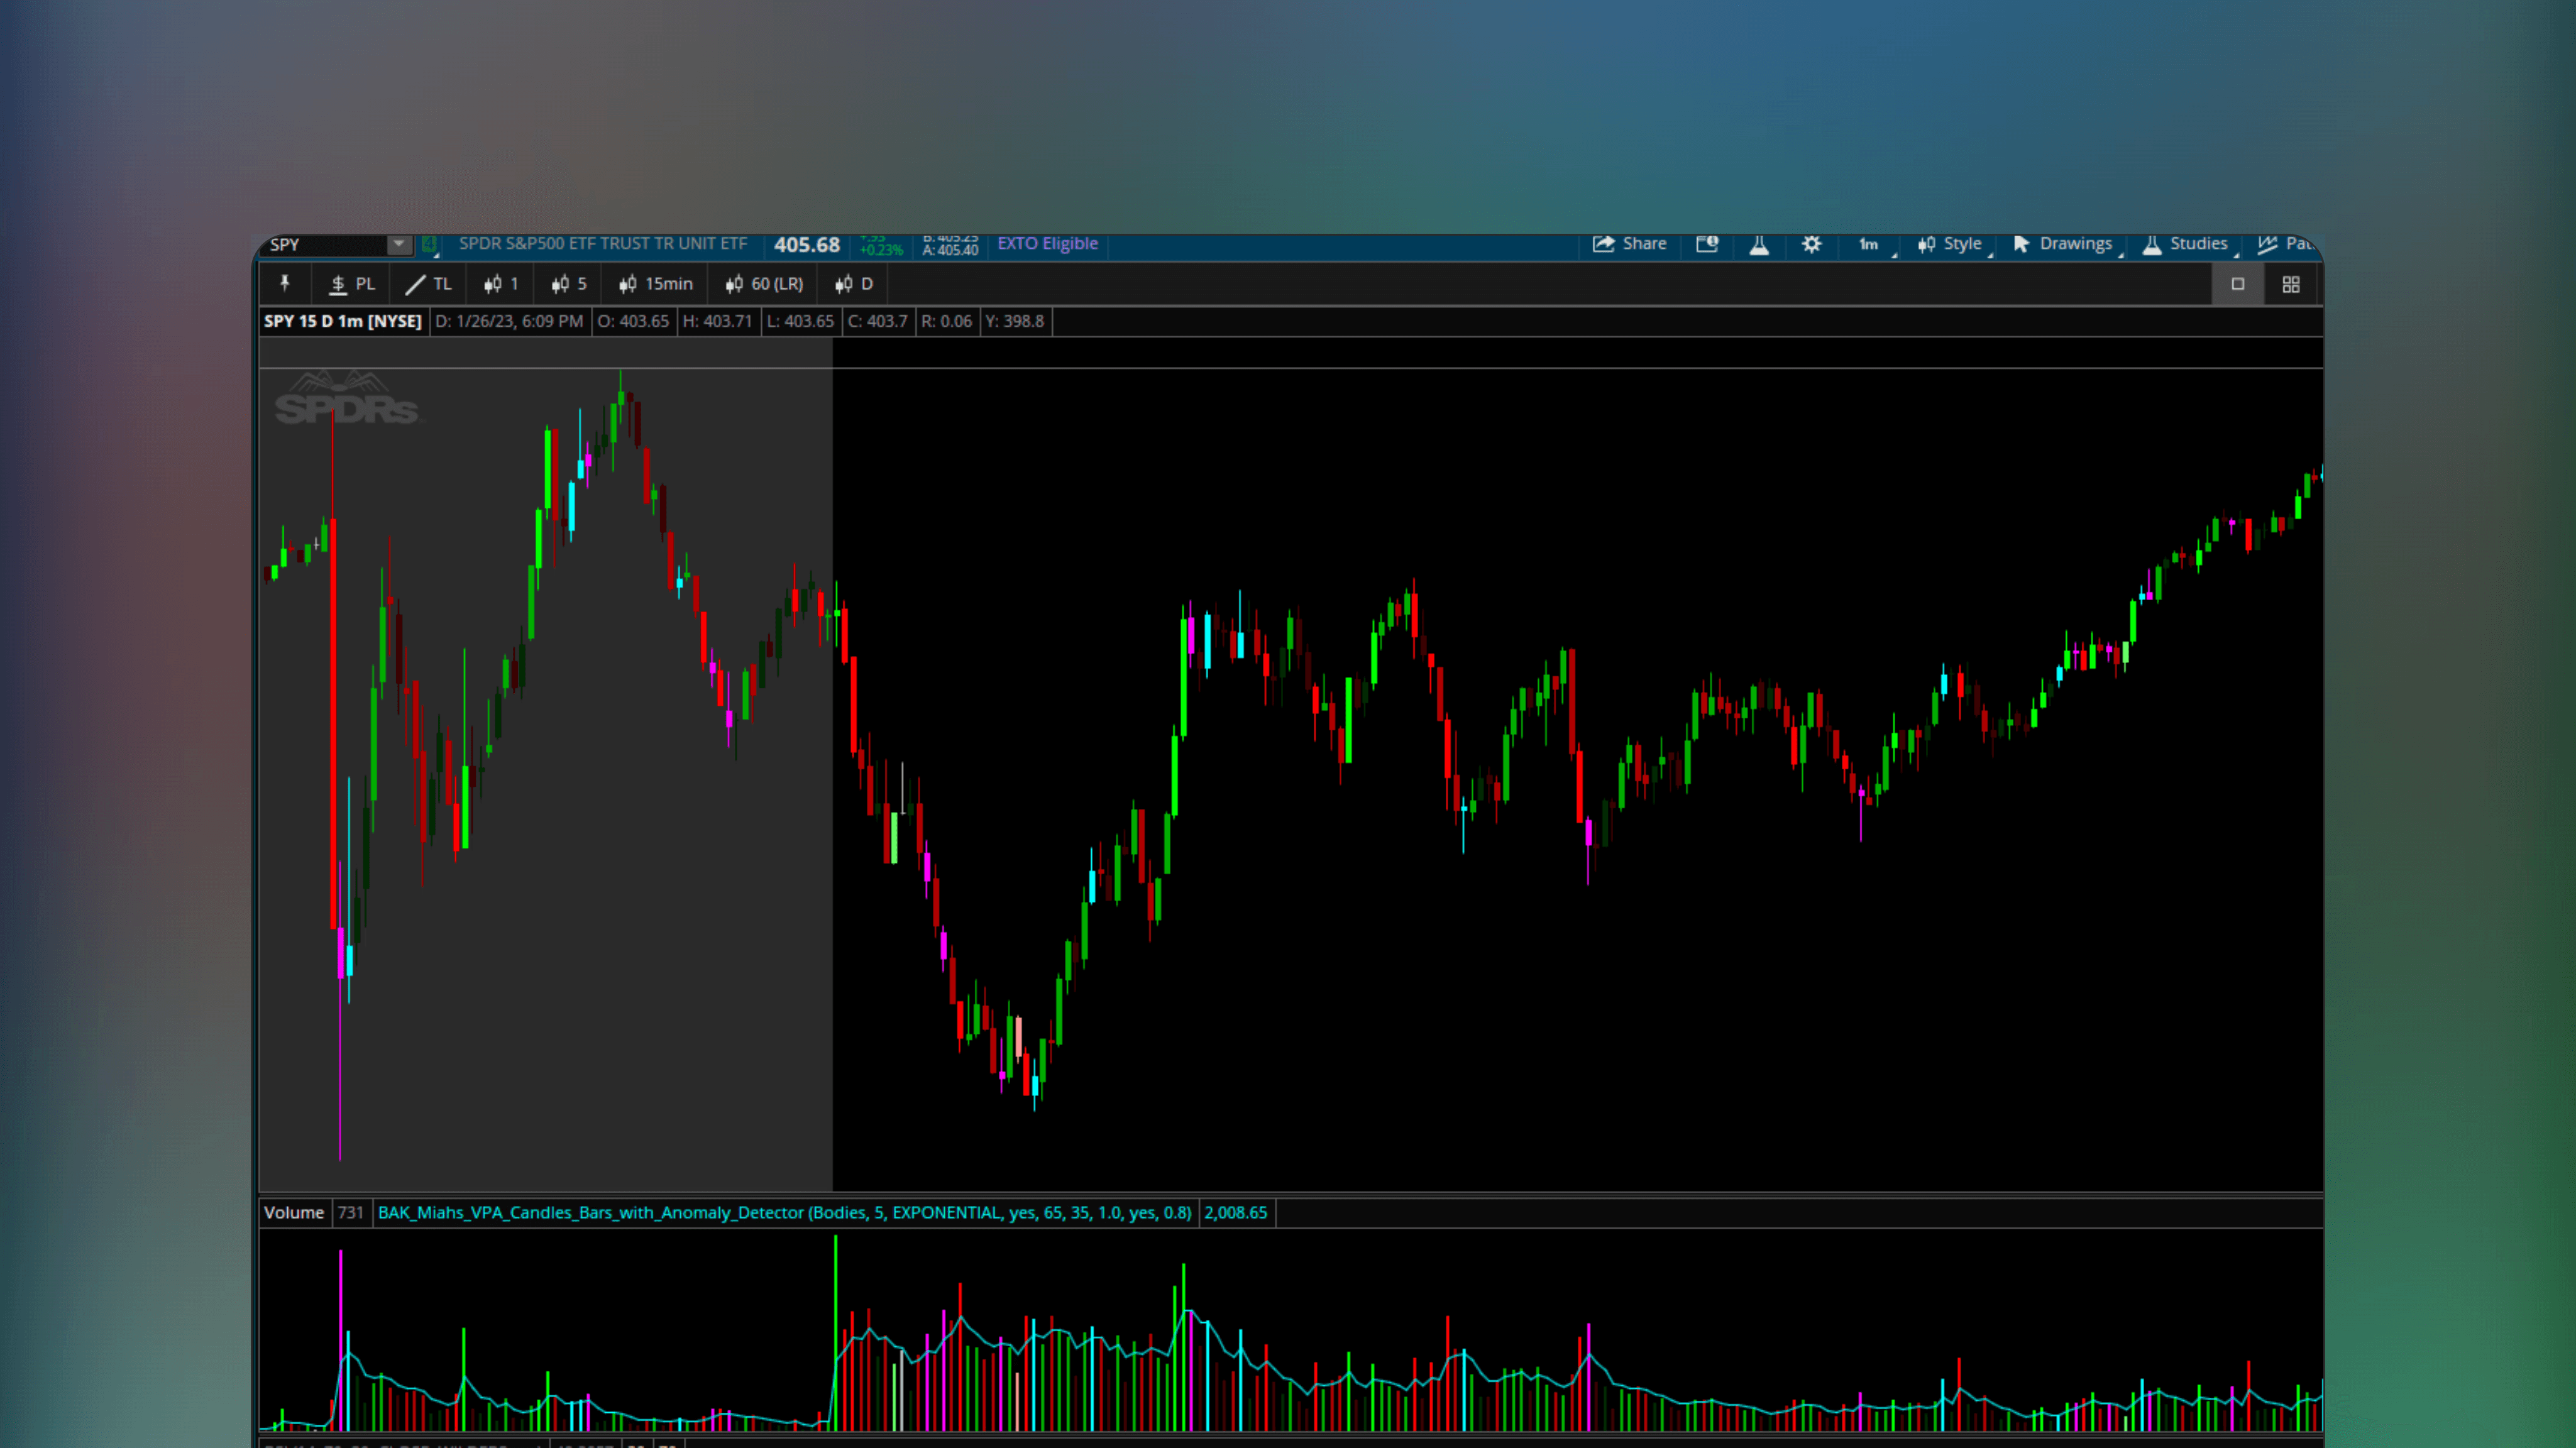
The Reversal Candle Anomaly Detector is a ThinkOrSwim indicator utilizing Volume Price Analysis introduced by Anna Couling and Thor Young. Volume anomalies are displayed using intuitive candle colors.
The Reversal Candle Anomaly Detector is a ThinkOrSwim indicator utilizing Volume Price Analysis introduced by Anna Couling and Thor Young. Volume anomalies are displayed using intuitive candle colors.
Get on ThinkOrSwim
This indicator is available on ThinkOrSwim charting platform. Signing up for a free account and downloading ThinkOrSwim software is required.
Get on ThinkOrSwim
This indicator is available on ThinkOrSwim charting platform. Signing up for a free account and downloading ThinkOrSwim software is required.
🔑
Open Source
Listing has publically available source code that can be audited and modified as needed.
🔑
Open Source
Listing has publically available source code that can be audited and modified as needed.
💸
Free Access
All features of this listing are fully free to use with no pricing tiers. Simply start using.
💸
Free Access
All features of this listing are fully free to use with no pricing tiers. Simply start using.
🌐
Popular Topic
Concepts and theories mentioned in listing are popular topics in web search
🌐
Popular Topic
Concepts and theories mentioned in listing are popular topics in web search
Published by wiinii on ThinkOrSwim
Published by wiinii on ThinkOrSwim
Volume Price Analysis Foundation
This indicator is built on Volume Price Analysis (VPA) principles developed by Anna Couling and Thor Young. VPA examines the relationship between candle range, close position and volume to determine whether smart money is accumulating or distributing. The indicator automates this analysis, detecting anomalies that suggest a potential reversal.
Volume Anomaly Detection
The indicator identifies candles where volume behavior does not match the expected pattern for the price movement. For example, a wide-range down candle on very low volume is an anomaly - it suggests the move lacks conviction and may reverse. Conversely, a narrow-range candle on extremely high volume signals absorption and a potential turning point.


Intuitive Candle Coloring System
Rather than requiring traders to interpret complex data, the indicator colors candles based on volume anomaly type. Different colors represent different conditions - high volume reversals, low volume tests, climactic volume events and so on. This visual system lets traders identify potential reversals instantly by simply reading the candle colors.
Practical Application for Reversal Trading
Traders watch for colored anomaly candles at key support and resistance levels. A volume anomaly candle at a major support zone is a high-probability reversal signal. Combining the VPA-based coloring with traditional technical levels creates a systematic method for spotting institutional activity at price points that matter most.
Volume reversals using anomaly events
Volume reversals using anomaly events
Built on Volume Price Analysis principles by Anna Couling and Thor Young, this indicator detects candles where volume behavior does not match expected patterns for the price movement. Intuitive candle coloring makes anomalies that suggest potential reversals instantly visible.
Built on Volume Price Analysis principles by Anna Couling and Thor Young, this indicator detects candles where volume behavior does not match expected patterns for the price movement. Intuitive candle coloring makes anomalies that suggest potential reversals instantly visible.
Spot price and volume mismatches
The indicator identifies candles where volume does not support the price move, such as wide-range candles on low volume that suggest the move lacks conviction.
Automate VPA pattern detection
Different colors represent different volume anomaly conditions, letting traders identify potential reversals instantly by reading candle colors rather than raw data.
Detect trend exhaustion signals
Climactic volume events and narrow-range candles on extremely high volume signal absorption and potential turning points where smart money may be active.
Common Questions About Volume Price Analysis
Common Questions About Volume Price Analysis
Volume Price Analysis examines the relationship between candle range, close position and volume to detect smart money activity. These questions address how anomalies are identified and what the colored candles indicate.
Volume Price Analysis examines the relationship between candle range, close position and volume to detect smart money activity. These questions address how anomalies are identified and what the colored candles indicate.
What is a volume anomaly and why does it matter?
A volume anomaly occurs when volume behavior does not match expected patterns for the price movement. A wide-range down candle on very low volume suggests the move lacks conviction and may reverse.
What do the different candle colors represent?
Different colors represent different volume conditions including high volume reversals, low volume tests and climactic volume events. This visual system lets you identify potential reversals instantly by reading candle colors.
How do I use VPA signals for trading?
Watch for colored anomaly candles at key support and resistance levels. A volume anomaly candle at a major support zone is a high-probability reversal signal. Combine VPA coloring with traditional technical levels.
🌐
🌐
Web sentiment
Web sentiment
Traders value the Reversal Candle Anomaly Detector w/Volume-Colored Candles for its usefulness, customization, and educational support, enhancing their technical analysis on ThinkorSwim.
Traders value the Reversal Candle Anomaly Detector w/Volume-Colored Candles for its usefulness, customization, and educational support, enhancing their technical analysis on ThinkorSwim.
Source: Online Discussion
Source: Online Discussion
Source: Online Discussion
✍️
✍️
TradersList Reviews (3)
TradersList Reviews (3)
TradersList Community has given this listing three stars, indicating decent trust and value for traders' toolkit. Make sure you understand functionality before using.
TradersList Community has given this listing three stars, indicating decent trust and value for traders' toolkit. Make sure you understand functionality before using.
⭐️
⭐️
⭐️
⭐️
⭐️
Source: TradersList Reviews
Source: TradersList Reviews


Bookmark
Saved here
🤖
Get Indicator
Find Indicator
Review
Review Indicator
✍️
⭐️
⭐️
⭐️
⭐️
⭐️
3
Comments
Read on Telegram
Listing by third party publisher. Not financial advice.
Risk Disclosure


Share Listing
🤖
🤖
Get Indicator
Get Indicator
Find Indicator
Find Indicator
✍️
Review
Review
Review Indicator
Review Indicator
⭐️
⭐️
⭐️
⭐️
⭐️
Saved here
Bookmark
Listing by third party publisher. Not financial advice.
Listing by third party publisher. Not financial advice.
Risk Disclosure
Risk Disclosure
Share
🤖
3


🤖
3
🤖
3
🔥
New Listings
Featured this week

🤖
by allanster


Free
TradingView Indicator
Growing or Waning Patterns [Alerts]
New
🔑
🌐
Growing or Waning Patterns [Alerts] is a TradingView indicator that detects reversal signals based on three candle body patterns. The patterns are classified as increasing or decreasing depending on bullish and bearish states. Additional features include alerts and trend filter.

📟
Free*
Trade Analytics Platform
TRDR.IO
New
🌐
✅
🏅
TRDR.IO is a crypto orderflow platform providing various tools visualizing crypto exchange order book activity. See bid-ask imbalances, buy and sell demand as well as order book depth in real-time with intuitive visual overlays. Additional features include alerts and scanning crypto markets for orderflow events.

🤖
by LeviathanCapital
Free
TradingView Indicator
Swing Levels and Liquidity - By Leviathan
New
🔑
🌐
✅
Swing Levels and Liquidity is a TradingView Indicator that displays swing high and low levels with volume traded at the pivots. Once formed, these levels likely retain liquidity that traders can expect to produce support and resistance in price when swept.
🤖
by allanster
Free
TradingView Indicator
Growing or Waning Patterns [Alerts]
New
🔑
🌐
Growing or Waning Patterns [Alerts] is a TradingView indicator that detects reversal signals based on three candle body patterns. The patterns are classified as increasing or decreasing depending on bullish and bearish states. Additional features include alerts and trend filter.
📟
Free*
Trade Analytics Platform
TRDR.IO
New
🌐
✅
🏅
TRDR.IO is a crypto orderflow platform providing various tools visualizing crypto exchange order book activity. See bid-ask imbalances, buy and sell demand as well as order book depth in real-time with intuitive visual overlays. Additional features include alerts and scanning crypto markets for orderflow events.
Load More
🤖
Similar Listings
Traders also viewed
All


🤖
by traderzen
Free
ThinkOrSwim Indicator
MTF Anticipated Price Level Indicator For ThinkOrSwim
🔑
🌐
MTF Anticipated Price Level Indicator for ThinkOrSwim is an indicator that uses Multi-Time Frame analysis and VWAP profiles to identify anticipated points of interest based on historical price data.

🤖
by m_morisette
Free
ThinkOrSwim Indicator
Standard Deviation Channels X3 For ThinkOrSwim
🔑
🌐
✅
Standard Deviation Channels X3 For ThinkOrSwim is an Indicator that calculates standard deviation channels to visualize statistical deviations from the mean, enabling users to identify potential trend reversions based on historical price action.

🤖
by cos251
Free
ThinkOrSwim Indicator
Phoenix Finder Trend Strength Indicator For ThinkOrSwim
🔑
🏅
Phoenix Finder Trend Strength Indicator for ThinkorSwim is an Indicator that plots candles for 14 stocks based on Phoenix Strength, identifying trending states within specific sectors. Spot outperforming stocks at glance using this indicator.

🤖
by benten
Free
ThinkOrSwim Indicator
High Probability Setup Indicator For ThinkOrSwim
🔑
🏅
The High Probability Setup Indicator for ThinkorSwim is an indicator based on another TradingView Indicato highlighting reversal setups with stacked confluence from multiple indicators. Includes distinction between low, medium and high probability signals based on amount of confluence involved.

🤖
by goingdark365
Free
ThinkOrSwim Indicator
Bollinger bandswith Rsi ,Mfi, Rvol For ThinkOrSwim
🔑
🌐
Bollinger bandswith Rsi, Mfi, Rvol For ThinkOrSwim is a free ThinkOrSwim indicator combining Bollinger Bands with RSI, MFI, and relative volume into one for reading sentiment from multiple indicators in one view.

🤖
by mbarcala
Free
ThinkOrSwim Indicator
dBands Upper Indicator For ThinkOrSwim
🔑
🌐
✅
dBands Upper Indicator For ThinkOrSwim is a free Indicator that combines Bollinger Bands and Keltner Channel into one tool with variety of customziation options. Useful for identifying support, resistance as well as potential breakouts.
🤖
by ommni007
Free
ThinkOrSwim Indicator
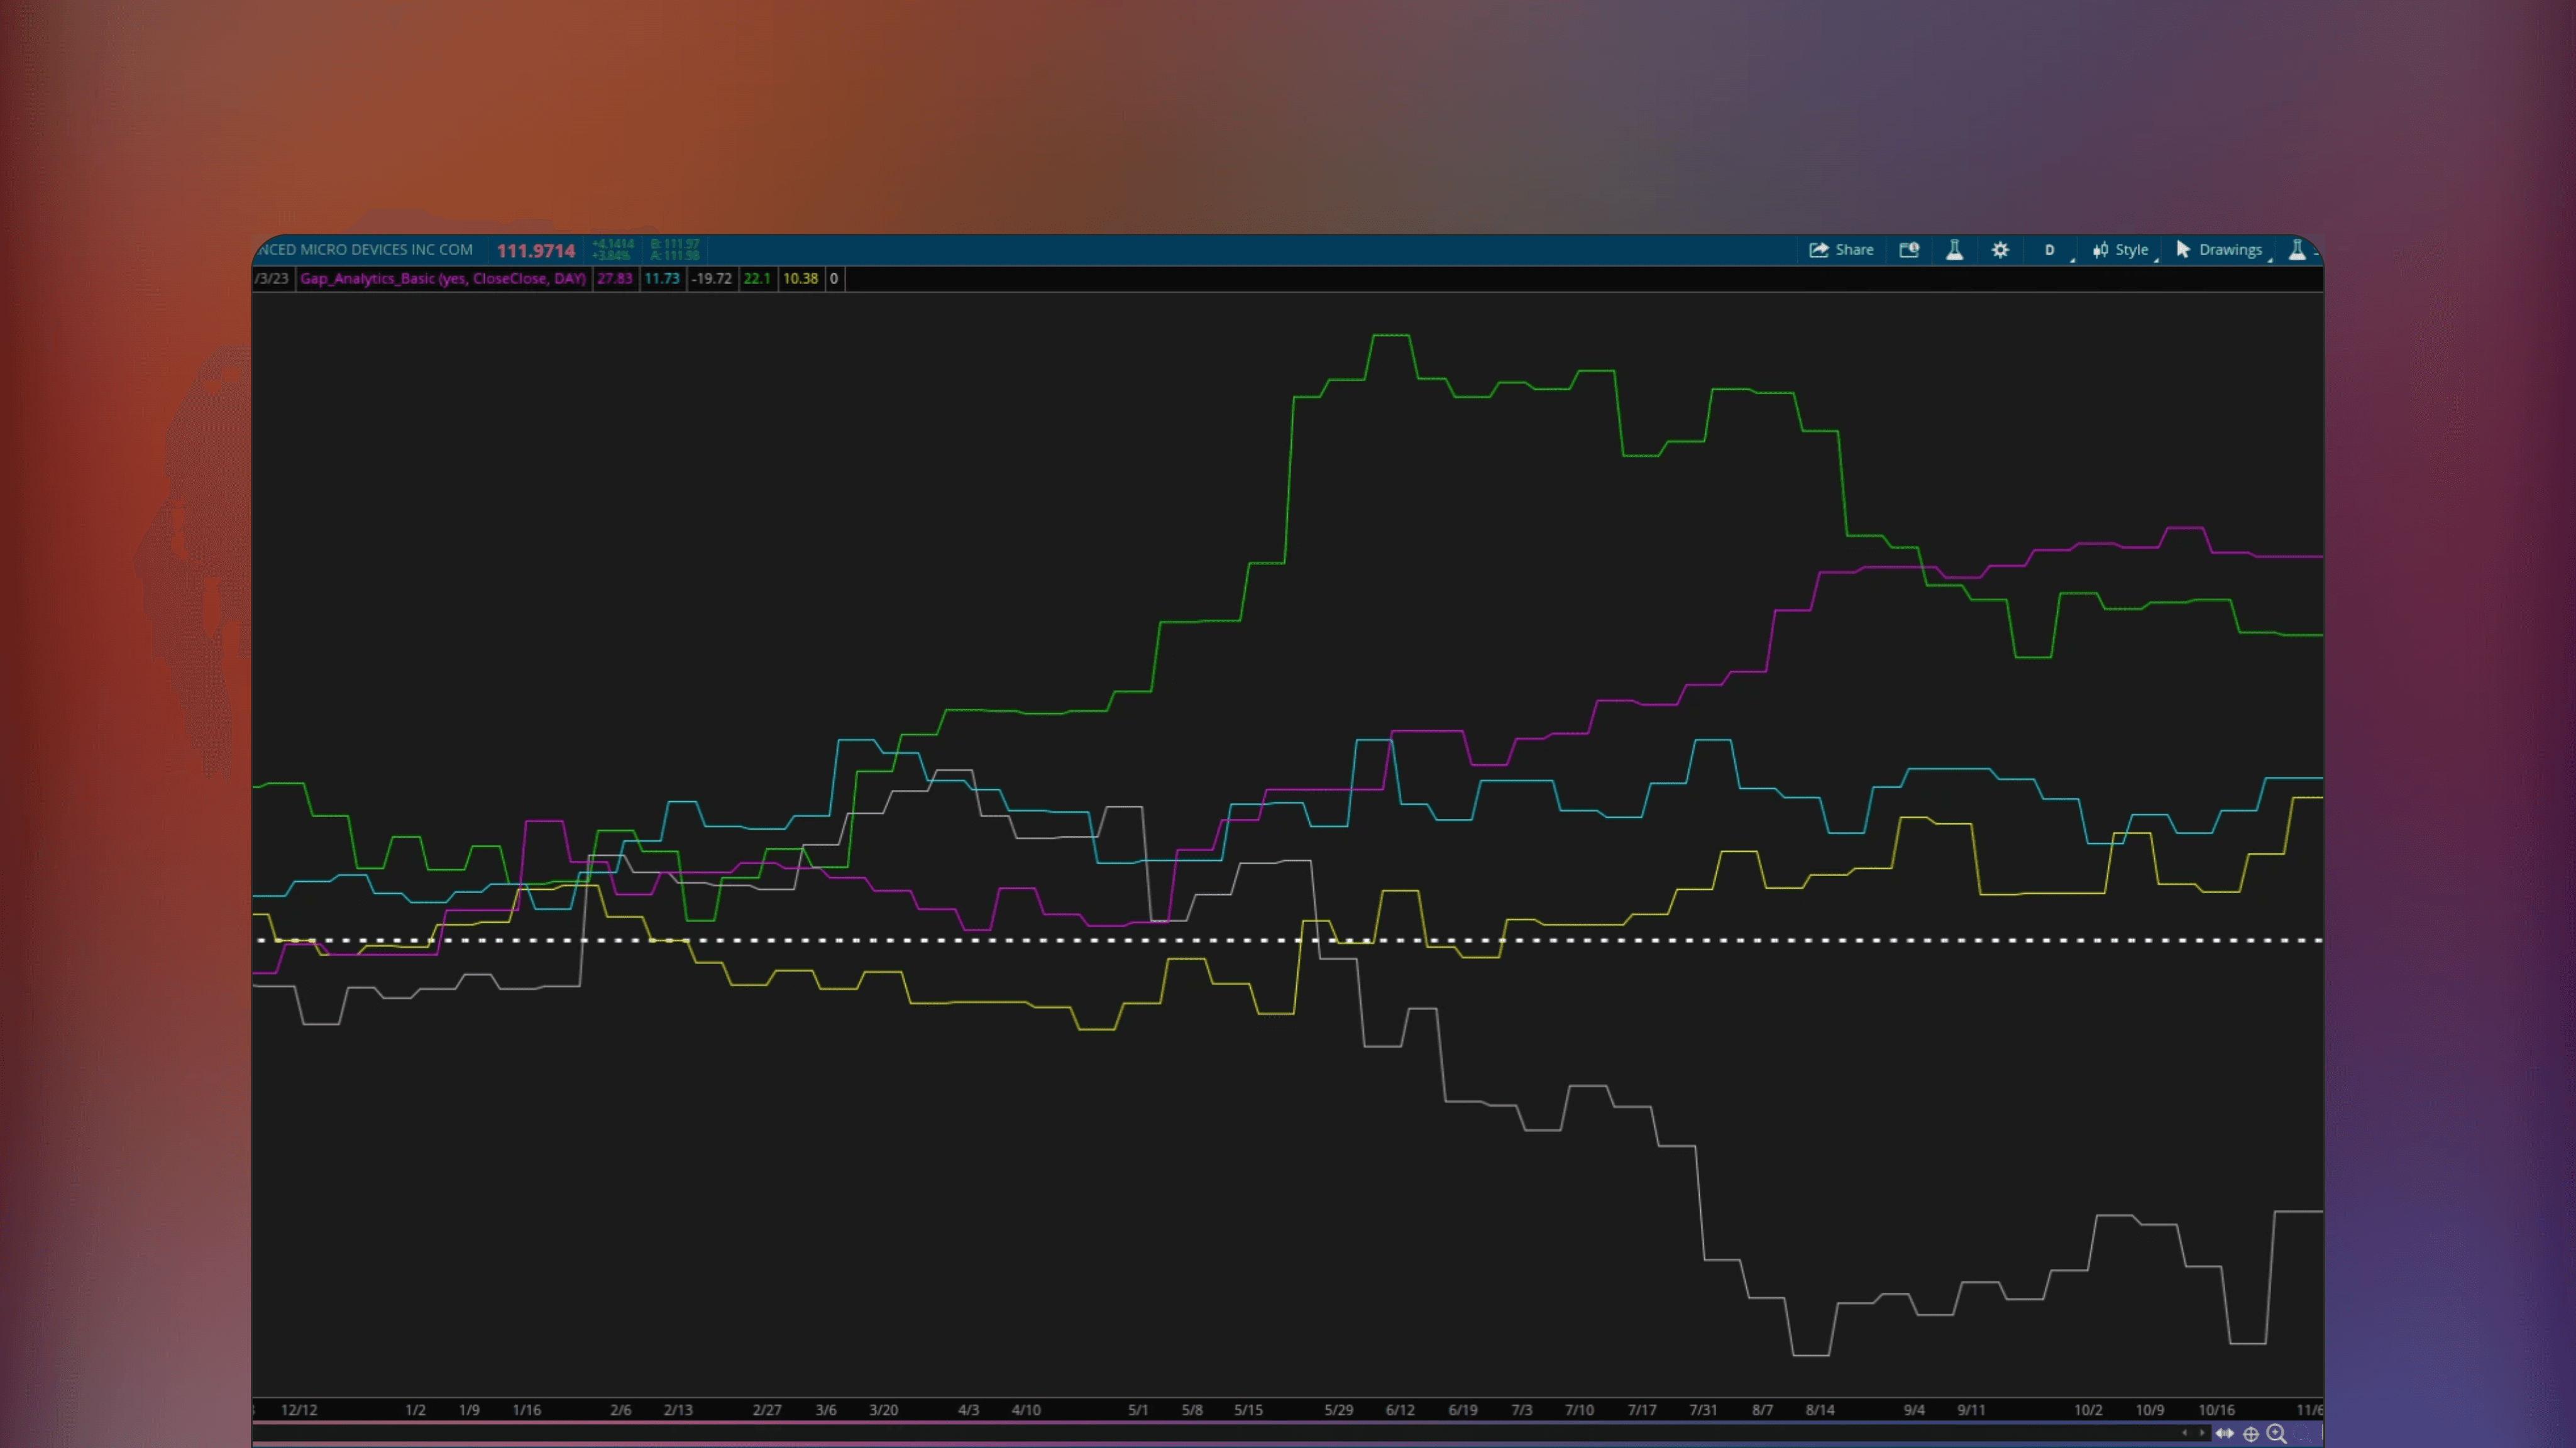
Day of Week Gap Analytics For ThinkOrSwim
🔑
✅
Day of Week Gap Analytics For ThinkOrSwim is a free Indicator that analyzes cumulative tick changes on gap bars for each day of the week for discovering time based statistical edge.

🤖
by benten
Free
ThinkOrSwim Indicator
Rahul Mohindar Oscillator (RMO) Indicator For ThinkOrSwim
🔑
The Rahul Mohindar Oscillator (RMO) Indicator for ThinkorSwim identifies potential market reversals and momentum slowdowns based on the oscillator movement. Useful for visually identifying different trending stages.

🤖
by tptrades
Free
ThinkOrSwim Indicator
Wick Pressure For ThinkOrSwim
🔑
Wick Pressure For ThinkOrSwim is an Indicator that analyzes multiple wick formations at overbought and oversold levels for a filtered and refined identifying of buying and selling pressure.
🤖
by benten
Free
ThinkOrSwim Indicator
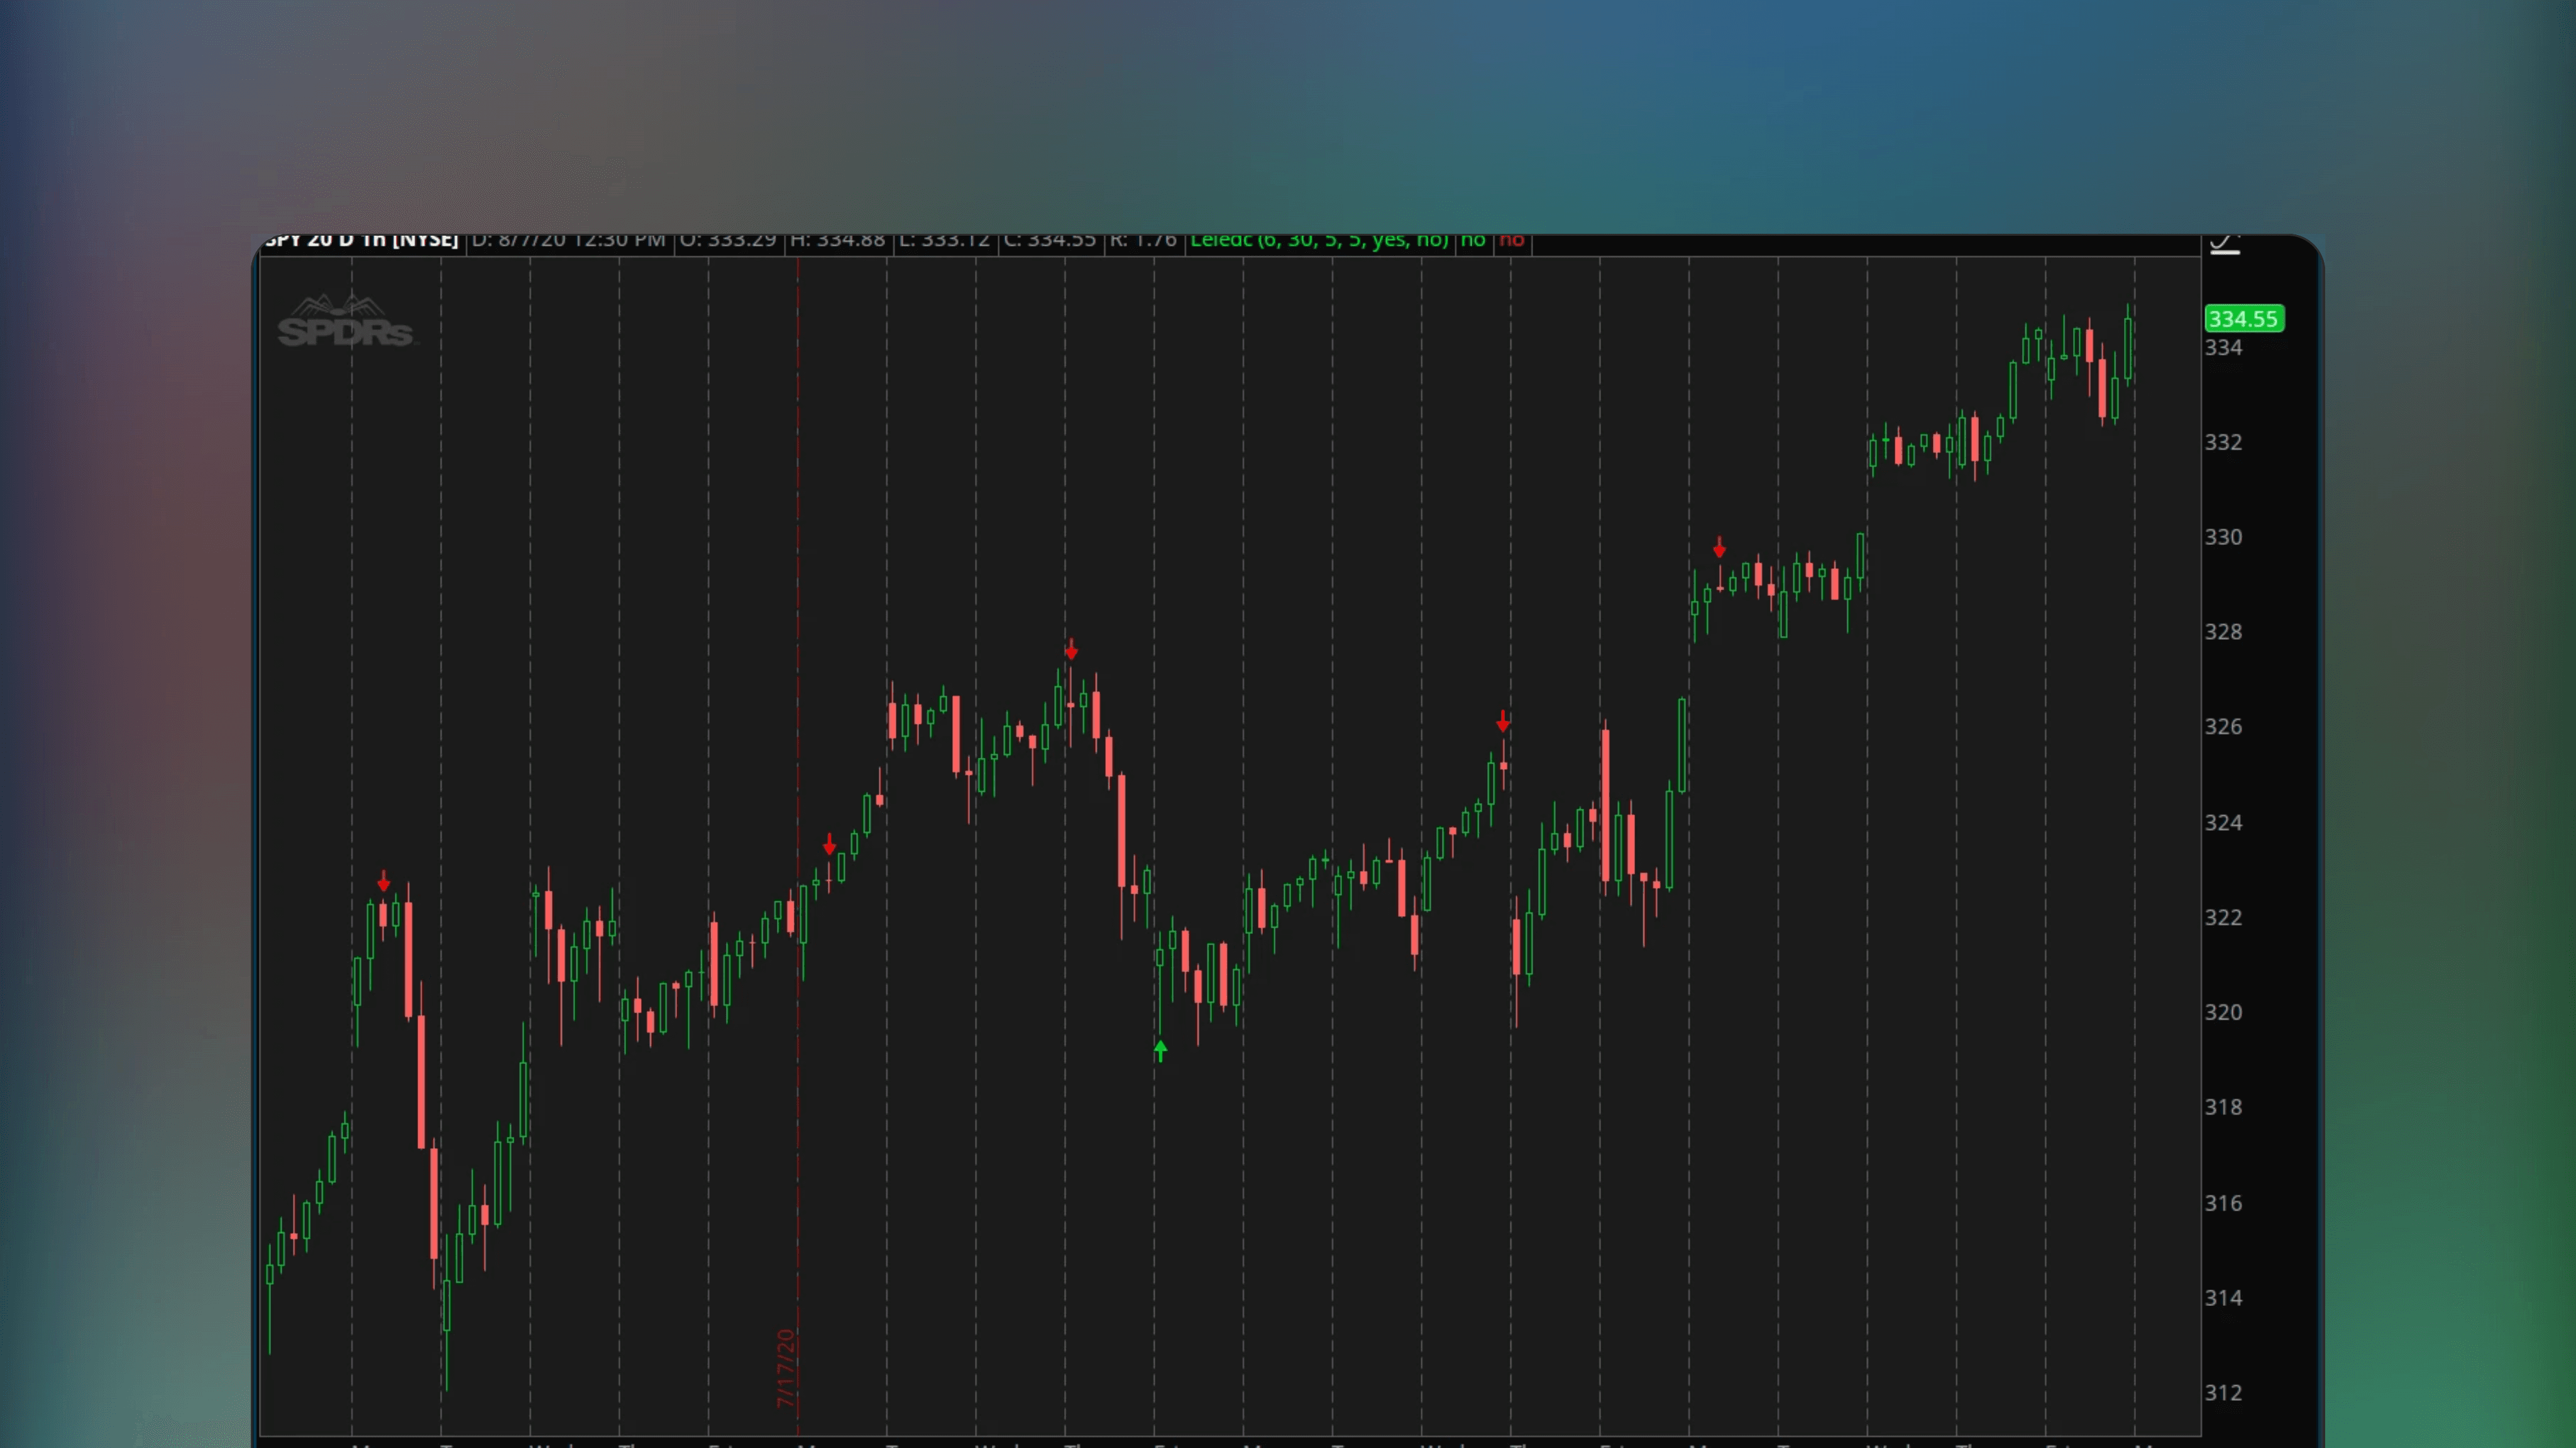
Leledc Exhaustion Indicator For ThinkOrSwim
🔑
Leledc Exhaustion Indicator for ThinkorSwim is an indicator based on price action patterns associated with potential trend exhaustion, signaling when a trend may be ending or nearing a correction in its current direction.

🤖
by armybender
Free
ThinkOrSwim Indicator
Ehler's Instantaneous Trend [LazyBear] For ThinkOrSwim
🔑
Ehler's Instantaneous Trend [LazyBear] For ThinkOrSwim is a free moving average Indicator based on Ehler's Instantaneous Trend. This moving average is calculated based on John Ehler's earliest implementations, acting similarly to Hull Moving Average (HMA) with minimal lag.

🤖
by greco26
Free
ThinkOrSwim Indicator
Fair Value Gap (FVG) For ThinkOrSwim
🔑
✅
Fair Value Gap (FVG) For ThinkOrSwim is an Indicator that identifies fair value gaps - areas of supply and demand mismatch - on intraday charts by plotting magenta and green lines.

🤖
by rlohmeyer
Free
ThinkOrSwim Indicator
Relative Opening Range Stats For ThinkOrSwim
🔑
🌐
Relative Opening Range Stats For ThinkOrSwim is a ThinkOrSwim Indicator that uses community-developed code to analyze the first and last bars of each trading day and their relative volumes, identifying key market periods based on opening range statistics.
🤖
by markos
Free
ThinkOrSwim Indicator
Fractal Boxes by Mobius For ThinkOrSwim
🔑
Fractal Boxes by Mobius for ThinkorSwim is an indicator that uses altered fractals to identify and highlight market states, such as breakouts, consolidation and trends up/down.
🤖
by rlohmeyer
Free
ThinkOrSwim Indicator
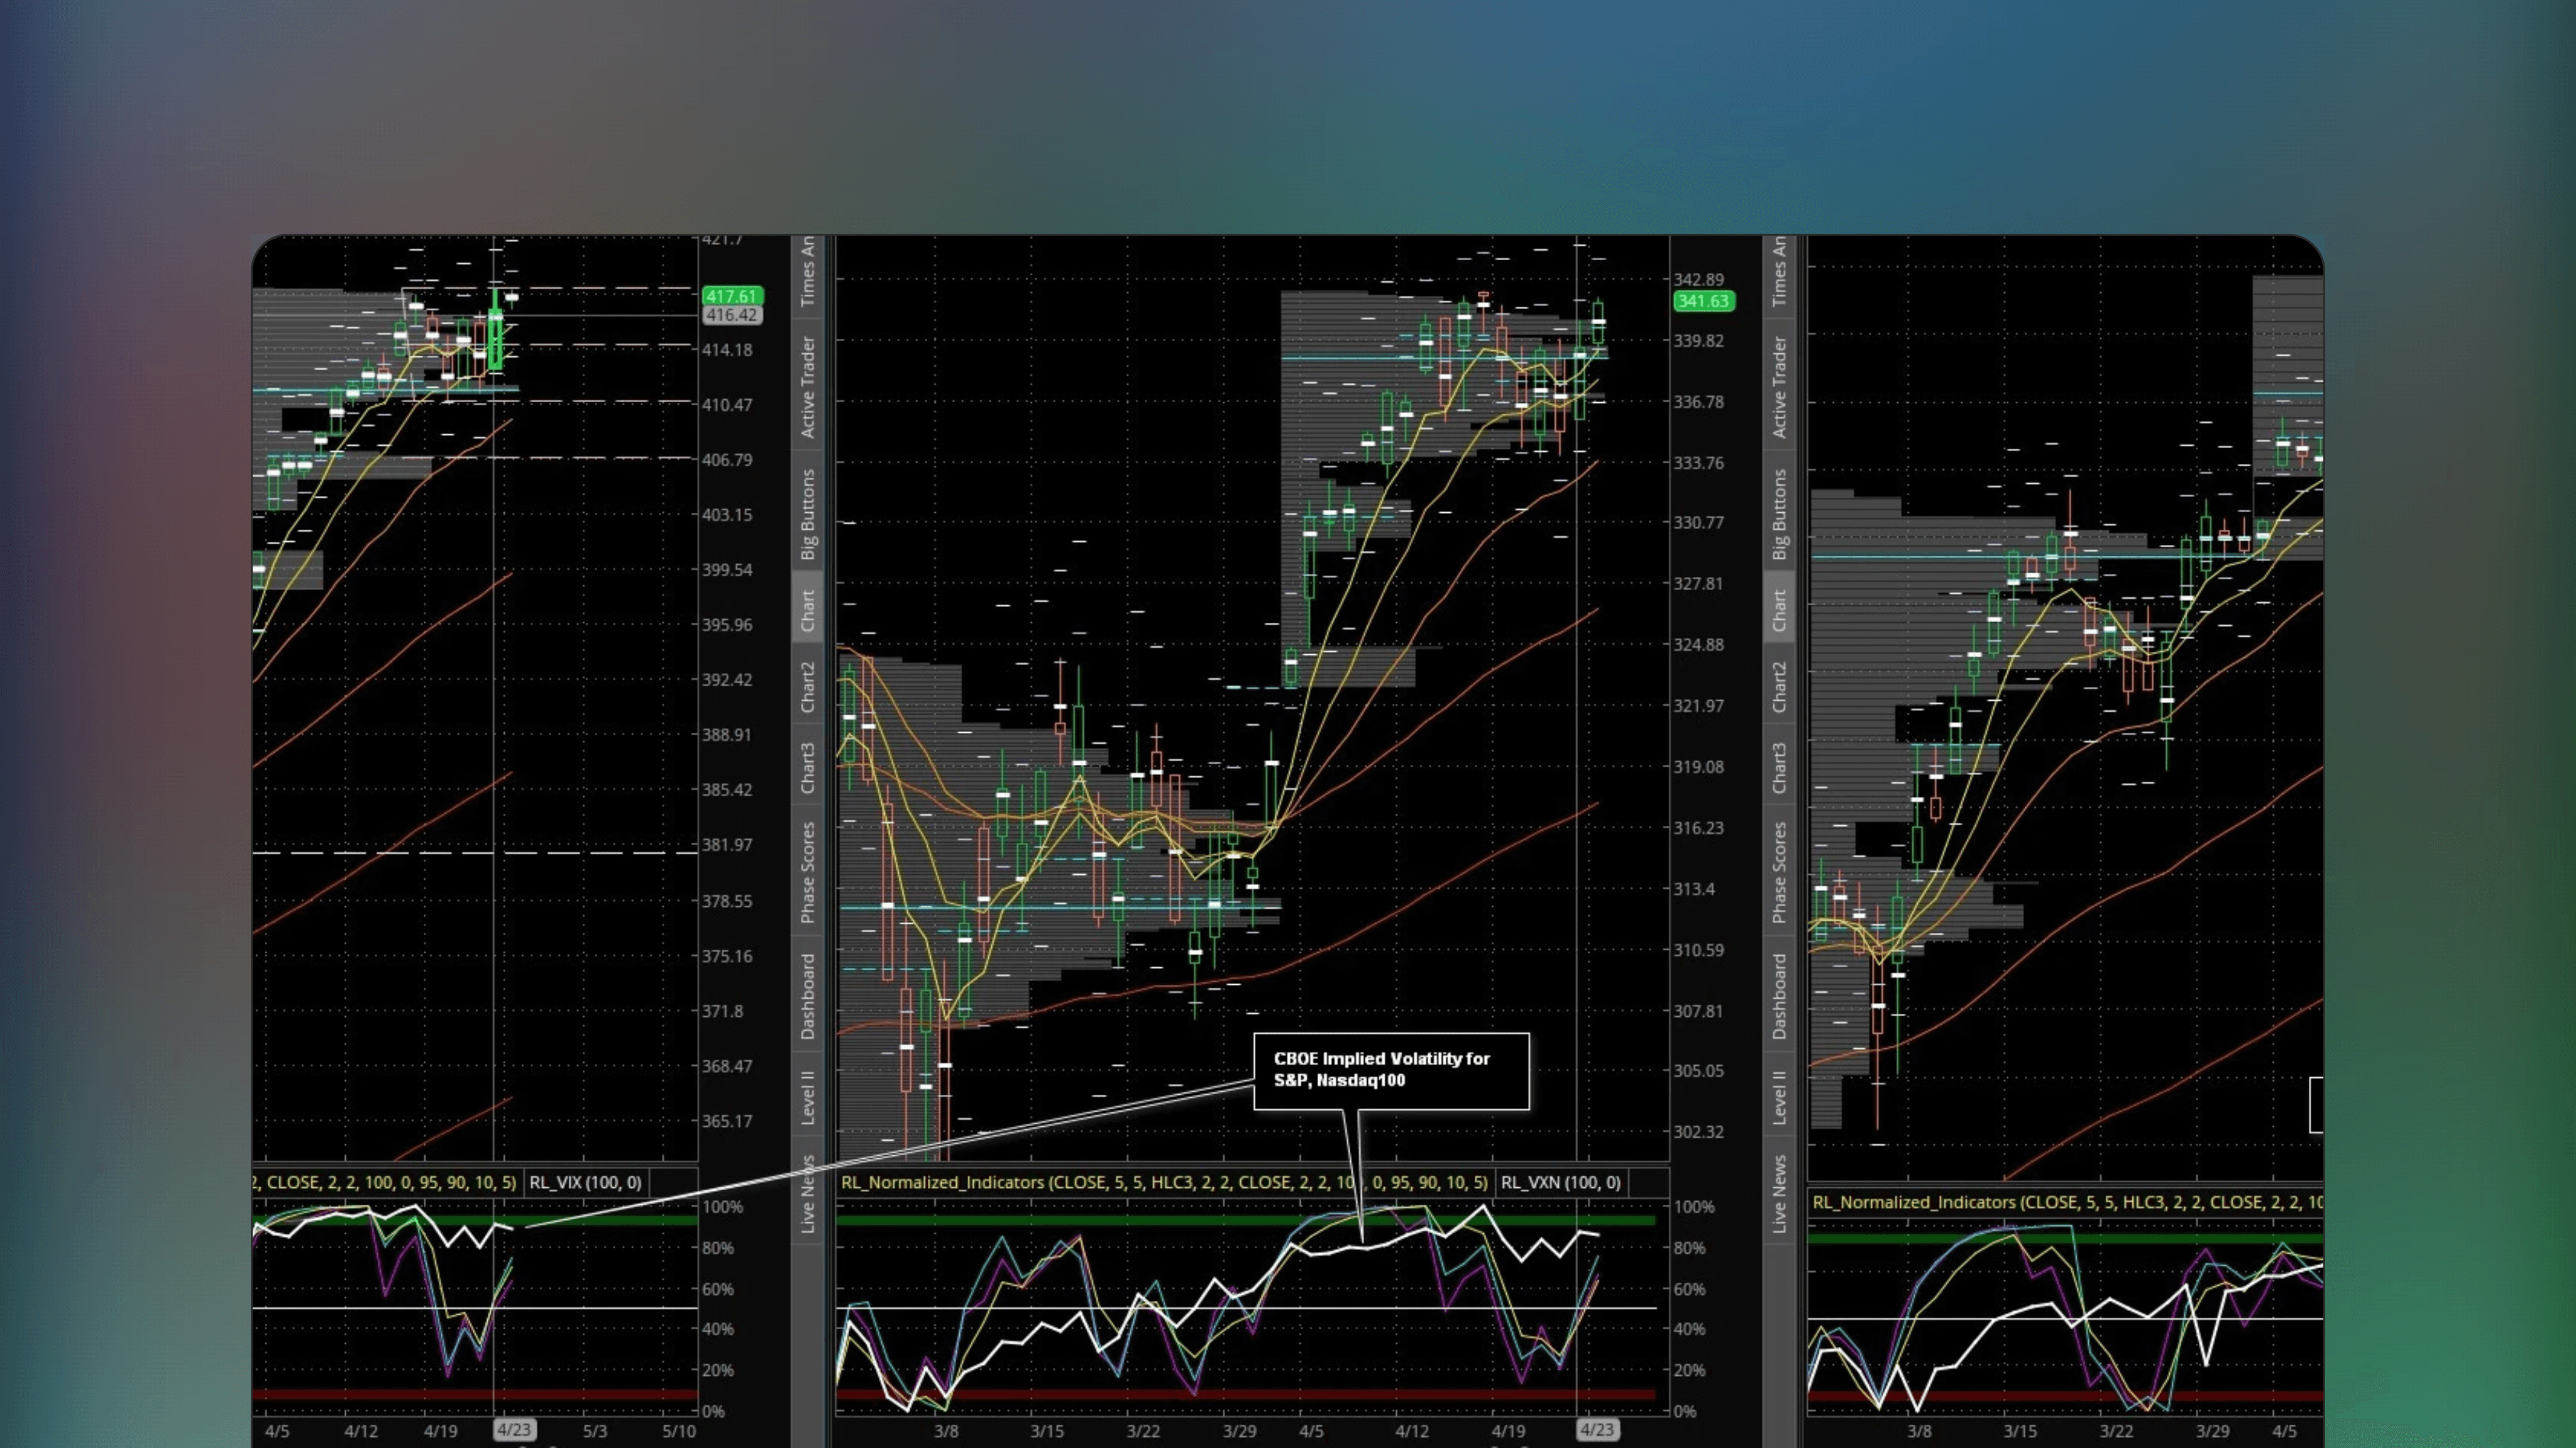
CBOE Implied Volatility Indicator For ThinkOrSwim
🔑
🌐
✅
CBOE Implied Volatility Indicator is a free ThinkorSwim Indicator that aims to track volatility trends in SPY, QQQ, DIA and IWM. Displayed in an oscillator style with normalized values, higher values corresponding to higher implied volatility.

🤖
by samer800
Free
ThinkOrSwim Indicator
Linear Regression Dev ++ For ThinkOrSwim
🔑
🌐
Linear Regression Dev ++ for ThinkOrSwim is a free indicator that analyzes market trends using linear regression channels based on most recent price data. Users should note the channels repaint, but minimally so due to long calculation length.

🤖
by samer800
Free
ThinkOrSwim Indicator
Nadaraya-Watson Envelope - Non Repaint[Sam4cok] For ThinkOrSwim
🔑
✅
🏅
The Nadaraya-Watson Envelope - Non Repaint for ThinkOrSwim is an Indicator that uses the Nadaraya-Watson method to create a non-repainting envelope for identifying price extremes.

🤖
by merryday
Free
ThinkOrSwim Indicator
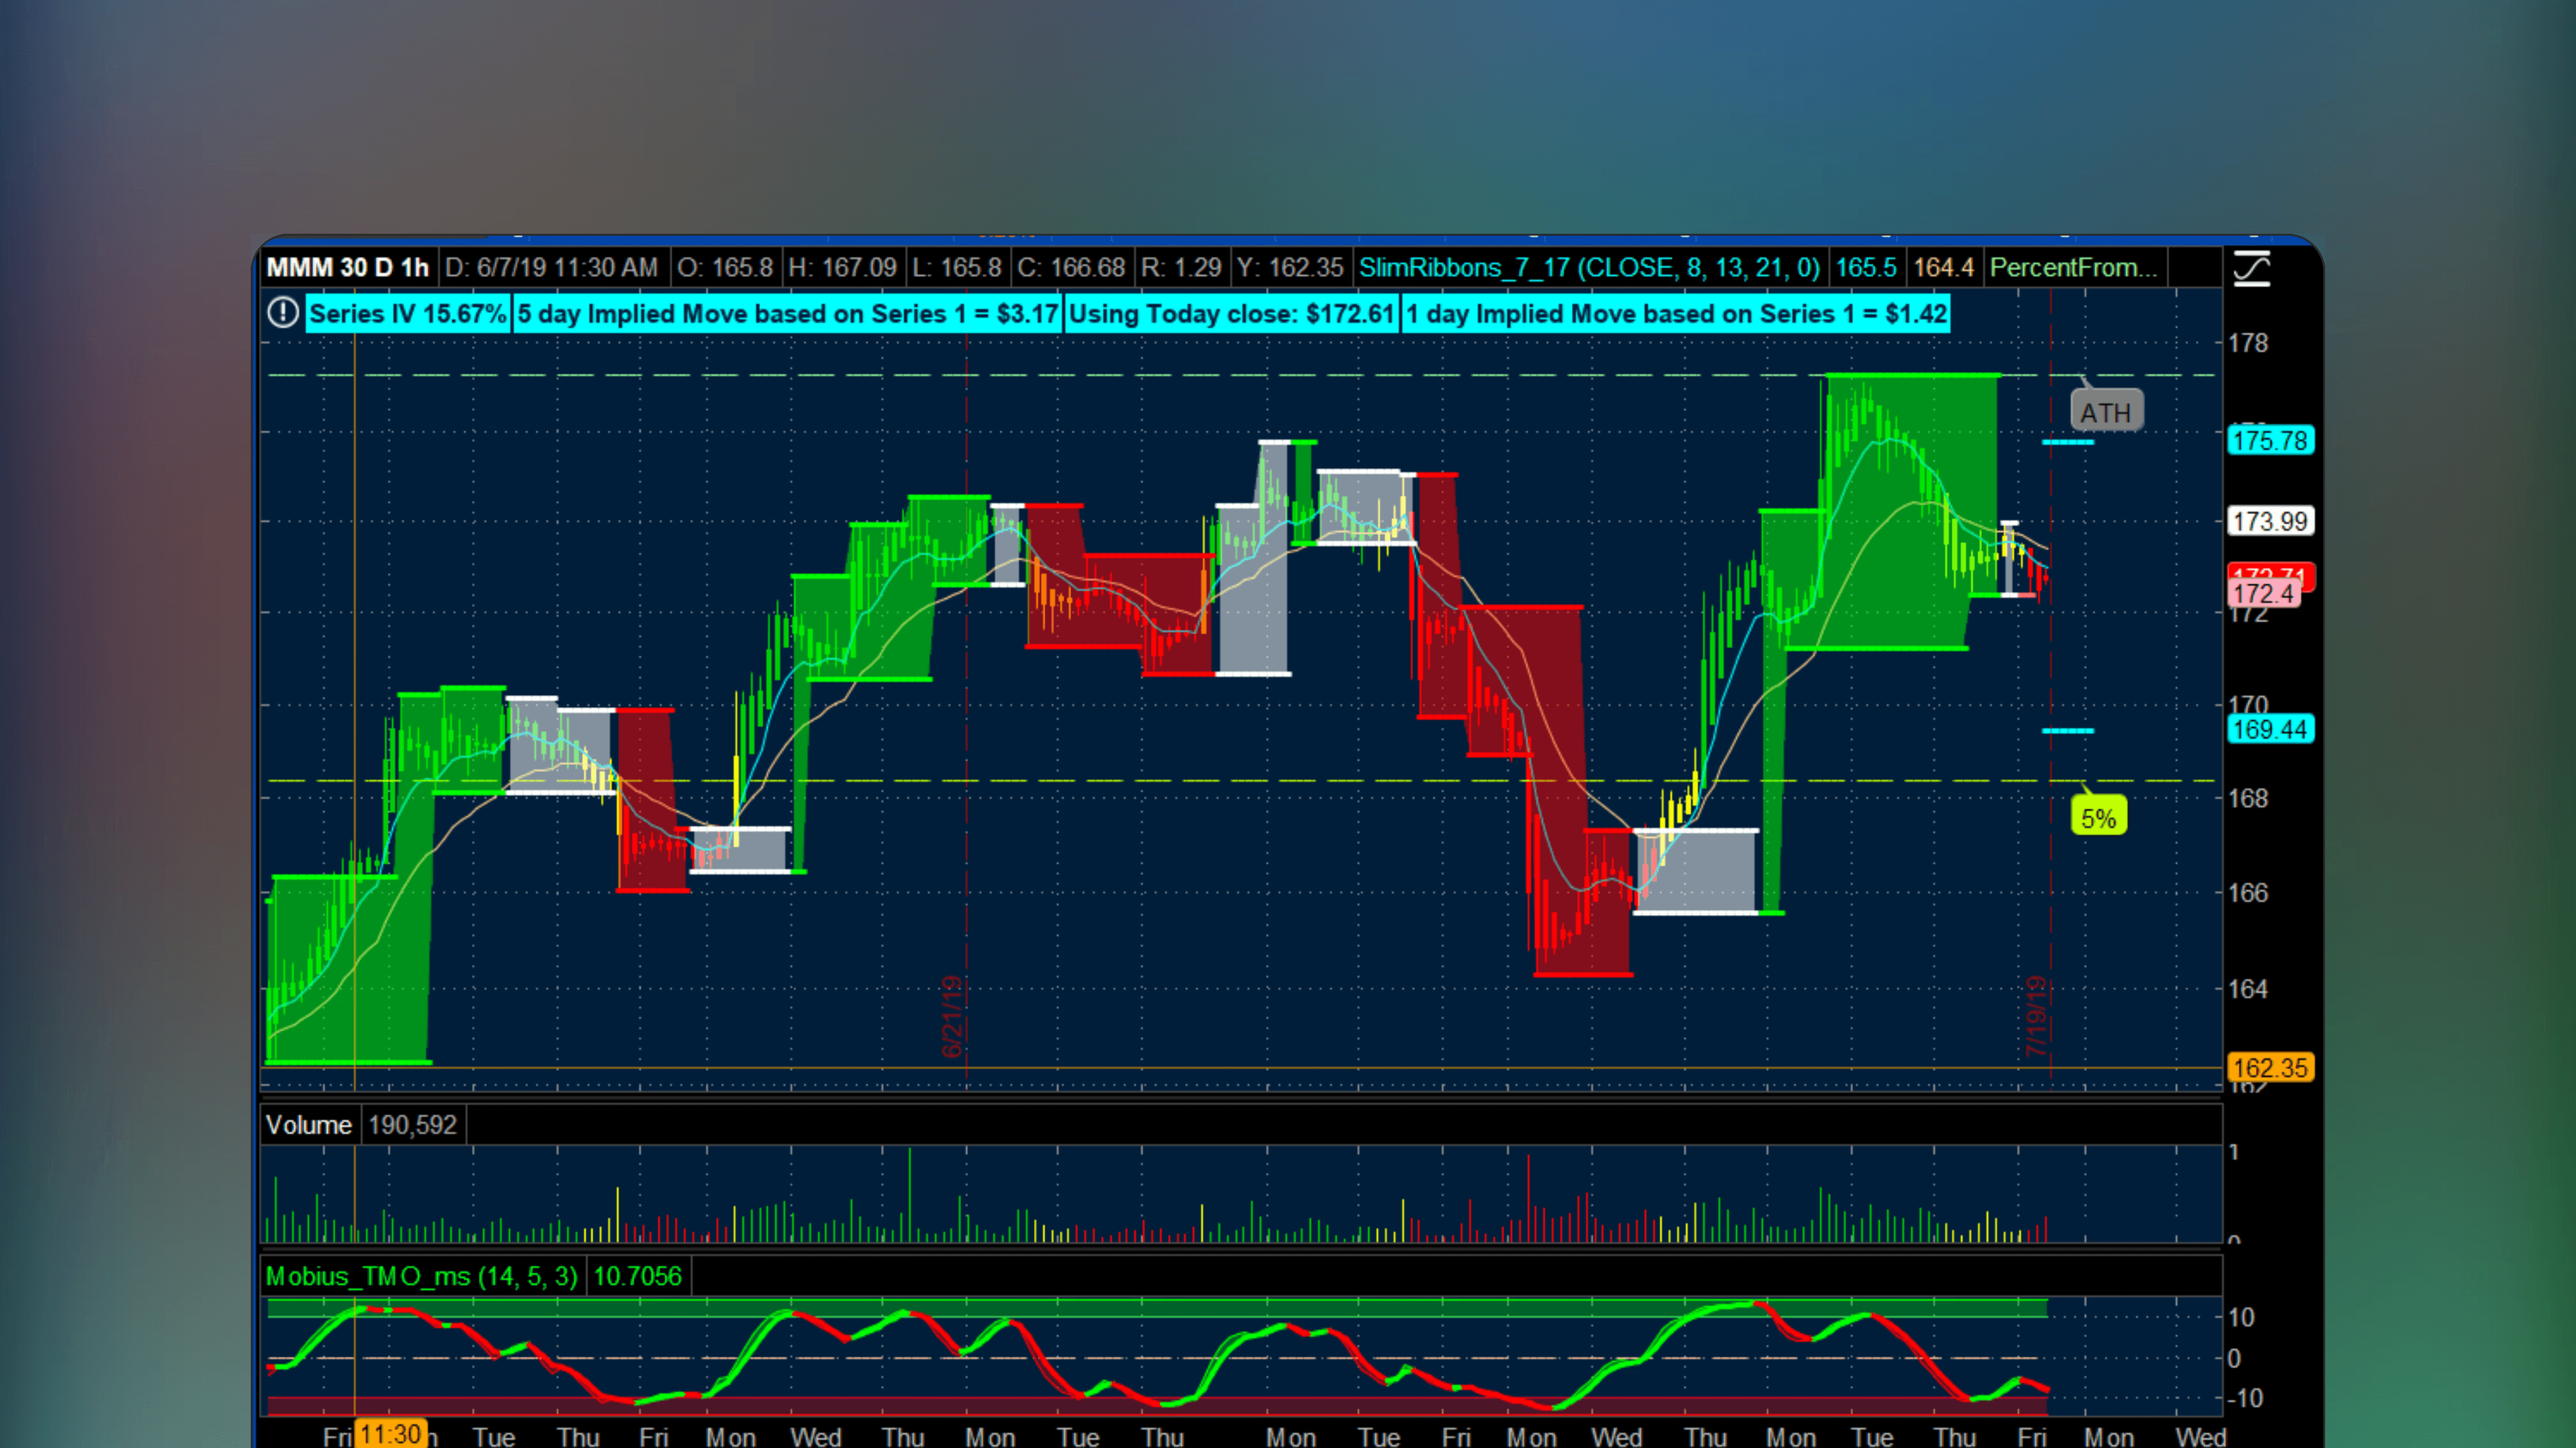
TheoTrade Expected Moves For ThinkOrSwim
🔑
🌐
TheoTrade Expected Moves For ThinkOrSwim is a ThinkOrSwim indicator that uses implied volatility to estimate a stock's potential price range over a specified timeframe.
🤖
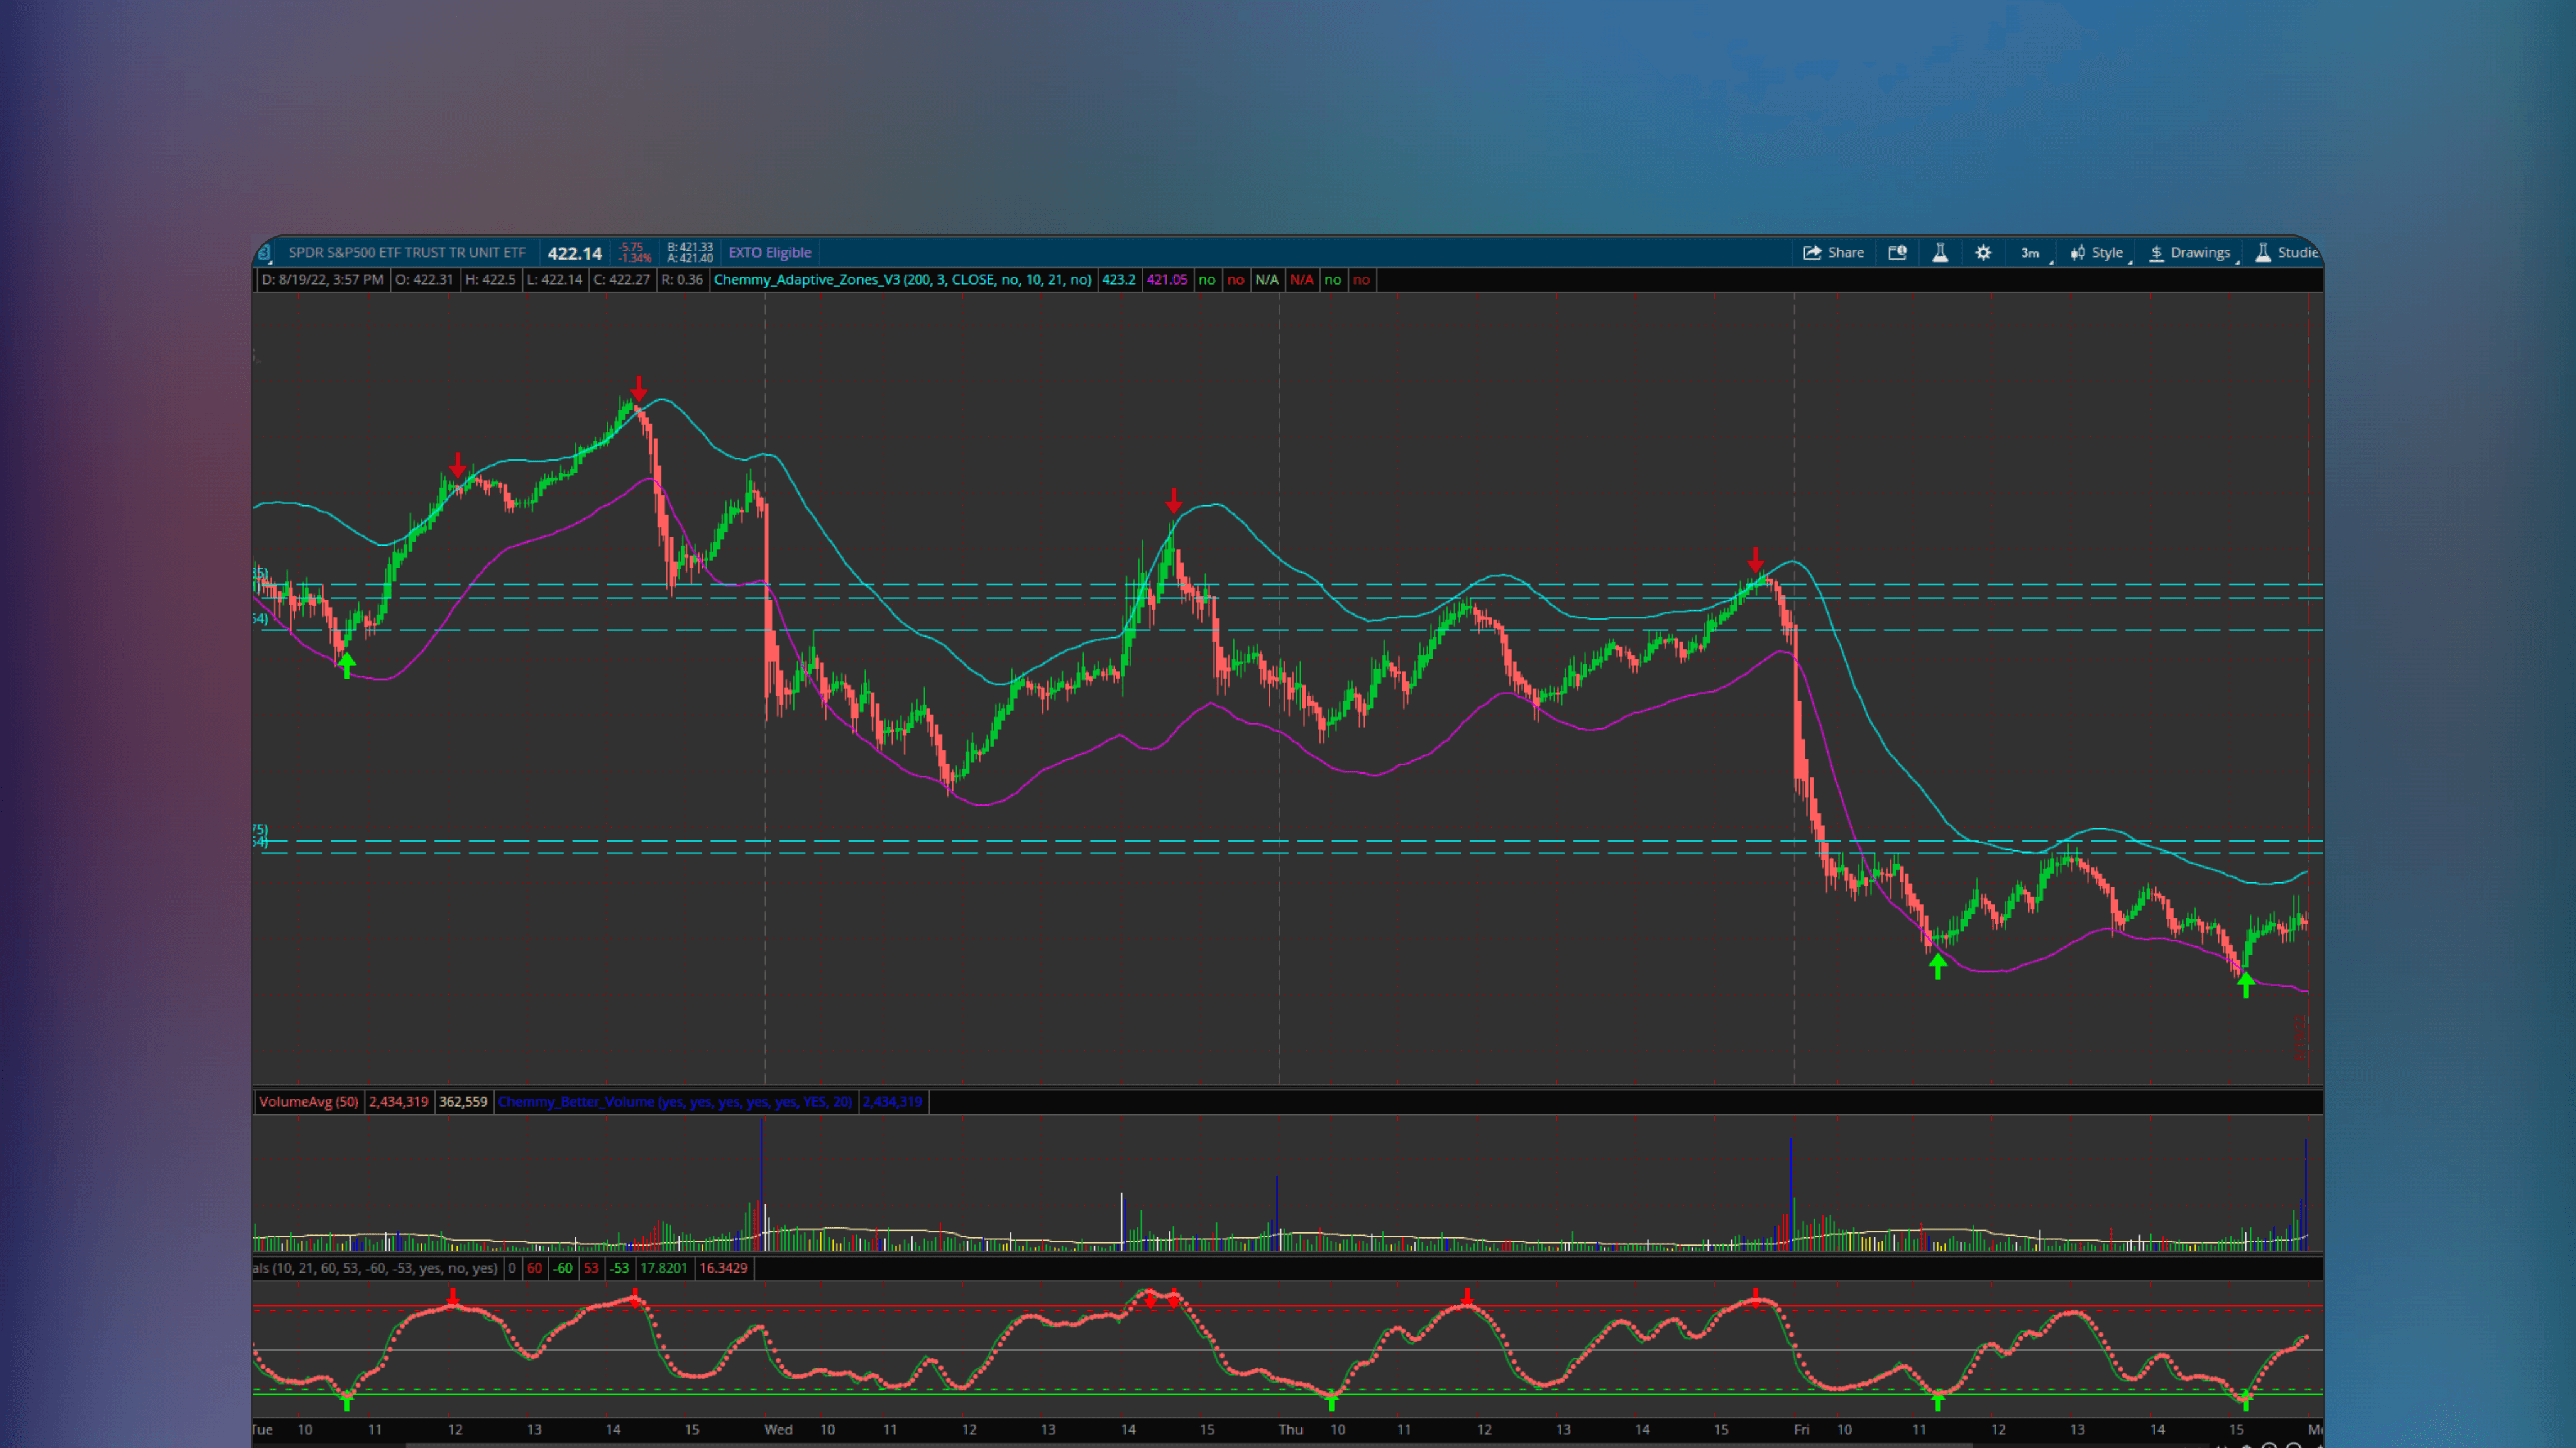
by chemmy
Free
ThinkOrSwim Indicator
Adaptive Zones with Wave Oscillator for Momentum For ThinkOrSwim
🔑
Adaptive Zones with Wave Oscillator for Momentum For ThinkOrSwim is a free ThinkOrSwim indicator that combines adaptive zones and a wave oscillator to dynamically interpret trend cycles and market momentum.
🤖
by futuretony
Free
ThinkOrSwim Indicator
HTF PO3 Indicator For ThinkOrSwim
🔑
🏅
HTF PO3 Indicator For ThinkOrSwim is an Indicator that leverages the ICT Power of 3 concept to analyze market phases by identifying Accumulation, Manipulation and Distribution.

🤖
by chence27
Free
ThinkOrSwim Indicator
mAcDX Reverser For ThinkOrSwim
🔑
🌐
mAcDX Reverser For ThinkOrSwim is a free ThinkOrSwim Indicator that detects strong trend reversals by identifying extreme MACD levels coupled with shifts in ADX above 30, constituting a reversal signal.

🤖
by samer800
Free
ThinkOrSwim Indicator
Support Resistance with Breaks and Retests For ThinkOrSwim
🔑
🌐
🏅
Support Resistance with Breaks and Retests for ThinkOrSwim is an Indicator that identifies key support and resistance levels, as well as breakouts and retests for streamlined, automated price action analysis.
🤖
by samer800
Free
ThinkOrSwim Indicator
Ranges With Targets [ChartPrime] For ThinkOrSwim
🔑
🌐
🏅
Ranges With Targets [ChartPrime] for ThinkOrSwim calculates price ranges with target levels and identifies trend beginnings and endings using breakouts from these ranges.

🤖
by samer800
Free
ThinkOrSwim Indicator
Super 6x: RSI, MACD, Stoch, Loxxer, CCI, & Velocity [Loxx] For ThinkOrSwim
🔑
🌐
Super 6x is an Indicator for ThinkOrSwim that combines RSI, MACD, Stochastic, Loxxer, CCI, and Velocity into a single histogram, allowing users to assess market trends with customizable repainting options.

🤖
by welkin
Free
ThinkOrSwim Indicator
Previous Day High/Low/Close For ThinkOrSwim
🔑
🌐
✅
Previous Day High/Low/Close For ThinkOrSwim is a free Indicator that plots the previous day’s high, low, close and the current day’s open on charts in a clean and clear style, decreasing clutter.

🤖
by futuretony
Free
ThinkOrSwim Indicator
Quarterly Theory For ThinkOrSwim
🔑
✅
Quarterly Theory is a ThinkOrSwim indicator that visualizes and analyzes market cycles through ICT based time cycle concept. The indicator picks up and analyzes distinct cycle phases - accumulation, manipulation, distribution and reversal/continuation.

🤖
by rlohmeyer
Free
ThinkOrSwim Indicator
Auto Significant Price Levels For ThinkOrSwim
🔑
🌐
Auto Significant Price Levels is a free ThinkOrSwim Indicator that automatically identifies and displays key price levels, such standard open, high, low and close as well as pre-market and after-hours highs/lows.

🤖
by benten
Free
ThinkOrSwim Indicator
Average Daily Range Indicator For ThinkOrSwim
🔑
🌐
The Average Daily Range Indicator for ThinkorSwim calculates and displays the average daily price range of the past five days on, highlighting dynamic and adjusting support and resistance levels using most recent daily highs and lows.

🤖
by korygill
Free
ThinkOrSwim Indicator
Magic Fibonacci 1.272 Indicator v2 For ThinkOrSwim
🔑
🌐
The Magic Fibonacci 1.272 Indicator is a ThinkorSwim Indicator that calculates a single Fibonacci level based on custom rules, using previous day's close and current trading day's open as calculation points.

🤖
by mashume
Free
ThinkOrSwim Indicator
/ES Futures Quasi-Algo 1 Hour Out Prediction For ThinkOrSwim
🔑
/ES Futures Quasi-Algo 1 Hour Out Prediction for ThinkorSwim is an Indicator that utilizes historical and current S&P 500 futures data to forecast short-term price movements within the next hour.
🤖
by traderzen
Free
ThinkOrSwim Indicator
MTF Anticipated Price Level Indicator For ThinkOrSwim
🔑
🌐
MTF Anticipated Price Level Indicator for ThinkOrSwim is an indicator that uses Multi-Time Frame analysis and VWAP profiles to identify anticipated points of interest based on historical price data.
🤖
by m_morisette
Free
ThinkOrSwim Indicator
Standard Deviation Channels X3 For ThinkOrSwim
🔑
🌐
✅
Standard Deviation Channels X3 For ThinkOrSwim is an Indicator that calculates standard deviation channels to visualize statistical deviations from the mean, enabling users to identify potential trend reversions based on historical price action.
🤖
by cos251
Free
ThinkOrSwim Indicator
Phoenix Finder Trend Strength Indicator For ThinkOrSwim
🔑
🏅
Phoenix Finder Trend Strength Indicator for ThinkorSwim is an Indicator that plots candles for 14 stocks based on Phoenix Strength, identifying trending states within specific sectors. Spot outperforming stocks at glance using this indicator.
🤖
by benten
Free
ThinkOrSwim Indicator
High Probability Setup Indicator For ThinkOrSwim
🔑
🏅
The High Probability Setup Indicator for ThinkorSwim is an indicator based on another TradingView Indicato highlighting reversal setups with stacked confluence from multiple indicators. Includes distinction between low, medium and high probability signals based on amount of confluence involved.
🤖
by goingdark365
Free
ThinkOrSwim Indicator
Bollinger bandswith Rsi ,Mfi, Rvol For ThinkOrSwim
🔑
🌐
Bollinger bandswith Rsi, Mfi, Rvol For ThinkOrSwim is a free ThinkOrSwim indicator combining Bollinger Bands with RSI, MFI, and relative volume into one for reading sentiment from multiple indicators in one view.
🤖
by mbarcala
Free
ThinkOrSwim Indicator
dBands Upper Indicator For ThinkOrSwim
🔑
🌐
✅
dBands Upper Indicator For ThinkOrSwim is a free Indicator that combines Bollinger Bands and Keltner Channel into one tool with variety of customziation options. Useful for identifying support, resistance as well as potential breakouts.
🤖
by ommni007
Free
ThinkOrSwim Indicator
Day of Week Gap Analytics For ThinkOrSwim
🔑
✅
Day of Week Gap Analytics For ThinkOrSwim is a free Indicator that analyzes cumulative tick changes on gap bars for each day of the week for discovering time based statistical edge.
🤖
by benten
Free
ThinkOrSwim Indicator
Rahul Mohindar Oscillator (RMO) Indicator For ThinkOrSwim
🔑
The Rahul Mohindar Oscillator (RMO) Indicator for ThinkorSwim identifies potential market reversals and momentum slowdowns based on the oscillator movement. Useful for visually identifying different trending stages.
🤖
by tptrades
Free
ThinkOrSwim Indicator
Wick Pressure For ThinkOrSwim
🔑
Wick Pressure For ThinkOrSwim is an Indicator that analyzes multiple wick formations at overbought and oversold levels for a filtered and refined identifying of buying and selling pressure.
🤖
by benten
Free
ThinkOrSwim Indicator
Leledc Exhaustion Indicator For ThinkOrSwim
🔑
Leledc Exhaustion Indicator for ThinkorSwim is an indicator based on price action patterns associated with potential trend exhaustion, signaling when a trend may be ending or nearing a correction in its current direction.
🤖
by armybender
Free
ThinkOrSwim Indicator
Ehler's Instantaneous Trend [LazyBear] For ThinkOrSwim
🔑
Ehler's Instantaneous Trend [LazyBear] For ThinkOrSwim is a free moving average Indicator based on Ehler's Instantaneous Trend. This moving average is calculated based on John Ehler's earliest implementations, acting similarly to Hull Moving Average (HMA) with minimal lag.
🤖
by greco26
Free
ThinkOrSwim Indicator
Fair Value Gap (FVG) For ThinkOrSwim
🔑
✅
Fair Value Gap (FVG) For ThinkOrSwim is an Indicator that identifies fair value gaps - areas of supply and demand mismatch - on intraday charts by plotting magenta and green lines.
🤖
by rlohmeyer
Free
ThinkOrSwim Indicator
Relative Opening Range Stats For ThinkOrSwim
🔑
🌐
Relative Opening Range Stats For ThinkOrSwim is a ThinkOrSwim Indicator that uses community-developed code to analyze the first and last bars of each trading day and their relative volumes, identifying key market periods based on opening range statistics.
🤖
by markos
Free
ThinkOrSwim Indicator
Fractal Boxes by Mobius For ThinkOrSwim
🔑
Fractal Boxes by Mobius for ThinkorSwim is an indicator that uses altered fractals to identify and highlight market states, such as breakouts, consolidation and trends up/down.
🤖
by rlohmeyer
Free
ThinkOrSwim Indicator
CBOE Implied Volatility Indicator For ThinkOrSwim
🔑
🌐
✅
CBOE Implied Volatility Indicator is a free ThinkorSwim Indicator that aims to track volatility trends in SPY, QQQ, DIA and IWM. Displayed in an oscillator style with normalized values, higher values corresponding to higher implied volatility.
🤖
by samer800
Free
ThinkOrSwim Indicator
Linear Regression Dev ++ For ThinkOrSwim
🔑
🌐
Linear Regression Dev ++ for ThinkOrSwim is a free indicator that analyzes market trends using linear regression channels based on most recent price data. Users should note the channels repaint, but minimally so due to long calculation length.
🤖
by samer800
Free
ThinkOrSwim Indicator
Nadaraya-Watson Envelope - Non Repaint[Sam4cok] For ThinkOrSwim
🔑
✅
🏅
The Nadaraya-Watson Envelope - Non Repaint for ThinkOrSwim is an Indicator that uses the Nadaraya-Watson method to create a non-repainting envelope for identifying price extremes.
🤖
by merryday
Free
ThinkOrSwim Indicator
TheoTrade Expected Moves For ThinkOrSwim
🔑
🌐
TheoTrade Expected Moves For ThinkOrSwim is a ThinkOrSwim indicator that uses implied volatility to estimate a stock's potential price range over a specified timeframe.
🤖
by chemmy
Free
ThinkOrSwim Indicator
Adaptive Zones with Wave Oscillator for Momentum For ThinkOrSwim
🔑
Adaptive Zones with Wave Oscillator for Momentum For ThinkOrSwim is a free ThinkOrSwim indicator that combines adaptive zones and a wave oscillator to dynamically interpret trend cycles and market momentum.
🤖
by futuretony
Free
ThinkOrSwim Indicator
HTF PO3 Indicator For ThinkOrSwim
🔑
🏅
HTF PO3 Indicator For ThinkOrSwim is an Indicator that leverages the ICT Power of 3 concept to analyze market phases by identifying Accumulation, Manipulation and Distribution.
🤖
by traderzen
Free
ThinkOrSwim Indicator
MTF Anticipated Price Level Indicator For ThinkOrSwim
🔑
🌐
MTF Anticipated Price Level Indicator for ThinkOrSwim is an indicator that uses Multi-Time Frame analysis and VWAP profiles to identify anticipated points of interest based on historical price data.
🤖
by m_morisette
Free
ThinkOrSwim Indicator
Standard Deviation Channels X3 For ThinkOrSwim
🔑
🌐
✅
Standard Deviation Channels X3 For ThinkOrSwim is an Indicator that calculates standard deviation channels to visualize statistical deviations from the mean, enabling users to identify potential trend reversions based on historical price action.
🤖
by cos251
Free
ThinkOrSwim Indicator
Phoenix Finder Trend Strength Indicator For ThinkOrSwim
🔑
🏅
Phoenix Finder Trend Strength Indicator for ThinkorSwim is an Indicator that plots candles for 14 stocks based on Phoenix Strength, identifying trending states within specific sectors. Spot outperforming stocks at glance using this indicator.
🤖
by benten
Free
ThinkOrSwim Indicator
High Probability Setup Indicator For ThinkOrSwim
🔑
🏅
The High Probability Setup Indicator for ThinkorSwim is an indicator based on another TradingView Indicato highlighting reversal setups with stacked confluence from multiple indicators. Includes distinction between low, medium and high probability signals based on amount of confluence involved.
🤖
by goingdark365
Free
ThinkOrSwim Indicator
Bollinger bandswith Rsi ,Mfi, Rvol For ThinkOrSwim
🔑
🌐
Bollinger bandswith Rsi, Mfi, Rvol For ThinkOrSwim is a free ThinkOrSwim indicator combining Bollinger Bands with RSI, MFI, and relative volume into one for reading sentiment from multiple indicators in one view.
🤖
by mbarcala
Free
ThinkOrSwim Indicator
dBands Upper Indicator For ThinkOrSwim
🔑
🌐
✅
dBands Upper Indicator For ThinkOrSwim is a free Indicator that combines Bollinger Bands and Keltner Channel into one tool with variety of customziation options. Useful for identifying support, resistance as well as potential breakouts.
🤖
by ommni007
Free
ThinkOrSwim Indicator
Day of Week Gap Analytics For ThinkOrSwim
🔑
✅
Day of Week Gap Analytics For ThinkOrSwim is a free Indicator that analyzes cumulative tick changes on gap bars for each day of the week for discovering time based statistical edge.
🤖
by benten
Free
ThinkOrSwim Indicator
Rahul Mohindar Oscillator (RMO) Indicator For ThinkOrSwim
🔑
The Rahul Mohindar Oscillator (RMO) Indicator for ThinkorSwim identifies potential market reversals and momentum slowdowns based on the oscillator movement. Useful for visually identifying different trending stages.
🤖
by tptrades
Free
ThinkOrSwim Indicator
Wick Pressure For ThinkOrSwim
🔑
Wick Pressure For ThinkOrSwim is an Indicator that analyzes multiple wick formations at overbought and oversold levels for a filtered and refined identifying of buying and selling pressure.
🤖
by benten
Free
ThinkOrSwim Indicator
Leledc Exhaustion Indicator For ThinkOrSwim
🔑
Leledc Exhaustion Indicator for ThinkorSwim is an indicator based on price action patterns associated with potential trend exhaustion, signaling when a trend may be ending or nearing a correction in its current direction.
Discover trading edge
Discover trading edge
Indicators, Platforms & Education
Indicators, Platforms & Education
TradersList
Discover trading edge
Join Telegram
Weekly listings
Join Telegram
Disclaimer
Our goal is to achieve greater transparency, guidance and safety in trading and investing by providing means to discover, research and discuss trading/investing related sites/services.
Content provided on this site is not financial advice, meant for educational purposes only. TradersList does not endorse or guarantee any result for listed sites/services. Do your own research.
Read full disclaimer
TradersList
Discover trading edge
Join Telegram
Disclaimer
Our goal is to achieve greater transparency, guidance and safety in trading and investing by providing means to discover, research and discuss trading/investing related sites/services.
Content provided on this site is not financial advice, meant for educational purposes only. TradersList does not endorse or guarantee any result for listed sites/services. Do your own research.
Read full disclaimer